Microbes produce different types of gaseous end products during growth and metabolism.
Microbes
Organic substractesutilised by microbes
End product
Both A and C
The correct Answer is:D
Microbes produce different types of gaseous end products during growth and metabolism. The type of the gas producd depends upon the microbes and organic substrates utilised by microbes.
Topper's Solved these Questions
- MICROBES IN HUMAN WELFAREBOOK - A2ZCHAPTER - MICROBES IN HUMAN WELFAREEXERCISE - Section A: Topicwise Question ( Topic 5 : Microbes As Biocontrol Agents)
9 Videos
- MICROBES IN HUMAN WELFAREBOOK - A2ZCHAPTER - MICROBES IN HUMAN WELFAREEXERCISE - Section A: Topicwise Question ( Topic 6 : Microbes As Biofertilisers)
11 Videos
- MICROBES IN HUMAN WELFAREBOOK - A2ZCHAPTER - MICROBES IN HUMAN WELFAREEXERCISE - Section A: Topicwise Question ( Topic 3 : Microbes In Sewage Treatment)
13 Videos
- HUMAN REPRODUCTIONBOOK - A2ZCHAPTER - HUMAN REPRODUCTIONEXERCISE - Section D: Chapter-end Test
50 Videos
- MOCK TEST 1 BOOK - A2ZCHAPTER - MOCK TEST 1 EXERCISE - EXERCISE
2 Videos
Similar Questions
Knowledge Check
The end product of carbohydrate metabolism is
ACO2andH2OBNH3andCO2CNH3andH2ODCO2Morphologically different types of spores are produced by
ALycopodium and DryopoterisBLycopodium and salviniaCEquisetum and DryopoterisDSelaginella and salviniaMale produces two different types of gametes, it is called
Asex-determinationBFemale homogamyCMale heterogamyDAll of these
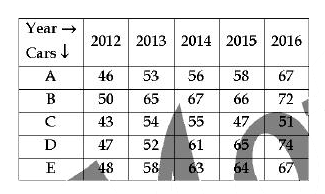
The table shows the production of different types of cars

The average production of type A cars during the five years is what percent of the total production of type C cars during the five years?
View SolutionWhich of the following carbide produces different gaseous product as compared to other, when reacted with water?
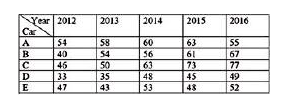
View SolutionThe table shows the production of different types of cars (in thousands).

The total production of types E cars in 2012 and 2013 is approximately what percent more than the average production of type A cars during the years 2012 to 2016?
View SolutionThe table shows the production of different types of cars (in thousands).
यह तालिका एक कंपनी द्वारा 5 वर्षों में अलग-अलग कारों के उत्पादन (हज़ार में ) को दर्शाती है | The total production of type E cars in 2012 and 2013 is approximately what percent more than the average production of type A cars during the years 2012 to 2016?
2012 और 2013 में E प्रकार की कारों का कुल उत्पादन 2012 से 2016 के दौरान A प्रकार की कारों के औसत उत्पादन से लगभग कितना प्रतिशत अधिक है ?
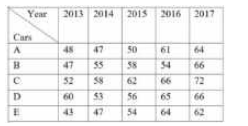
View SolutionThe table shows the production of different types of cars (in thousands).
यह तालिका एक कंपनी द्वारा अलग-अलग कारों के उत्पादन ( हज़ार में ) को दर्शाती है | The total production of type B cars during 2013 to 2016 is approximately what percent less than the total production of cars in 2017?
2013 से 2016 के दौरान B प्रकार की कारों का कुल उत्पादन 2017 में कारों के कुल उत्पादन से लगभग कितना प्रतिशत कम है ?
View Solution
