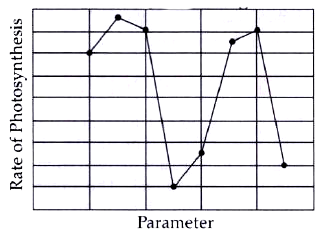
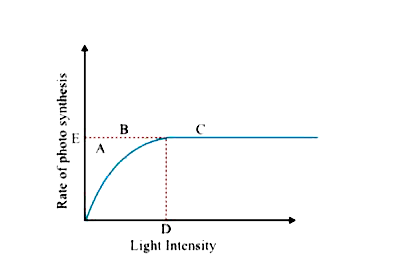
Rate of photosynthesis in hydrophytes depends on various parameters. The adjacent graph shows the effect of one parameter (while keeping all the other constant) on the rate of photosynthesis. Rate of photosynthesis is plotted on Y axis. Identify the parameter which is plotted along X axis :
light intensity
wavelength
temperature
CO2 concentration
The correct Answer is:B
The shown parameter is wavelength as the rate of photosynthesis is increasing and decreasing as per the different wavelengths of light, it is not showing a constant trend.
Topper's Solved these Questions
- OLYMPIAD 2019 - 20BOOK - OSWAL PUBLICATIONCHAPTER - OLYMPIAD 2019 - 20EXERCISE - BIOLOGY QUESTIONS (Control and Coordination)
2 Videos
- OLYMPIAD 2019 - 20BOOK - OSWAL PUBLICATIONCHAPTER - OLYMPIAD 2019 - 20EXERCISE - BIOLOGY QUESTIONS (Reproduction in organisms)
2 Videos
- NTSE 2019 - 20 BOOK - OSWAL PUBLICATIONCHAPTER - NTSE 2019 - 20 EXERCISE - (BIOLOGY) WHY DO WE FALL ILL (STAGE - 1)
2 Videos
- OUR ENVIRONMENTBOOK - OSWAL PUBLICATIONCHAPTER - OUR ENVIRONMENTEXERCISE - BOARD CORNER ( SHORT ANSWER TYPE QUESTIONS)
8 Videos
Similar Questions
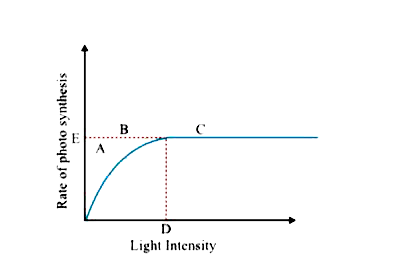
The figure shows the effect of light on the rate of photosynthesis. Based on the graph, answer the following questions :
What do region C and D represent on the curve ?
View SolutionFigure shows the effect of light on the rate of photosynthesis.
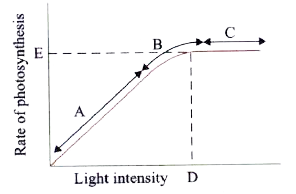
Based on the graph, answer the following questions.
What do C and D represent on the curve?
View Solution
Knowledge Check
Study the given graph showing the efect of light intensity on the rate of photosynthesis. Which of the following statemetns regarding this is correct?
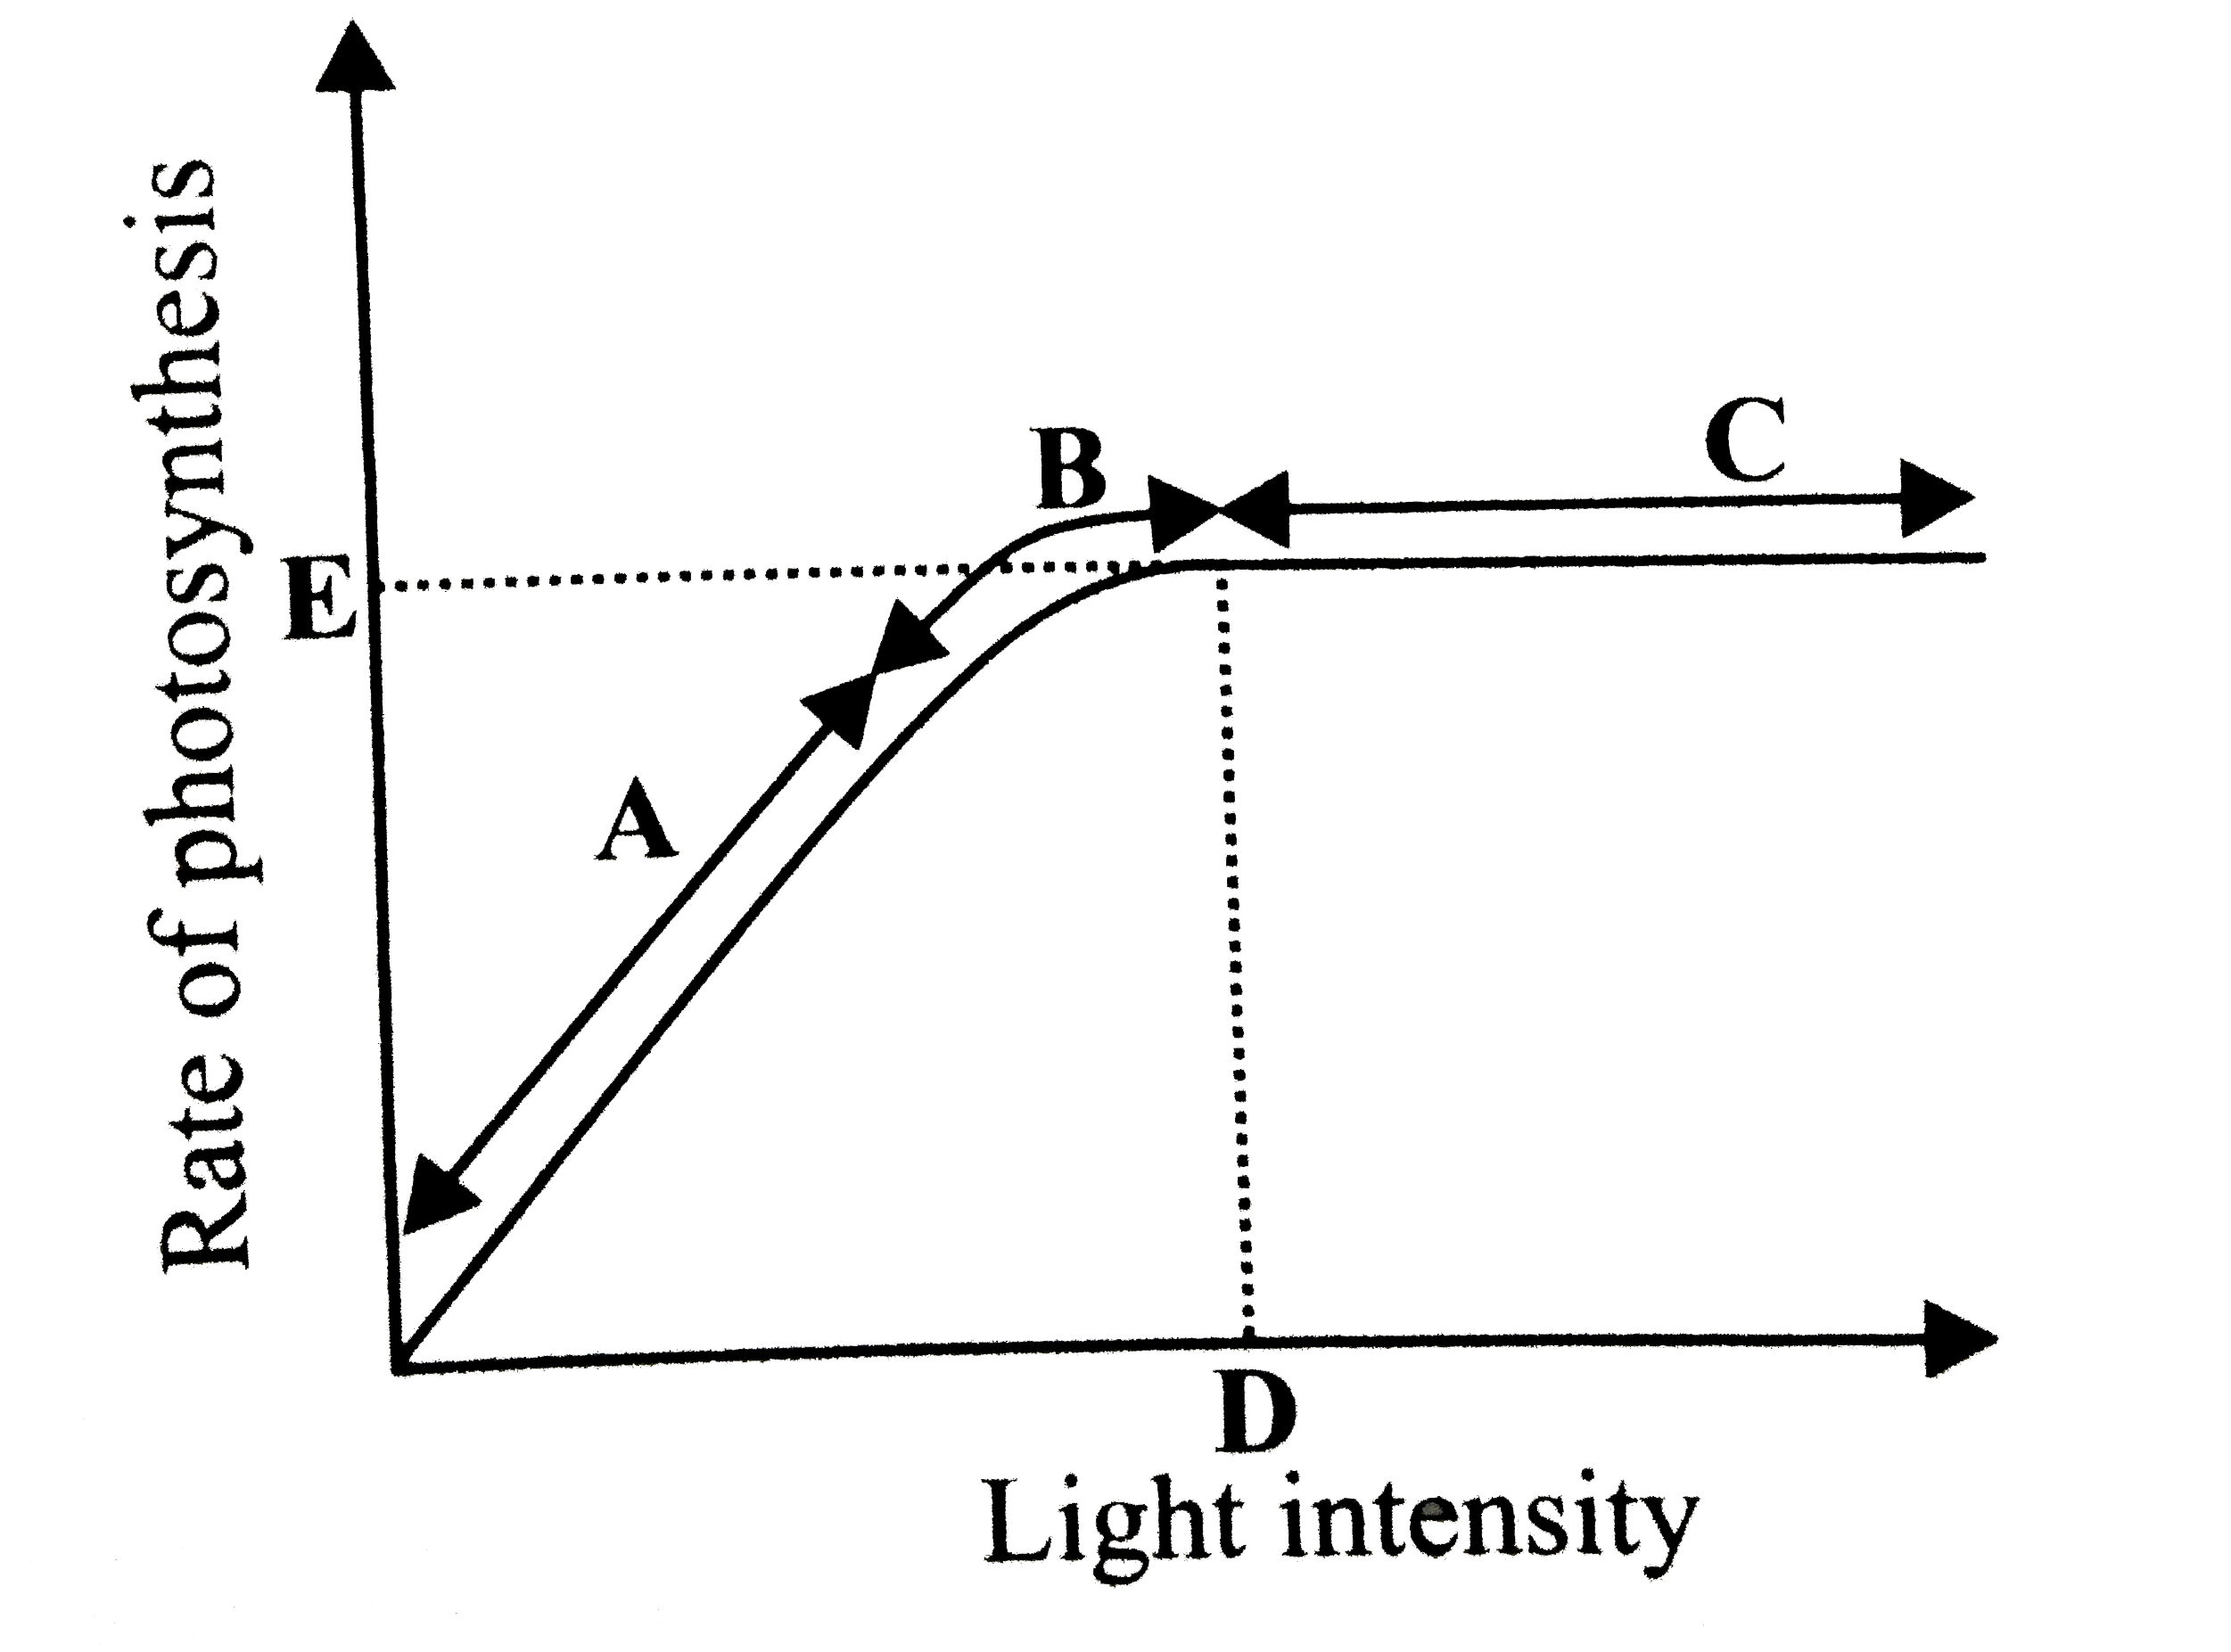 ALight is a limiting factor in the region a.BRegion C represents that rate of photosynthesis is because some other factor became limiting.Cpoint D rrepresents the intensity of light at which some other factor became limitingDAll of these
In the graph shown in fig. the time is plotted along x-axis. Which quantity associated with the projectile motion is plotted along the y -axis:-
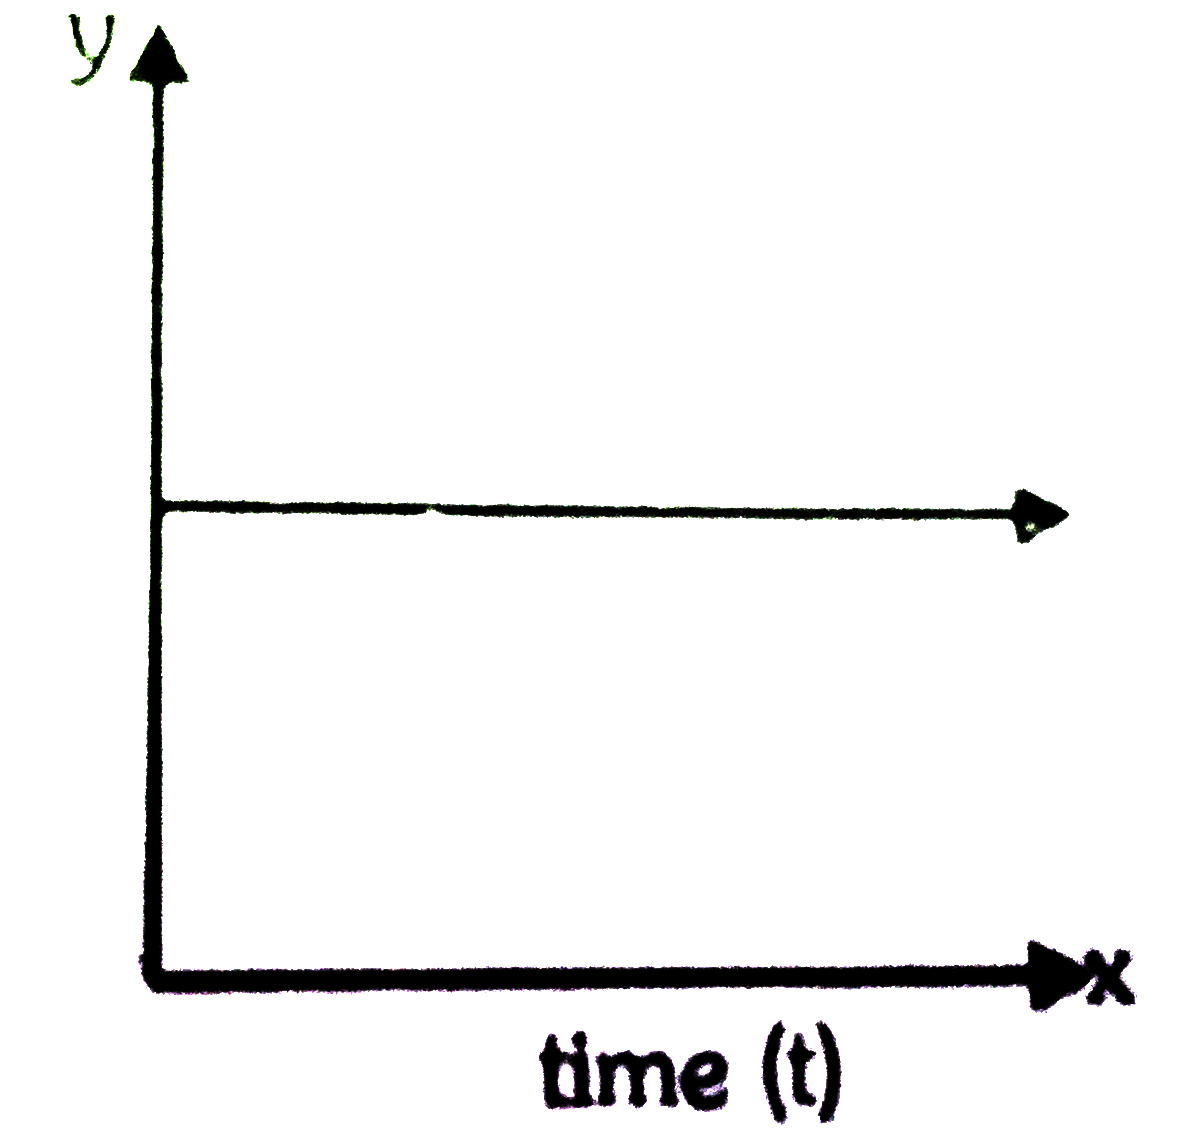 Akinetic energyBmomentumChorizontal velocityDnone of the above
When two plants L and M were exposed to different light intensities and temperature they showed changes in their rates of photosynthesis. Which have been represented in the following graph.
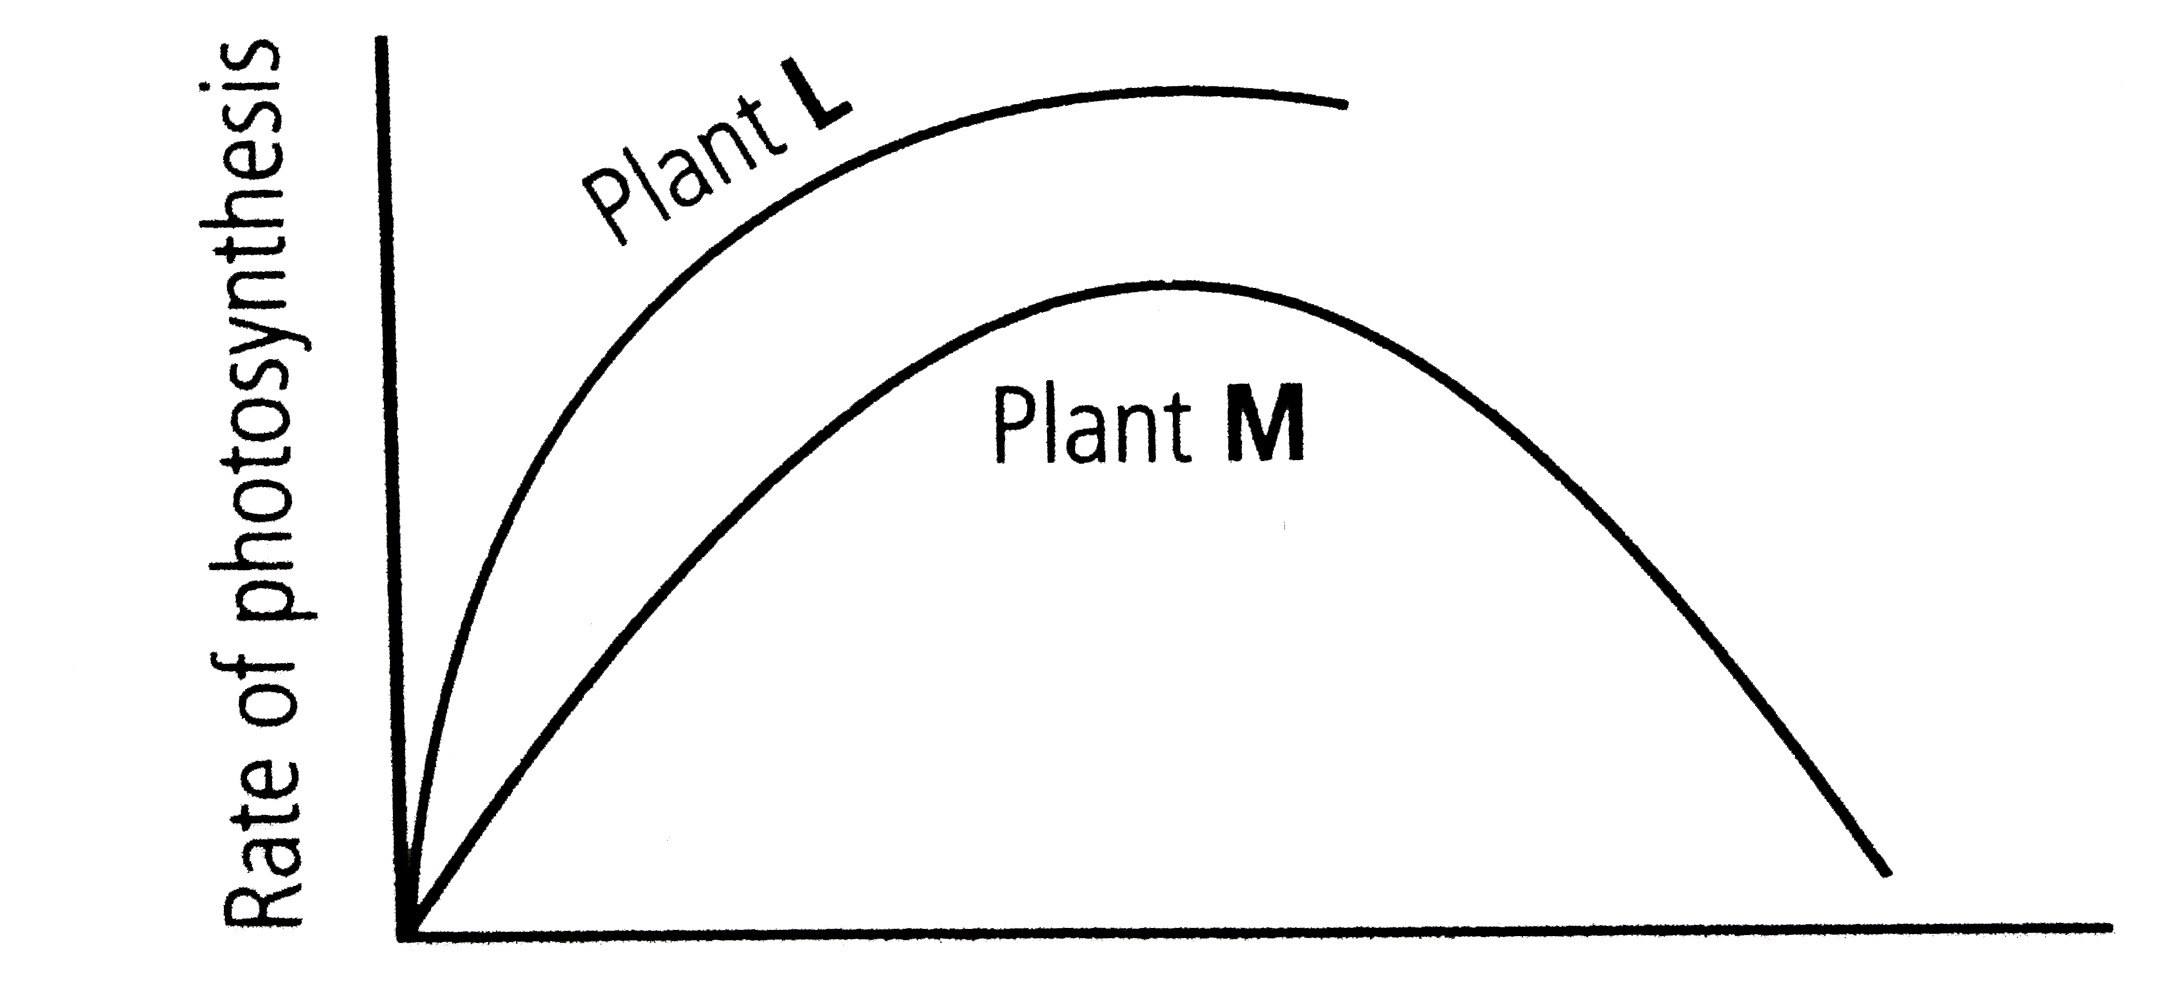
The graph indicates thatAPlant L is a C3 plant for which the light saturation point is 100% of full sunlightBPlant M is a C4 plant for which the optimum temperature s around 20∘CCPlant M is a C3 plant which is more affected at higher temperature and higher light intensity as compared to palnt LDplant L is a C4 plant and cannot function at light intensities above the saturation point.
Figure shows the effect of light on the rate of photosynthesis.
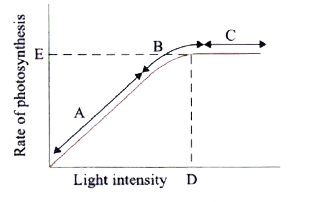
Based on the graph, answer the following questions.
What would be the limiting factors in region A?
View SolutionFigure shows the effect of light on the rate of photosynthesis.
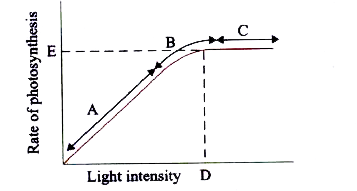
Based on the graph, answer the following questions.
At which point/s (A, B, or C) in the curve is light a limiting factor?
View SolutionThe figure shows the effect of light on the rate of photosynthesis. Based on the graph, answer the following questions :
What could be the limiting factor(s) in region A ?
View SolutionThree infinitely long thin wires, each carrying current i in the same direction, are in the x−y plane of a gravity free space . The central wire is along the y−aξs while the other two are along x=±d.
(i) Find the locus of the points for which the magnetic field B is zero.
(ii) If the central wire is displaced along the Z−direction by a small amount and released, show that it will excecute simple harmonic motion . If the linear density of the wires is λ, find the frequency of oscillation.
View SolutionFor a zero order reaction a plot of rate (along Y-axis) and concentration (along X-axis) is
View Solution
