Study the graph given below and answer the questions that follow:
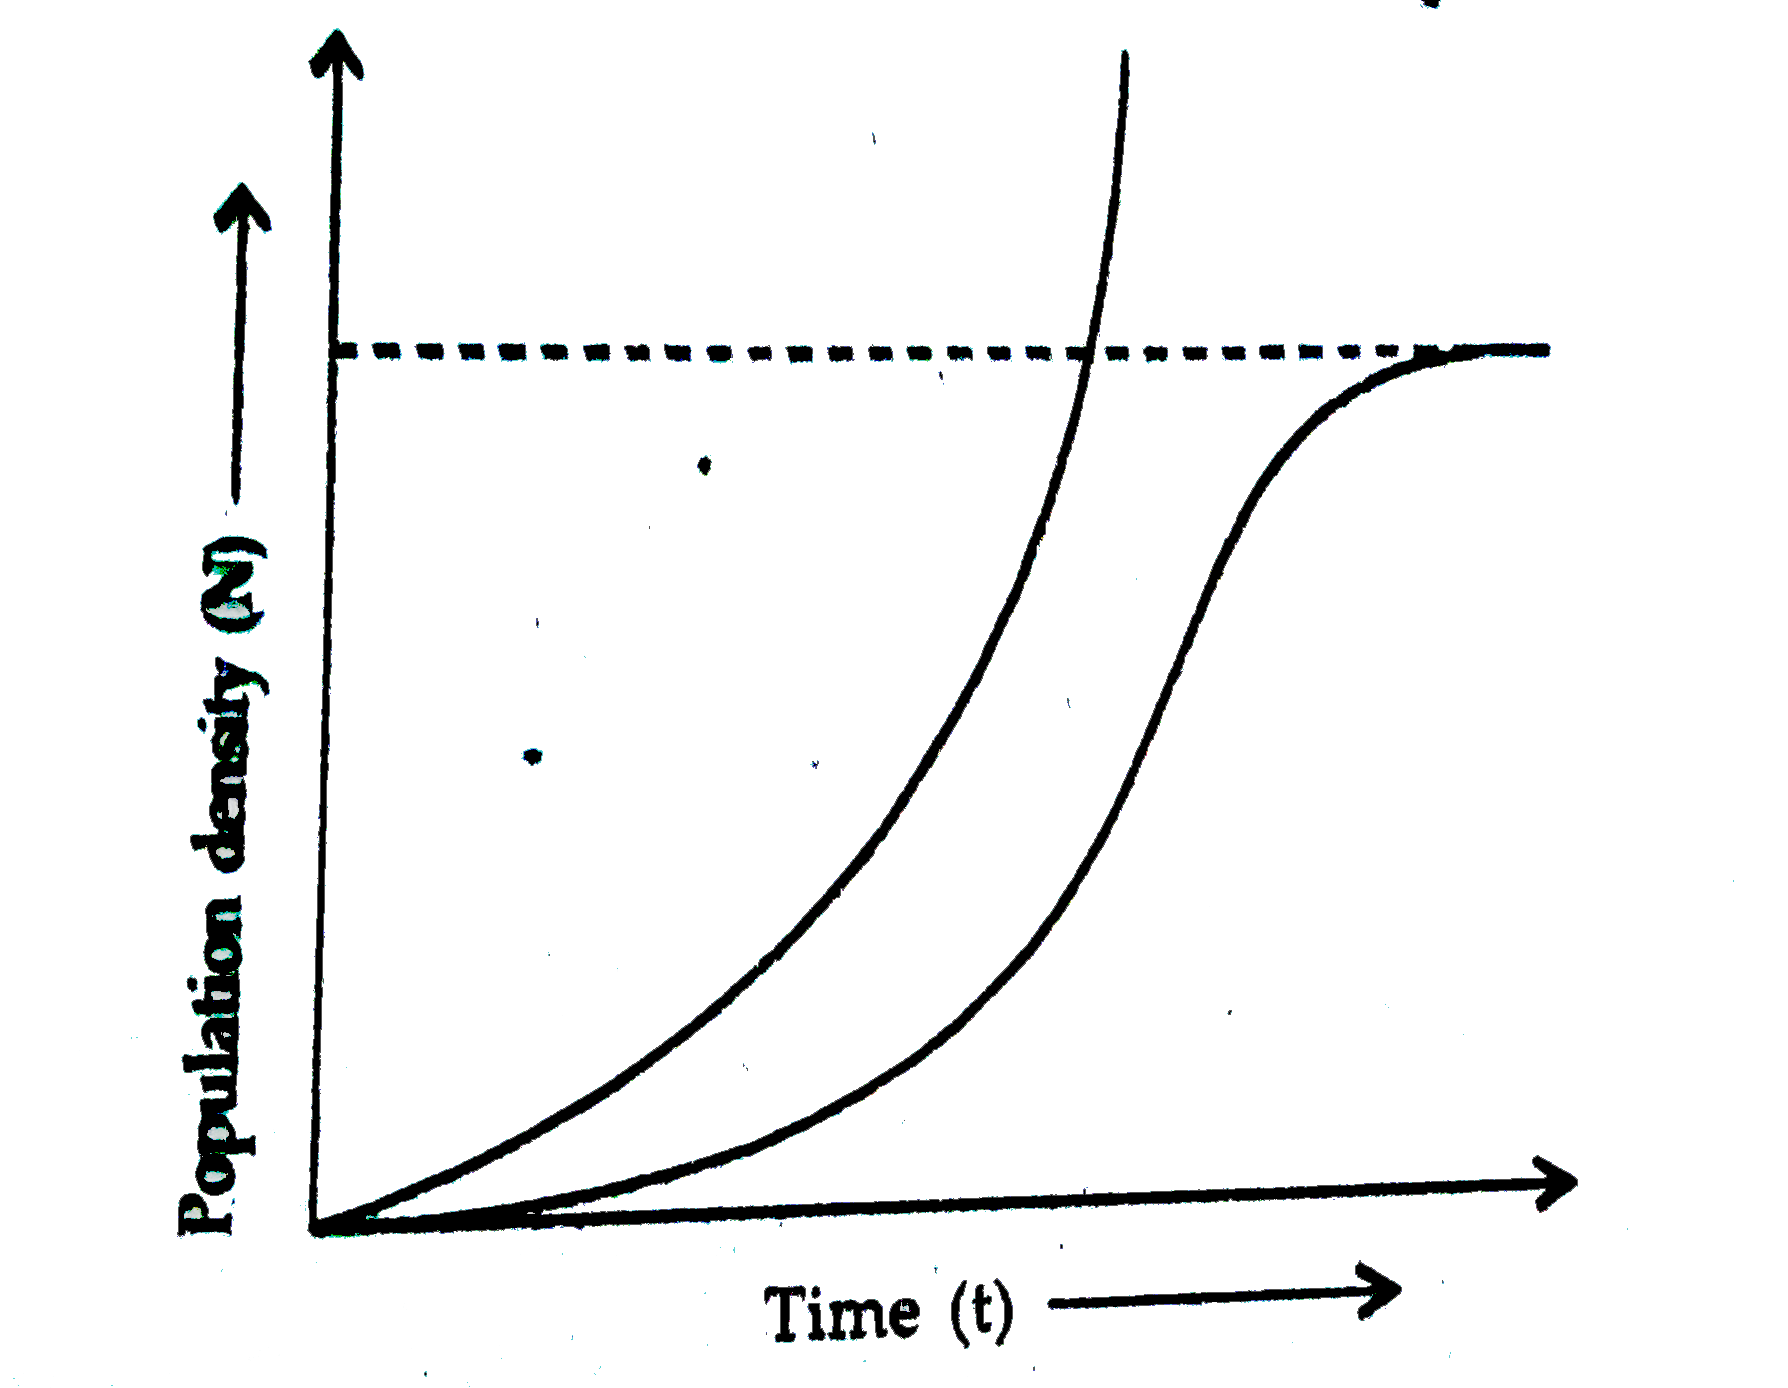
i) Write the status of food and space in the curves a) and b).
ii) In the absence of predators, which one of the two curves would appropriately depict the prey population?
iii) Time has been shown on X-axis and there is a parallel dotted line above it. Give the significance of this dotted line.
i)There is ample food and space for the population depicted by curve (a). When the resources are unlimited, the curves is exponential. There are limiting food and space for the population depicted by curve b). When the resources are limiting, are the curve becomes sigmoid.
ii) In the absence of predators, curve (a) would appropriately depict the prey population.
iii) The dotted line represents the carrying capacity of the environment. The carrying capacity represents the size of population that the environment can hold by providing necessary resources. when a population reaches this line its population size is stabilised by various environmental factors.
Topper's Solved these Questions
- BOOK - XII BOARDS PREVIOUS YEARCHAPTER - XII BOARDSEXERCISE - Section D18videos
XII BOARDS
- BOOK - XII BOARDS PREVIOUS YEARCHAPTER - XII BOARDSEXERCISE - SET -I Section -A8videos
XII BOARDS
- BOOK - XII BOARDS PREVIOUS YEARCHAPTER - XII BOARDSEXERCISE - Section B50videos
XII BOARDS
- BOOK - XII BOARDS PREVIOUS YEARCHAPTER - SAMPLE PAPER 2019EXERCISE - Section E Part B3videos
SAMPLE PAPER 2019
Similar Questions
Study the diagram given below and answer the questions that follow :
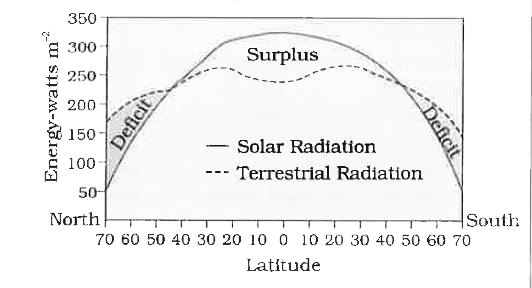
What does the diagram depict?View SolutionStudy the ray diagram given below and answer the following questions:
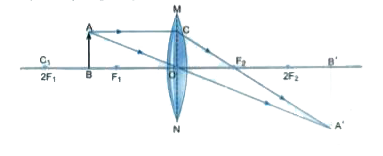
(i) State the type of lens used in the figure.
(ii) List two properties of the image formed .
(iii) In which position of the object will be magnification be -1 ?View Solution
Knowledge Check
- Question 1 - Select One
Study the following graph carefully and answer the questions that follow
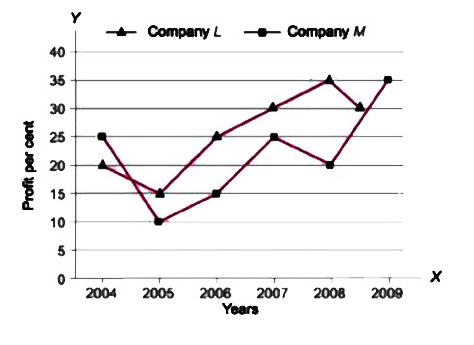
Which of the following statements is true with respect to the above graph ?ACompany M made the highest profit in the year 2009BCompany L made the least profit in the year 2005CThe ratio of the profits earned by company L and company M in the year 2006 was 6:5DCompany L made the highest profit in the year 2008 - Question 2 - Select One
Study the following graph and answer the questions given below -----
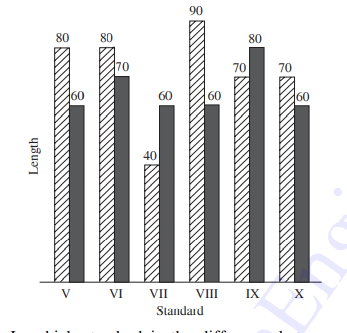
In which standard is the result of boys less than the average result of the girls ?AVIIBIXCVIDVIII - Question 3 - Select One
Study the following graph and answer the questions given below -----
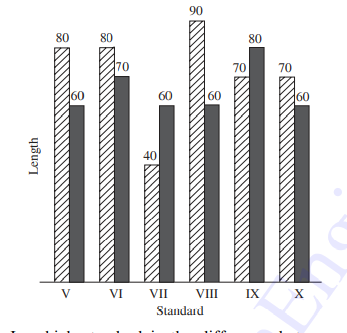
In which pair of standards are the results of girls and boys in inverse proportion ?AV and XBV and VICVI and VIIIDVI and IX
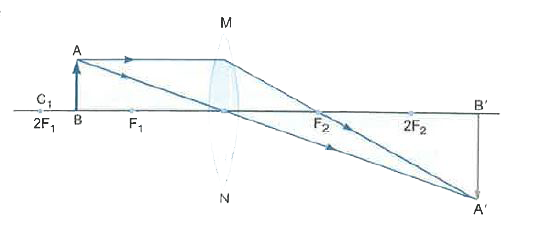
Study the ray diagram given below and answer the following questions:
(i) State the type of lens used in the figure.
(ii) List two properties of the image formed.
(iii) In which position of the object will the magnification be – 1 ?
 View Solution
Study the diagram given below and answer the questions that follow :
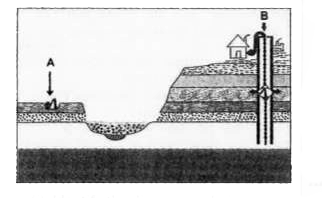
(i) Identify the diagram and give proper title to it.
(ii) What type of mining activities are presented by A and B?
(iii) What is the main differences between the two methods of mining as shown in A and B?View SolutionStudy the following graph and answer the questions given below -----
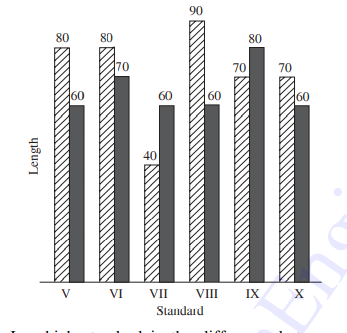
In which standard is the failure of girls lowest ?View SolutionStudy the following graph carefully and answer the questions that
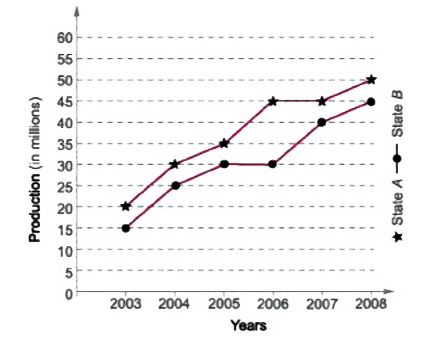
What was the ratio of the total population of State A to that of State B , for all the years together ?View SolutionStudy the following graph carefully and answer the questions that
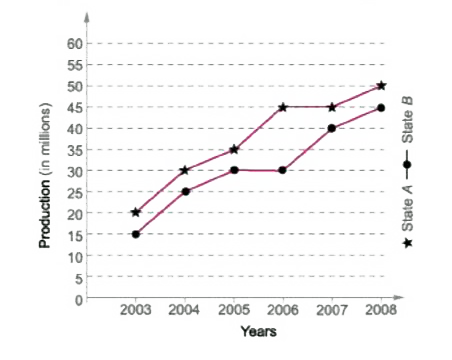
What was the average population of State B ( in millions ) for the years together ?View Solution

