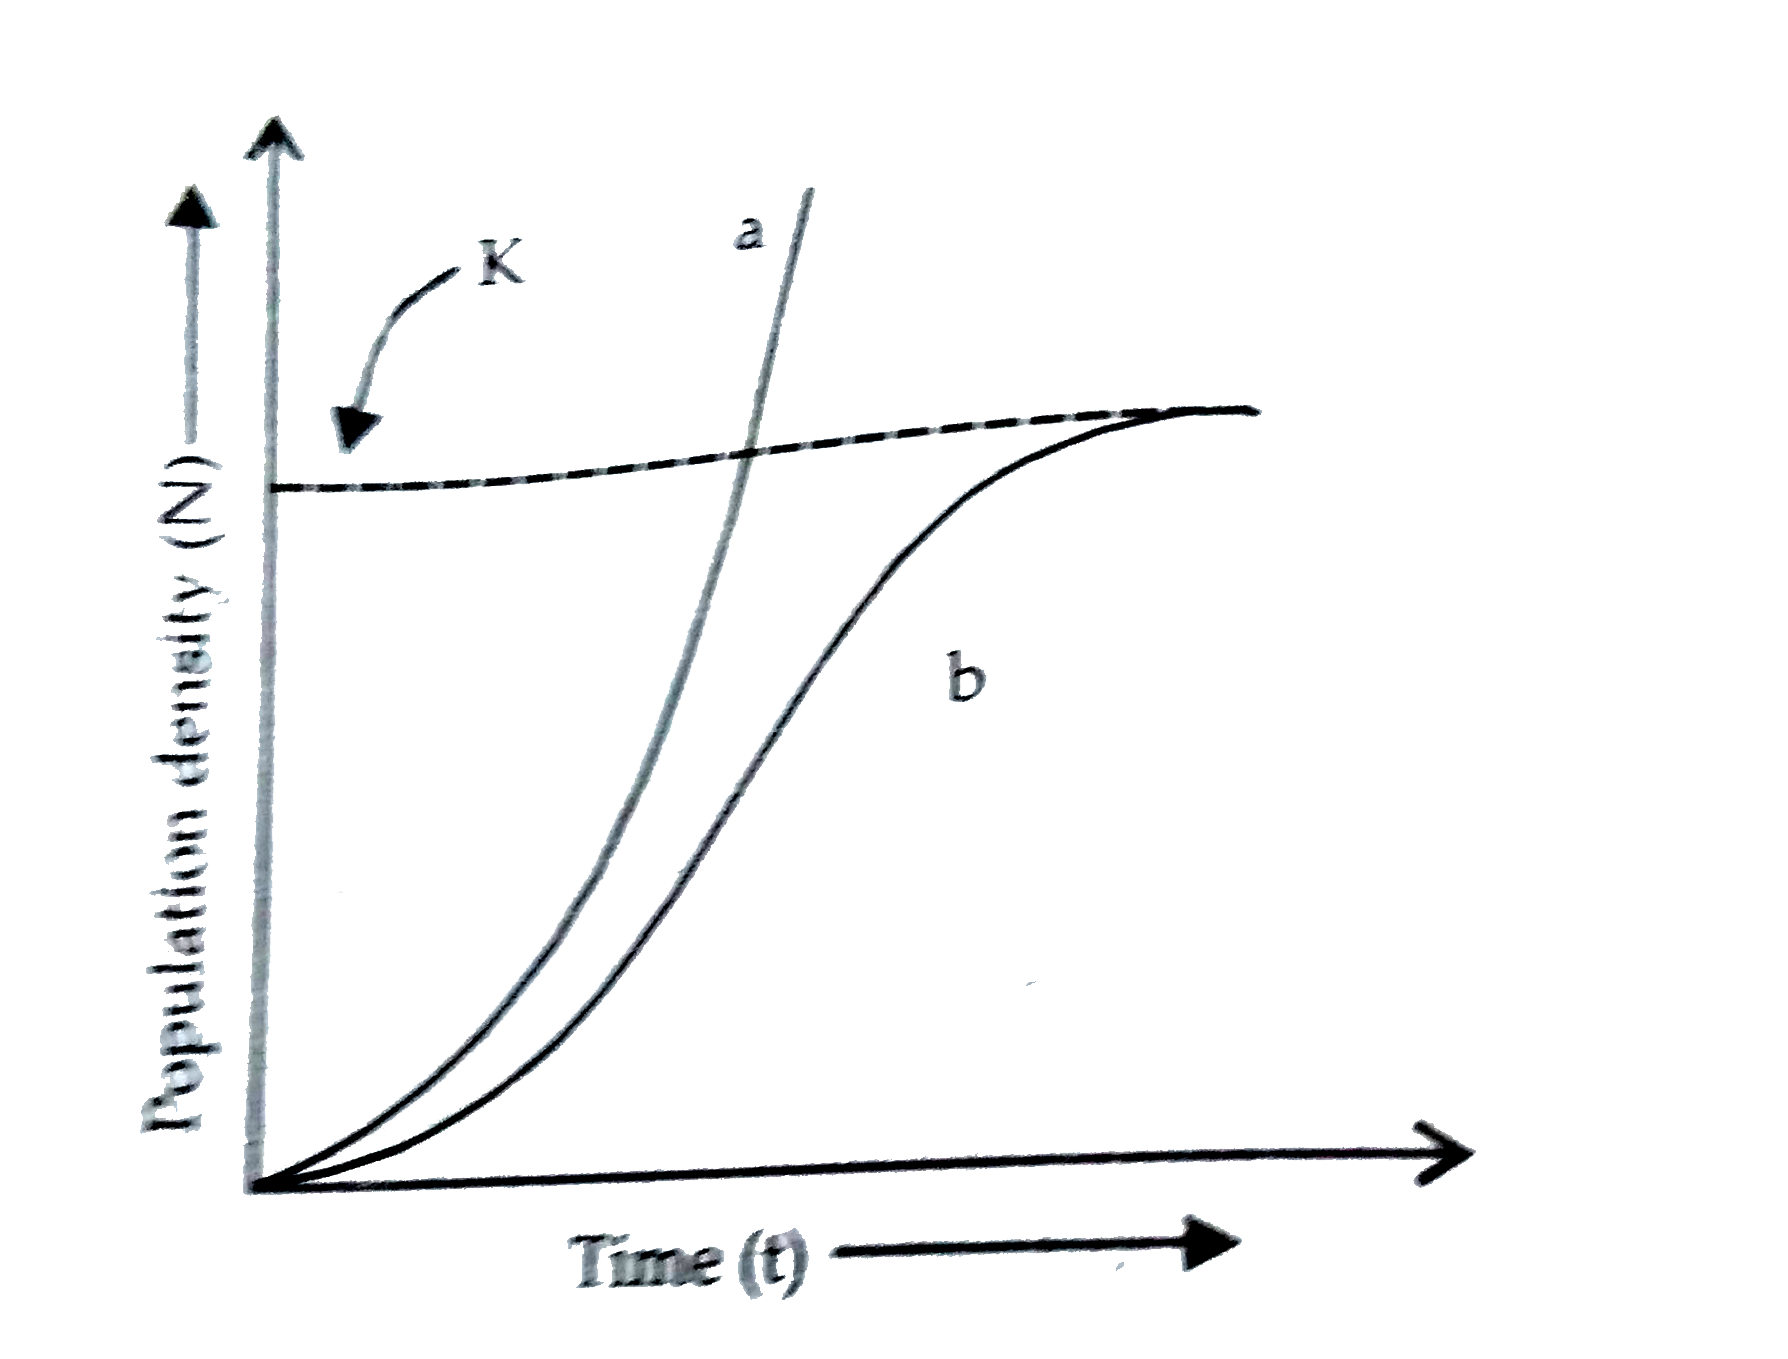
Study the population growth curves in the graph given below and answer the questions which follow :
(i) Identify the growth curves ‘a’ and ‘b’.

(ii) Which one. of them is considered a more realistic one and why ?
If dN9dt)=rN(K−NK) is the equation of the logistic growth curve, what does K stand for ?
(iv) What is symbolised by N ?
Video Solution
Text Solution
(a) = dN/dt = rN
⇒ Population exponential growth curve.
When resources are not limiting the growth, plot is exponential.
(b)=dN/dt=rN(K−NK)⇒ Logistic Growth Curve.
When resources are limiting the growth, plot is logistic.
(ii) Verhulst-Pearl Logistic Growth is more realistic for most animal population because the resources for growth are finite and become limiting sooner or later.
(iii) K is the earring capacity.
(iv) N is population density at time t.
|
Similar Questions
Knowledge Check
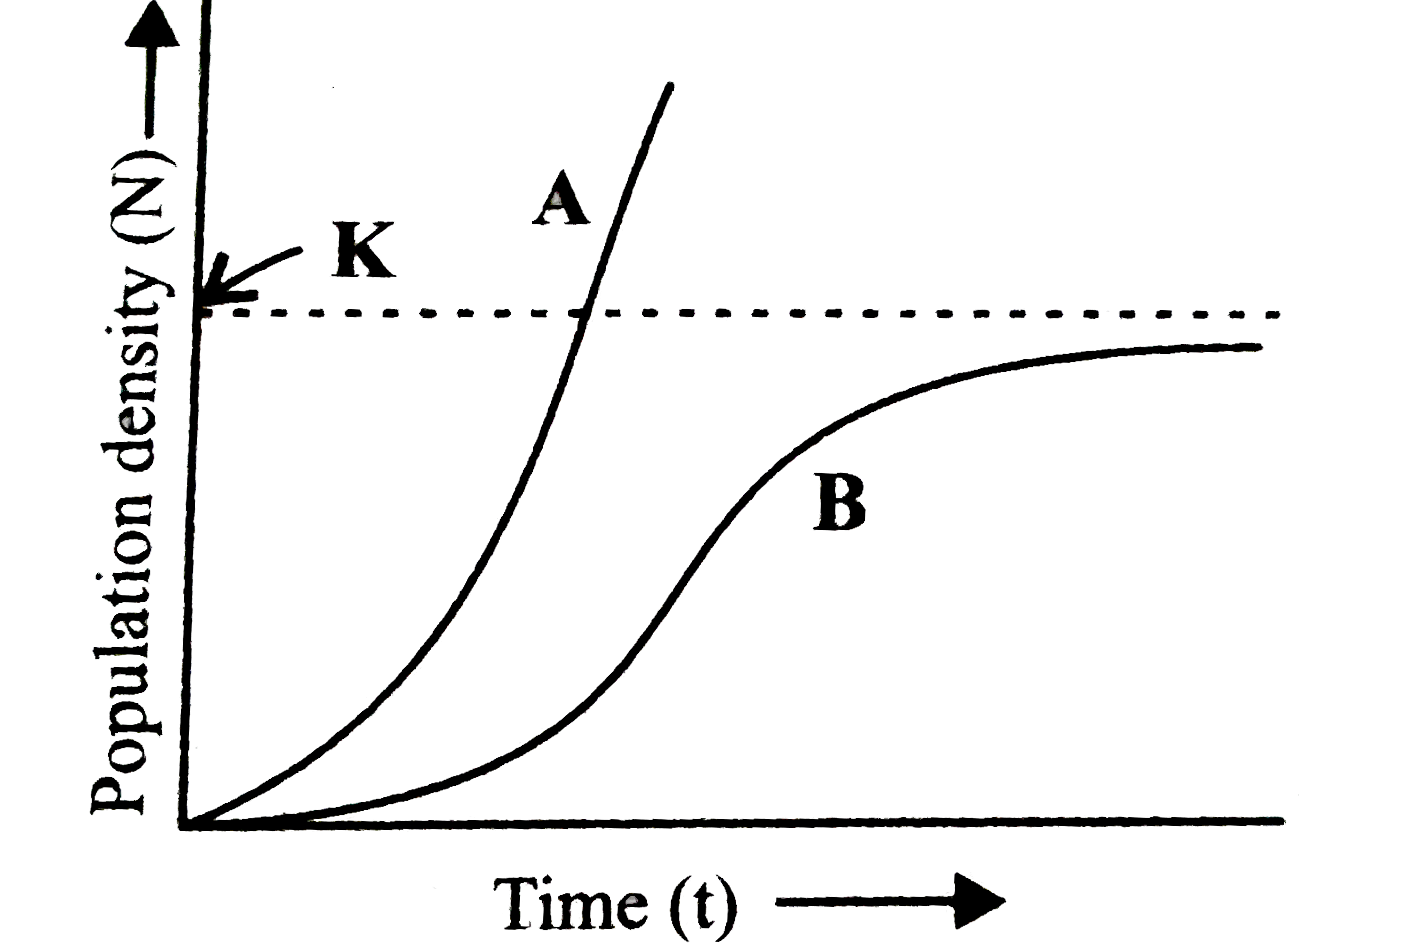
Study the population growth curves (A and B) in the given graph and select the incorrect option.
 ACurve 'A' shows exponential growth, represented by equation dNdt=rN.BCurve 'B' shows logistic growth, represented by equation dNdt=rN(K−NK)CExponential growth curve is considered as more realistic than the logistic growth curve.DCurve 'A' can also be represented by equation Nt=N0ert.
Which of the following is considered as more realistic growth model ?
View SolutionWhat is a logistic growth ?
View SolutionAsymptote in a logistic growth curve is obtained, when
View SolutionPopulation growth curve in most animals , except humans, is
View SolutionWhat is a zero population growth rate?
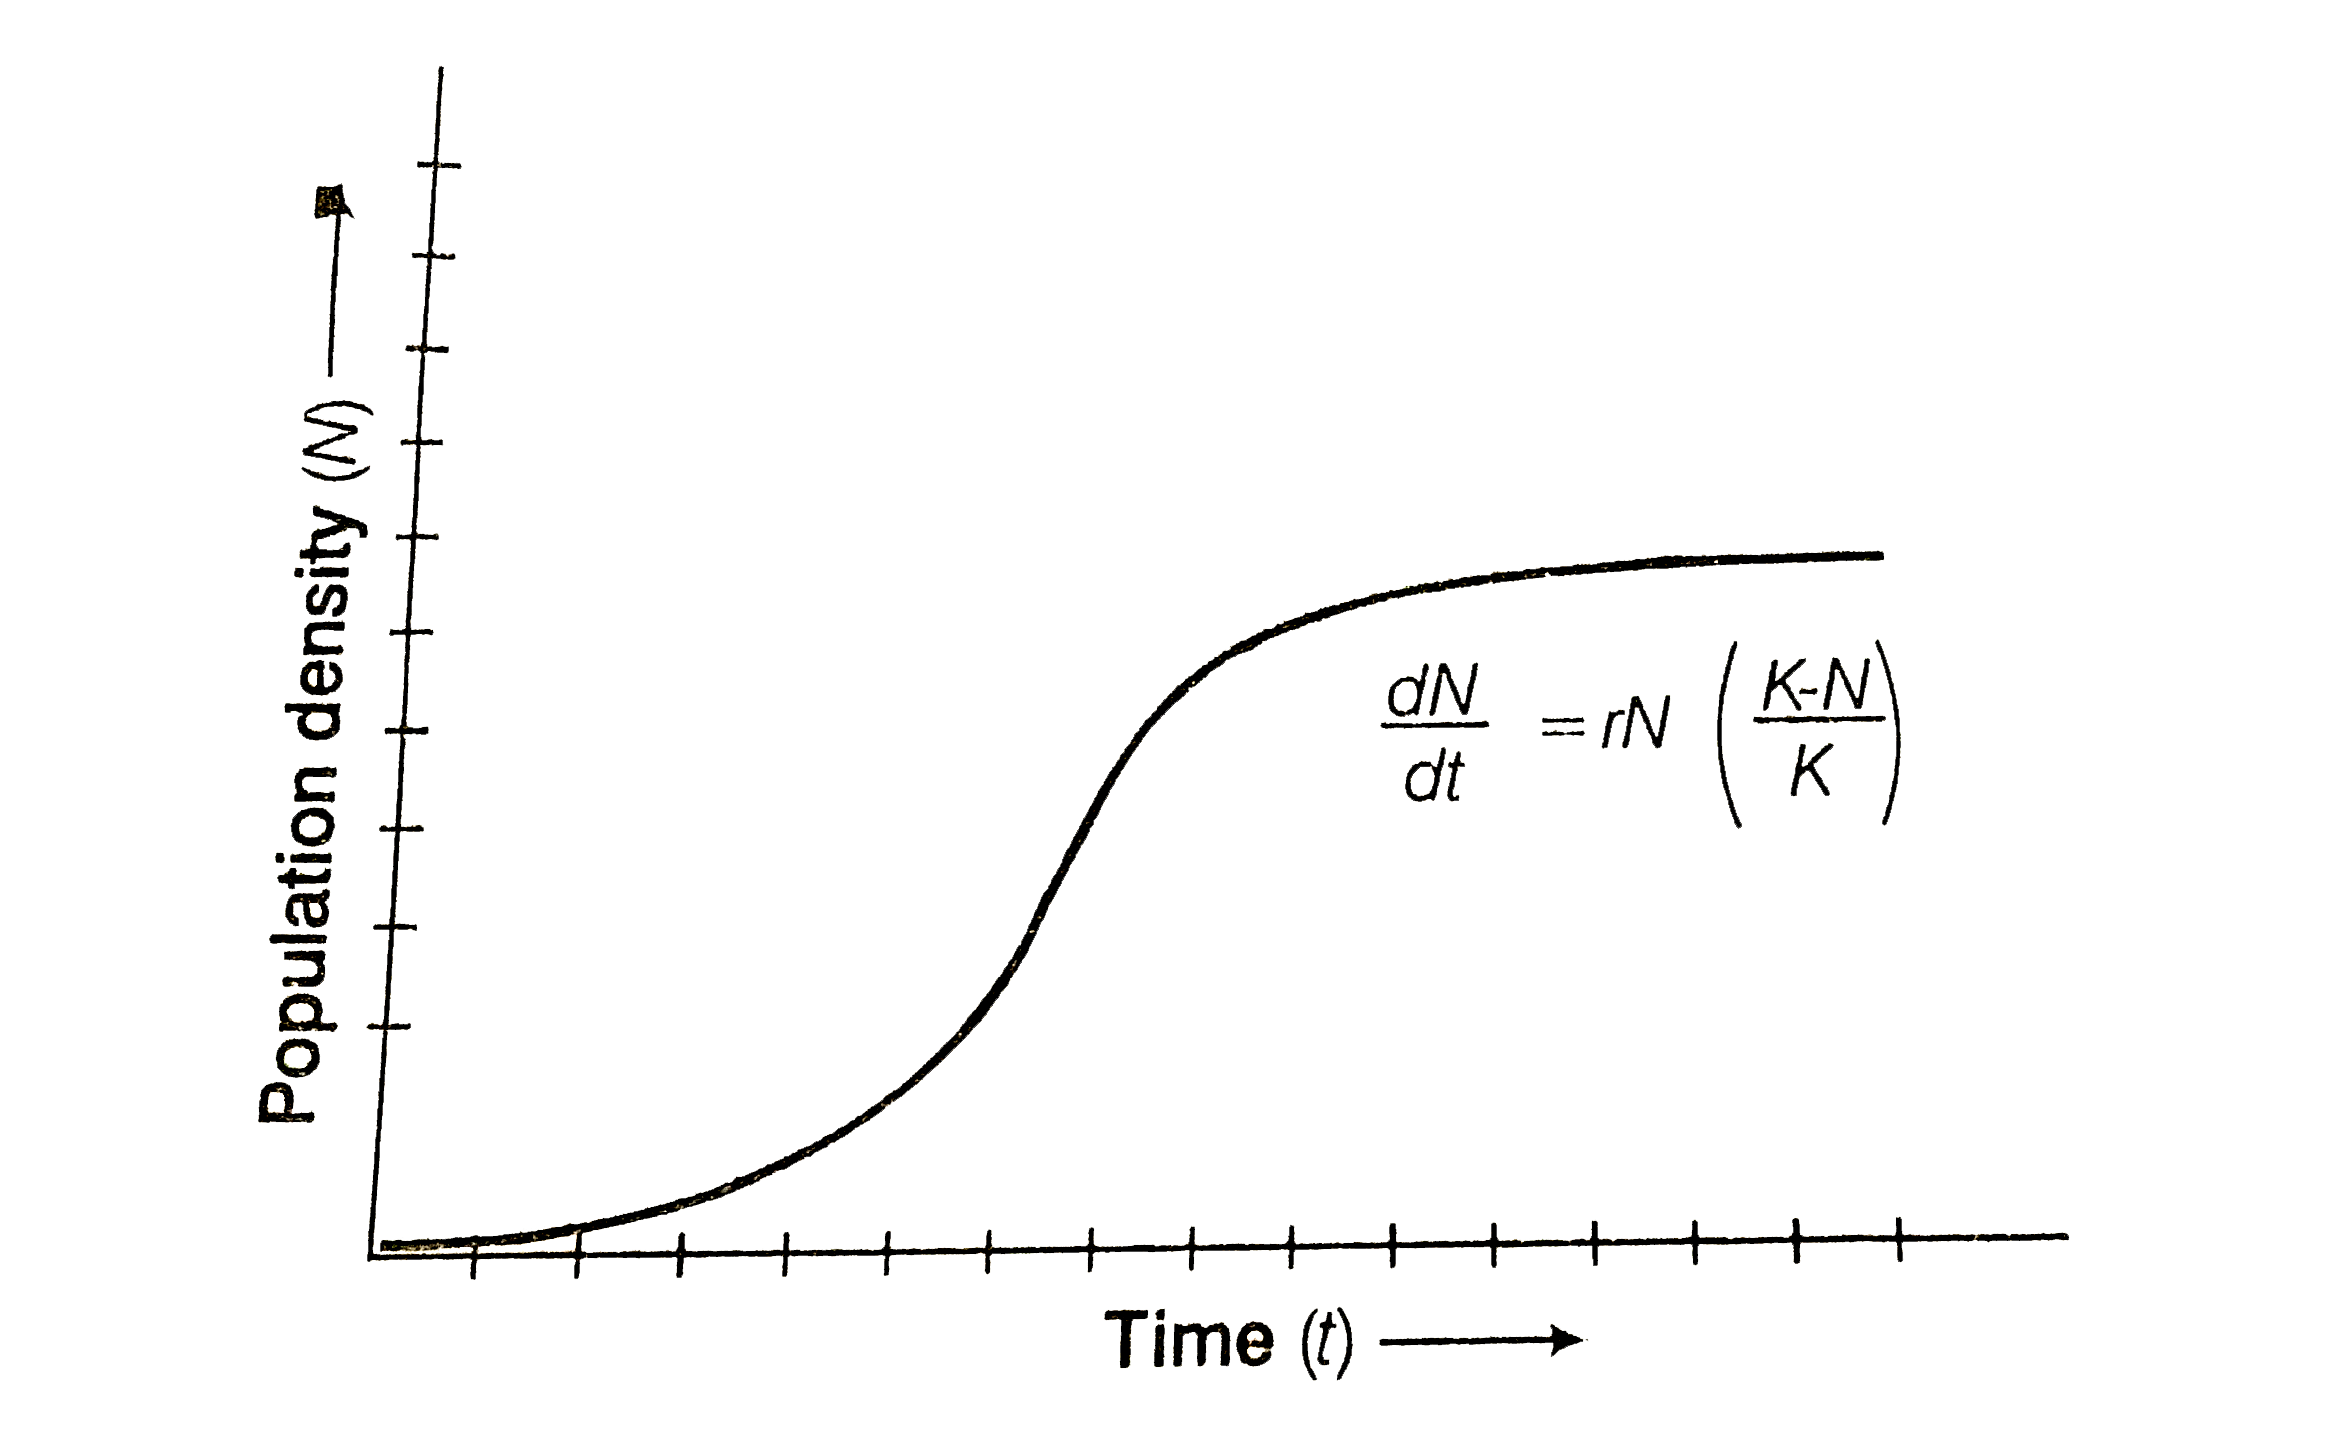
View SolutionComment on the growth curve given below.

View SolutionExplain the sigmoid plant growth curve.
View Solution
