The curve showing the amount of light absorbed at each wavelength is:
Action spectrum
Absorption spectrum
Quantum yield
Quantum requirement
To solve the question regarding the curve that shows the amount of light absorbed at each wavelength, we can follow these steps:
1. Understand the Context: The question is asking about a specific type of graph related to light absorption in photosynthetic organisms, particularly in the chloroplasts of plant cells.
2. Identify the Key Components: In chloroplasts, there are photosynthetic pigments that absorb light. These pigments are crucial for the process of photosynthesis.
3. Define the Terms:
- Action Spectrum: This represents the effectiveness of different wavelengths of light in driving photosynthesis.
- Absorption Spectrum: This graph shows the amount of light absorbed by pigments at each wavelength.
- Quantum Yield: This refers to the efficiency of a photochemical reaction.
- Quantum Requirement: This indicates the number of photons required for a specific reaction.
4. Focus on the Question: The question specifically asks for the curve that shows the amount of light absorbed at each wavelength.
5. Analyze the Options:
- Since the absorption spectrum directly relates to the amount of light absorbed by pigments at various wavelengths, this is the correct choice.
6. Conclusion: The curve showing the amount of light absorbed at each wavelength is known as the absorption spectrum.
Final Answer:
The correct option is B) Absorption Spectrum.
---
- Action Spectrum: This represents the effectiveness of different wavelengths of light in driving photosynthesis.
- Absorption Spectrum: This graph shows the amount of light absorbed by pigments at each wavelength.
- Quantum Yield: This refers to the efficiency of a photochemical reaction.
- Quantum Requirement: This indicates the number of photons required for a specific reaction.
- Since the absorption spectrum directly relates to the amount of light absorbed by pigments at various wavelengths, this is the correct choice.
The correct option is B) Absorption Spectrum.
Topper's Solved these Questions
- BIOLOGY-2016BOOK - ICSECHAPTER - BIOLOGY-2016EXERCISE - PART-II ( SECTION-A)
9 Videos
- BIOLOGY-2016BOOK - ICSECHAPTER - BIOLOGY-2016EXERCISE - PART-II ( SECTION-B)
9 Videos
- BIOLOGY -2017BOOK - ICSECHAPTER - BIOLOGY -2017EXERCISE - PART-II ( SECTION-C)
11 Videos
- BIOTECHNOLOGY : PRINCIPLES AND PROCESSESBOOK - ICSECHAPTER - BIOTECHNOLOGY : PRINCIPLES AND PROCESSESEXERCISE - COMPETITION CORNER (ASSERTION AND REASON TYPE QUESTIONS)
7 Videos
Similar Questions
The amount of heat absorbed when a substance melts ………
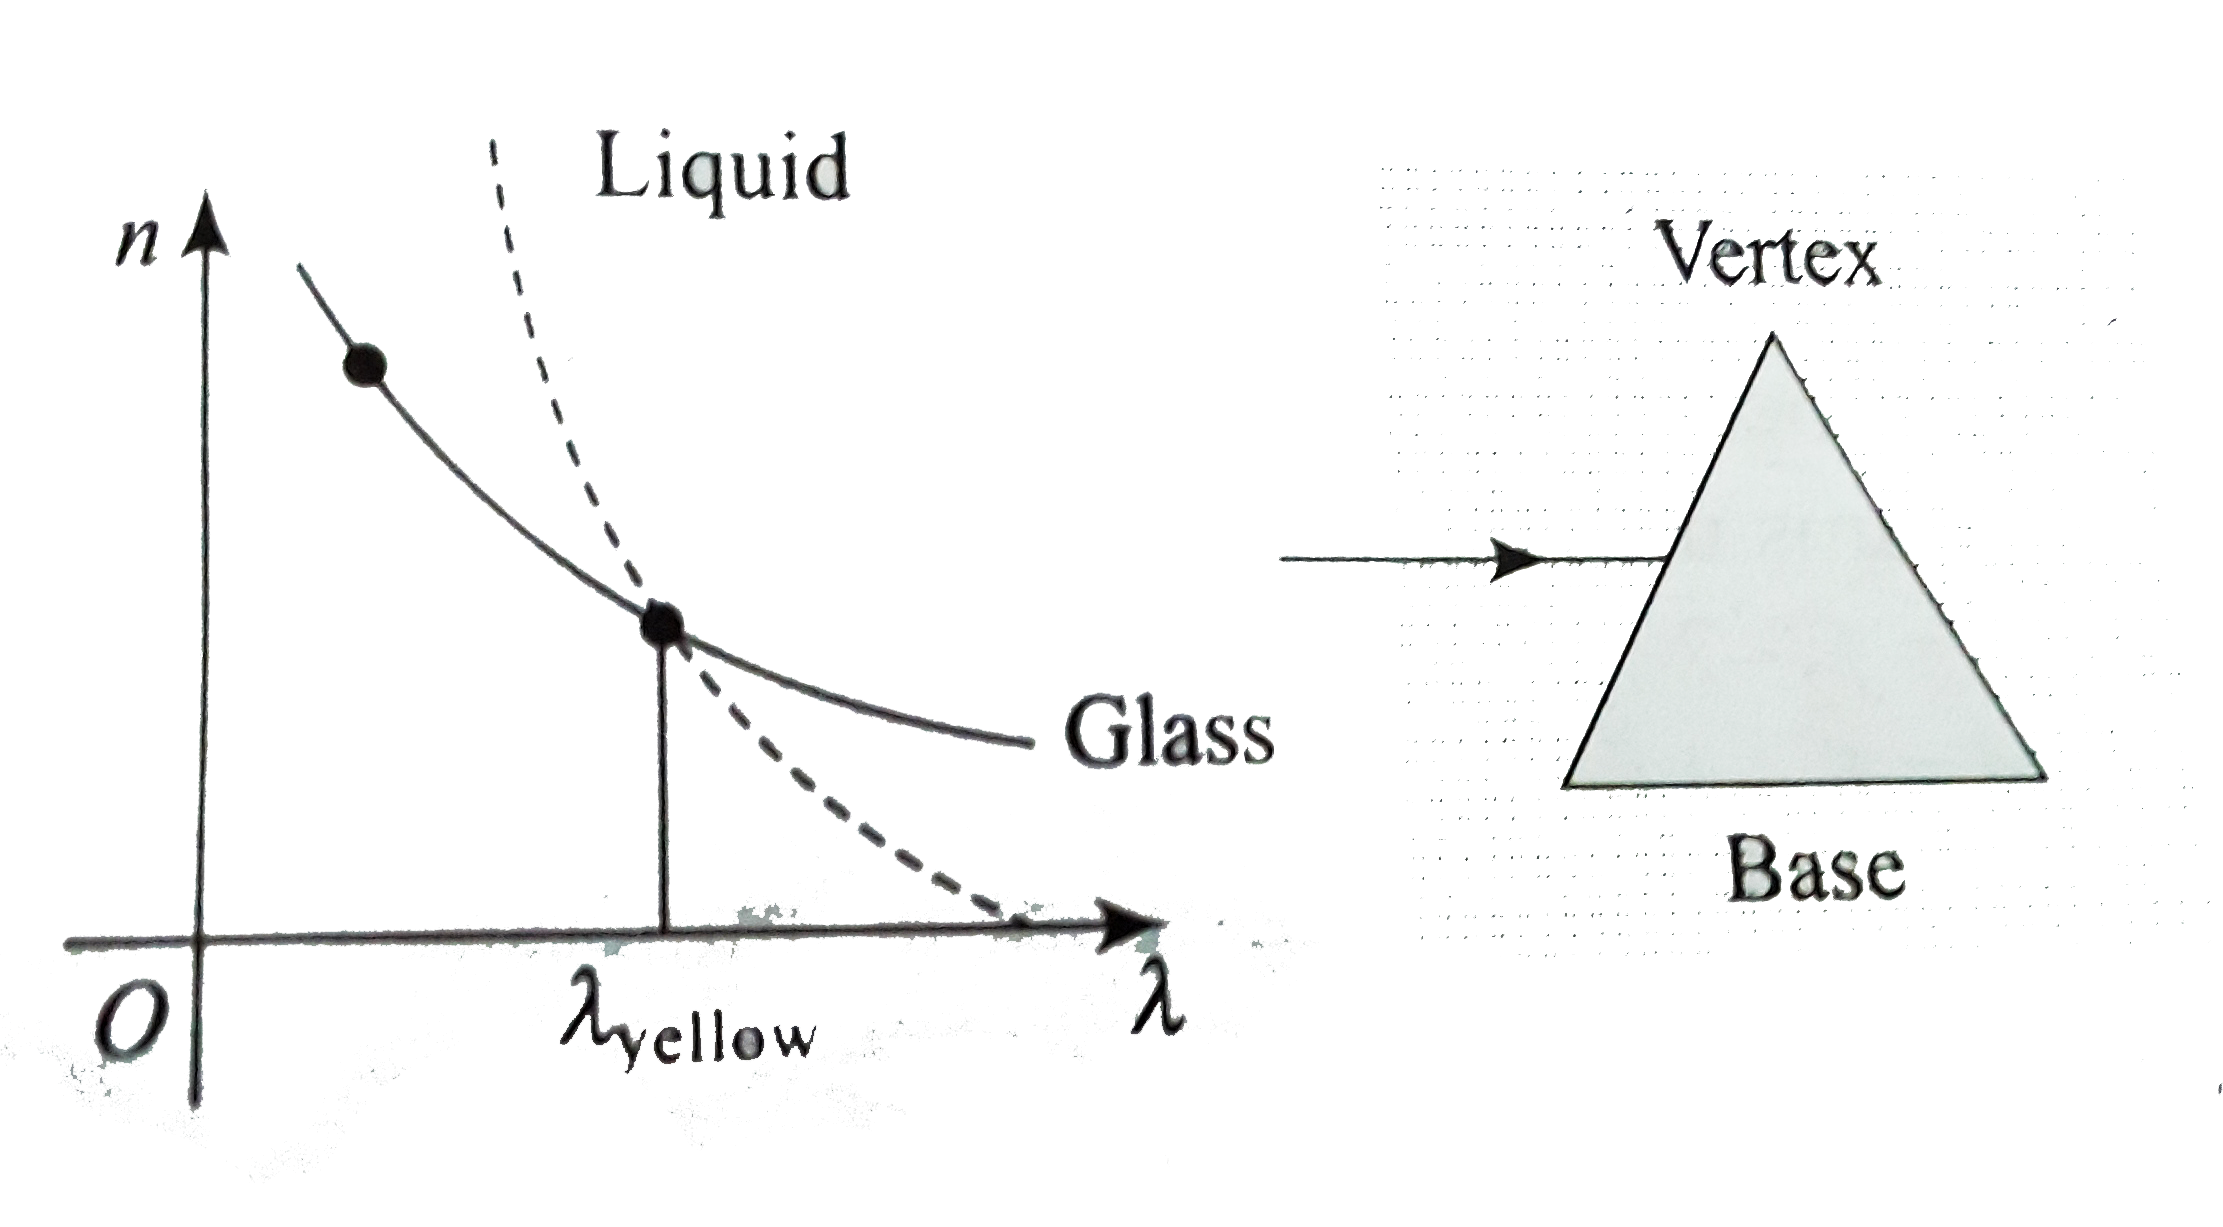
View SolutionA glass prism is immersed in a hypothetical liquid. The curves showing the refractive index n as a function of wavelength λ for glass and liquid are as shown in Figs. When a ray of white light is incident on the prism parallel to the base

View SolutionPhycobilins absorb light of wavelength
View SolutionThree complexes, [CoCl(NH3)5]2+(I),[Co(NH3)5H2O]3+(II)[Co(NH3)6]3−(III) absorb light in the visible region. The correct order of the wavelength of light absorbed by them is:
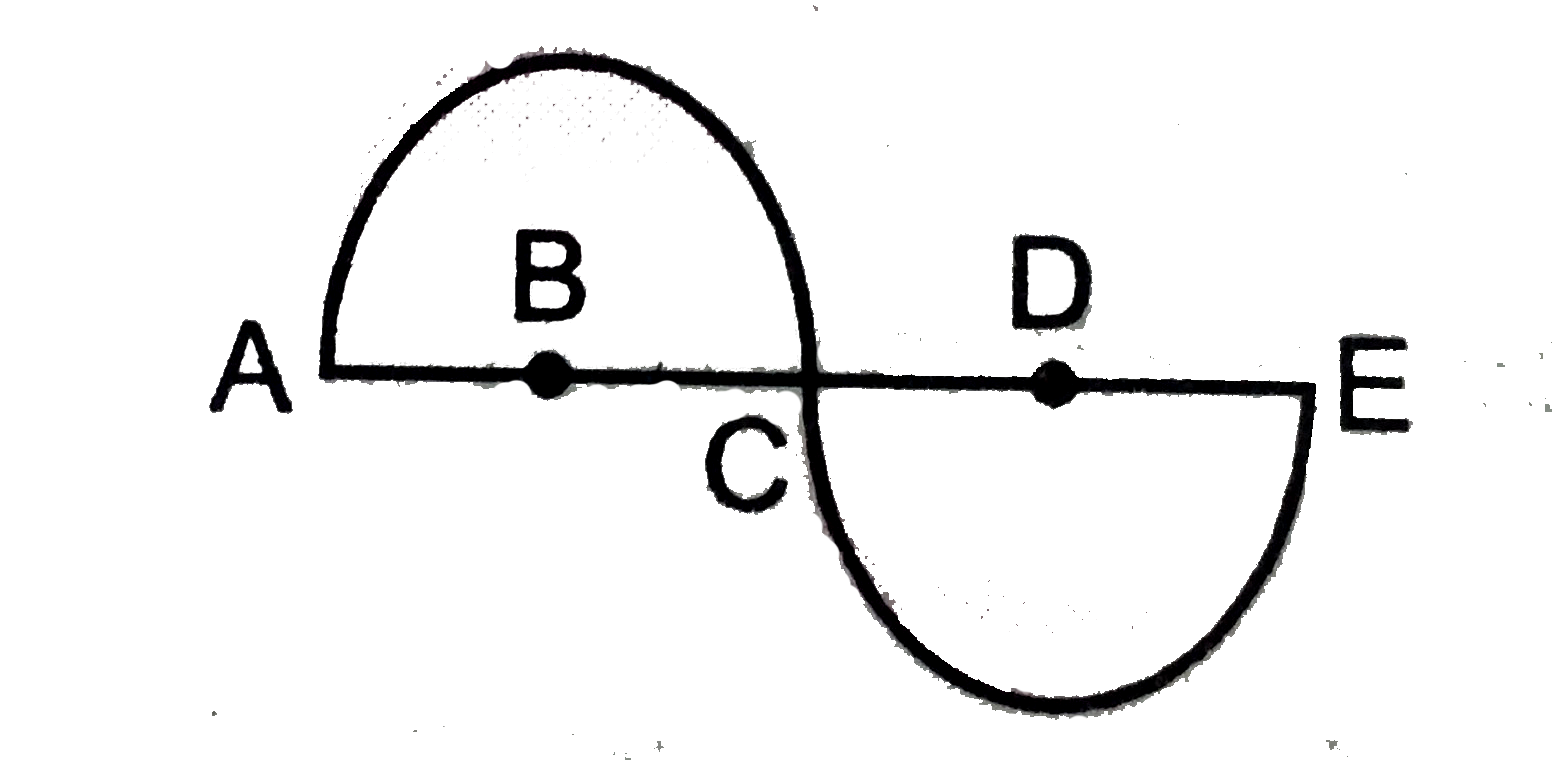
View SolutionIn the curve, half the wavelength is :
 .
.
View SolutionA : Most of the photosyntheis takes place in the blue and red region of spectum.
R : Action spectrum shows the amount of energy of different wavelength of light absorbed by pigments.
View SolutionThe wavelength of light absorbed by reaction centre of PS-II is
View SolutionWhen sunlight is scattered by atmospheric atoms and molecules the amount of scattering of light of wavelength 880 nm is A. Then the , the amount of scattering of light of wavelength 330 nm is approximately
View Solutionwhat is the relationsphip between observed colour of the complex and the wavelength of light absorbed by the complex ?
View SolutionPr state of phytochrome absorbs light wave-length of
View Solution
