The diagram given below shows three bean seeds placed at different levels.
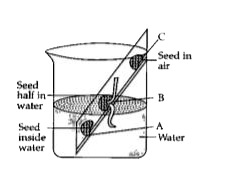
What changes will you observe in the seeds A, B and C after a few days? Explain with suitable reasons.
Step by step video & image solution for The diagram given below shows three bean seeds placed at different levels. What changes will you observe in the seeds A, B and C after a few days? Explain with suitable reasons. by Biology experts to help you in doubts & scoring excellent marks in Class 9 exams.
Updated on:21/07/2023Topper's Solved these Questions
- ICSE EXAMINATION PAPER, 2020 BOOK - ICSECHAPTER - ICSE EXAMINATION PAPER, 2020 EXERCISE - Section II
65 Videos
- HYGIENE-[A KEY TO HEALTHY LIFE]BOOK - ICSECHAPTER - HYGIENE-[A KEY TO HEALTHY LIFE]EXERCISE - PROGRESS CHECK
13 Videos
- INTRODUCING BIOLOGY [SCOPE AND BRANCHES]BOOK - ICSECHAPTER - INTRODUCING BIOLOGY [SCOPE AND BRANCHES]EXERCISE - REVIEW QUESTIONS (D. LONG ANSWER TYPE)
1 Video
Similar Questions
The diagram given below shows three bean seeds placed at different levels . Answer the following questions :

Mention the parts of a flower which from the fruit and seeds.
View SolutionThe diagram given below shows a few parts of a cell.
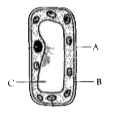
State the difference between the parts labelled A and B on the basis of permeability.
View Solution
Knowledge Check
The graph given below represents changes in different ecological parameters due to effluent mixing in a stream. The three lines A, B anc C represent
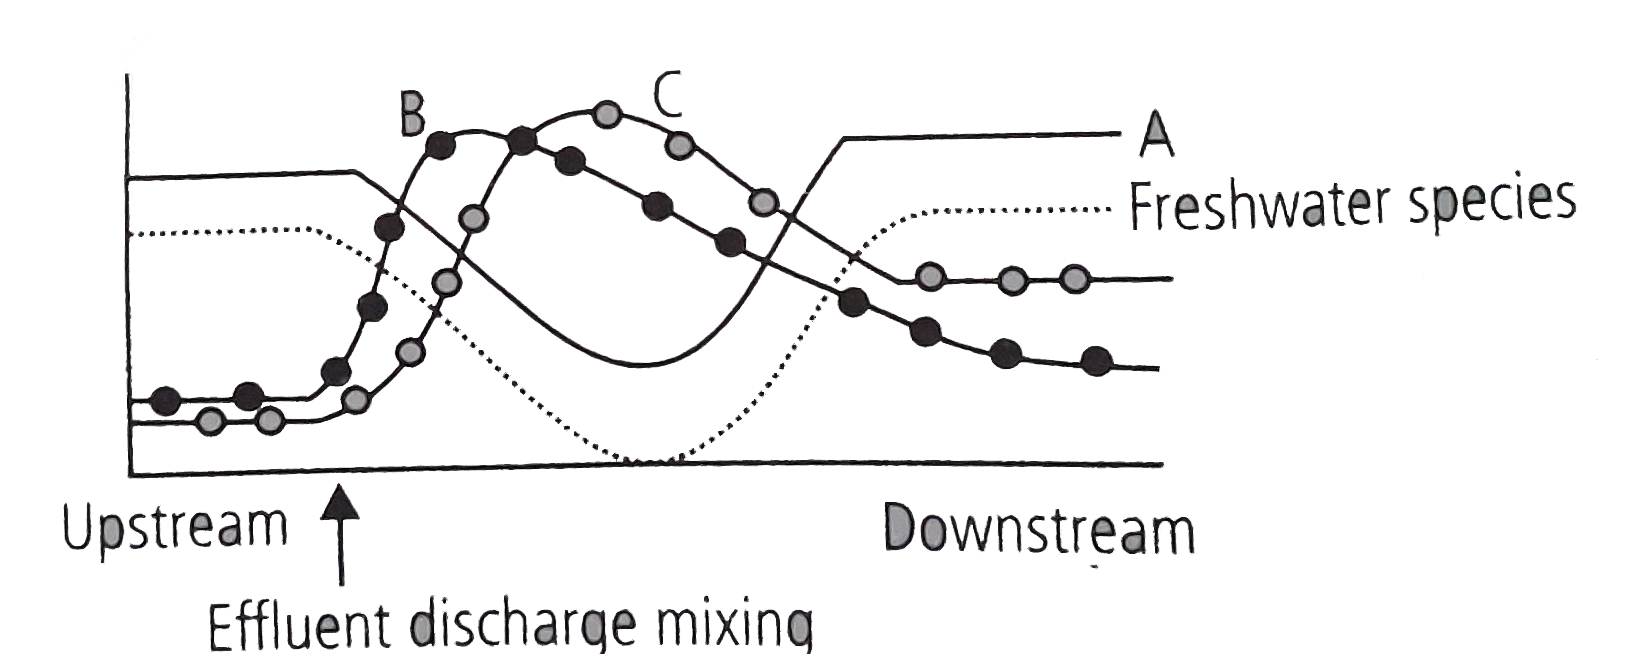 AA: oxygen concentration
B: biological O2 demand
C: pollution resistant speciesBA: pollutan
B: aerobic process
C: anaerobic processCA: oxygen concentration
B: CO2 concentration
C: termperatureDA: phosphate concentration
B: nitrate concentration
C: rate of photosynthesis.Observe the diagram given below and answer the questions:
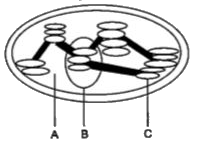
Label the parts marked A, B & CA1. Granum 2. Stroma 3. Fret 4. ThylakoidB1. Graniumi 2. Stroma 3. Fret 4. ThylakoidC1. Granum 2. Stroma 3. Fret 4. ThylakoidDnone of theseObserve the diagram given below and answer the questions:
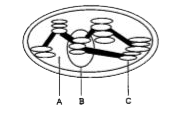
Label the parts marked A, B & CAA-Granum B-Stroma C-ThylakoidBA-Stroma B-Granum C-ThylakoidCA-Thylakoid B-Stroma C-GranumDnone of these
The diagram given below shows a few parts of a cell.
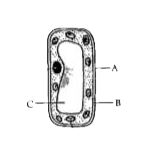
Is it a plant or animal cell? Give a reason to support your answer.
View SolutionThe figure given below shows three glass chambers that are connected by valves of negligible volume. At the outset of an experiment, the valves are closed and the chambers contain the gases as detailed in the diagram. All the chambers are at the temperature of 300K and external pressure of 1.0atm.
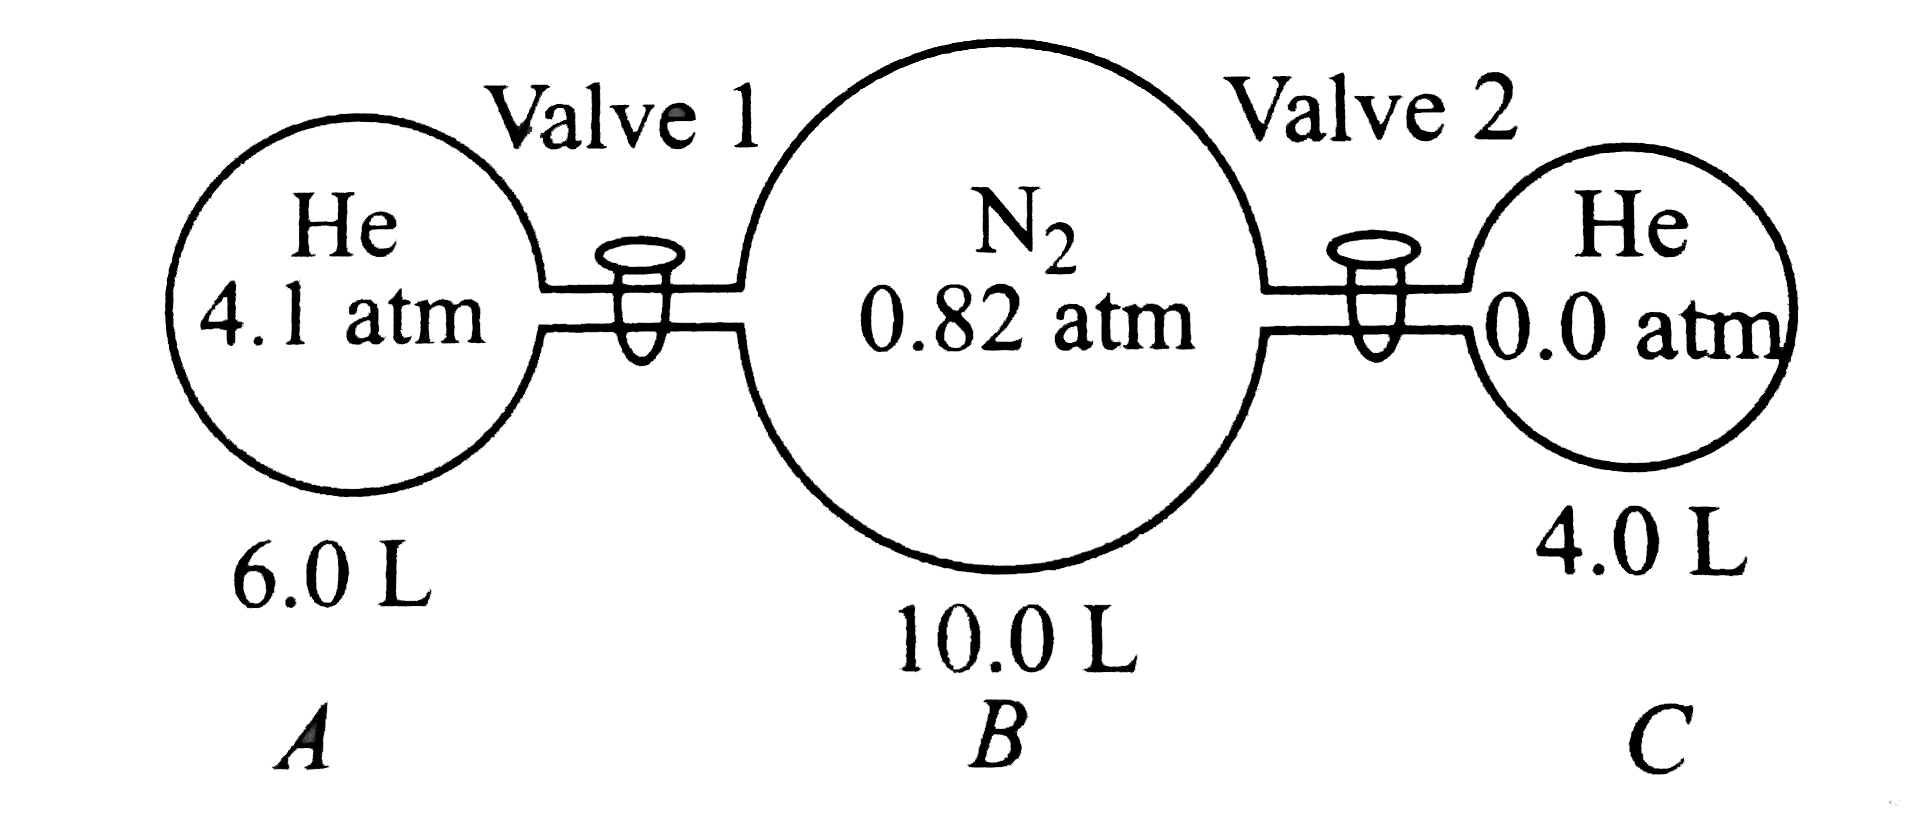
What is the total pressure in chamber B after valve 1 is opened?
View SolutionStudy the diagram given below and answer the questions that follow :
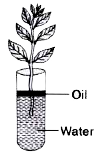
What do we observe with regard to the level of water when this set-up is placed in (1) bright sunlight (2) humid conditions (3) windy day
View SolutionStudy the set-up shown in the diagram and answer the following:
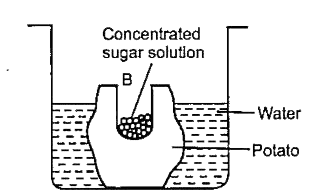
What change will you observe in part 'B' of the setup after one hour? Give reason for this change.
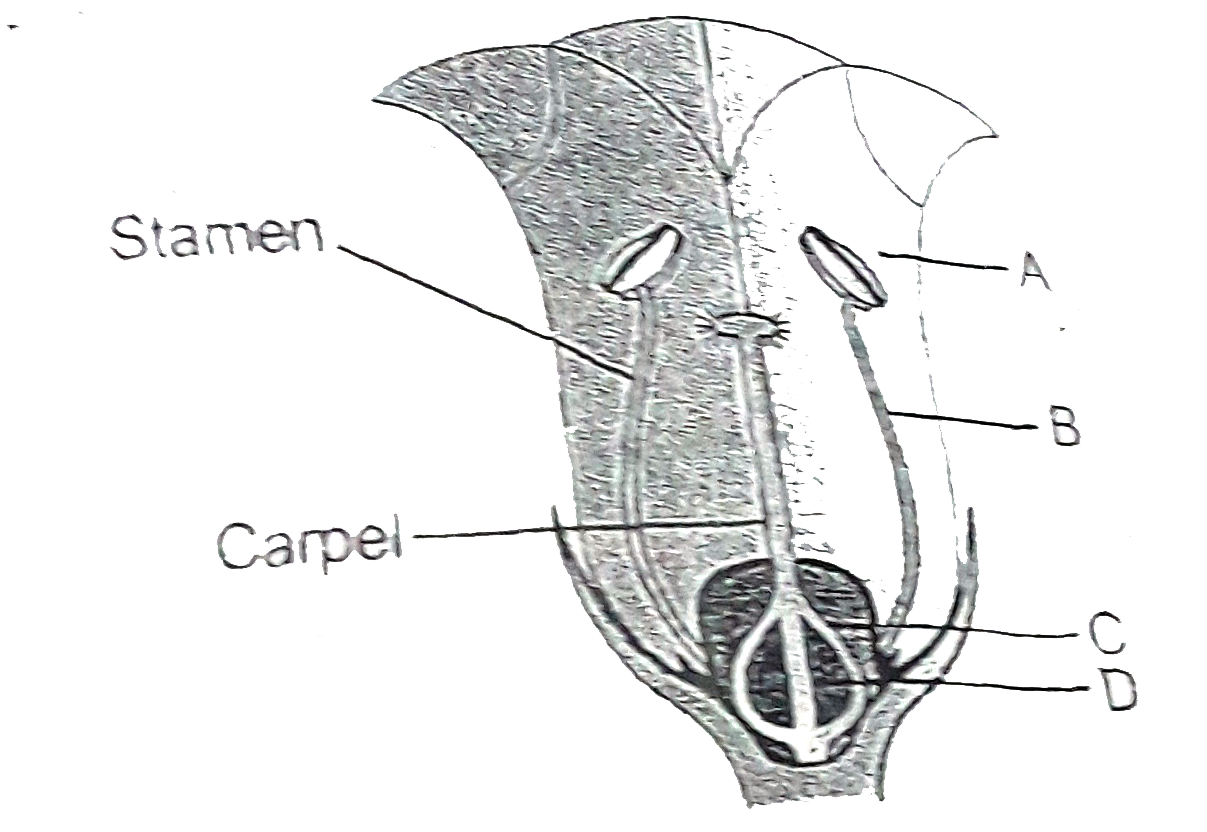
View SolutionIn the given below diagram what will be the fate of A,B,C, and D after fertillisation ?
View Solution