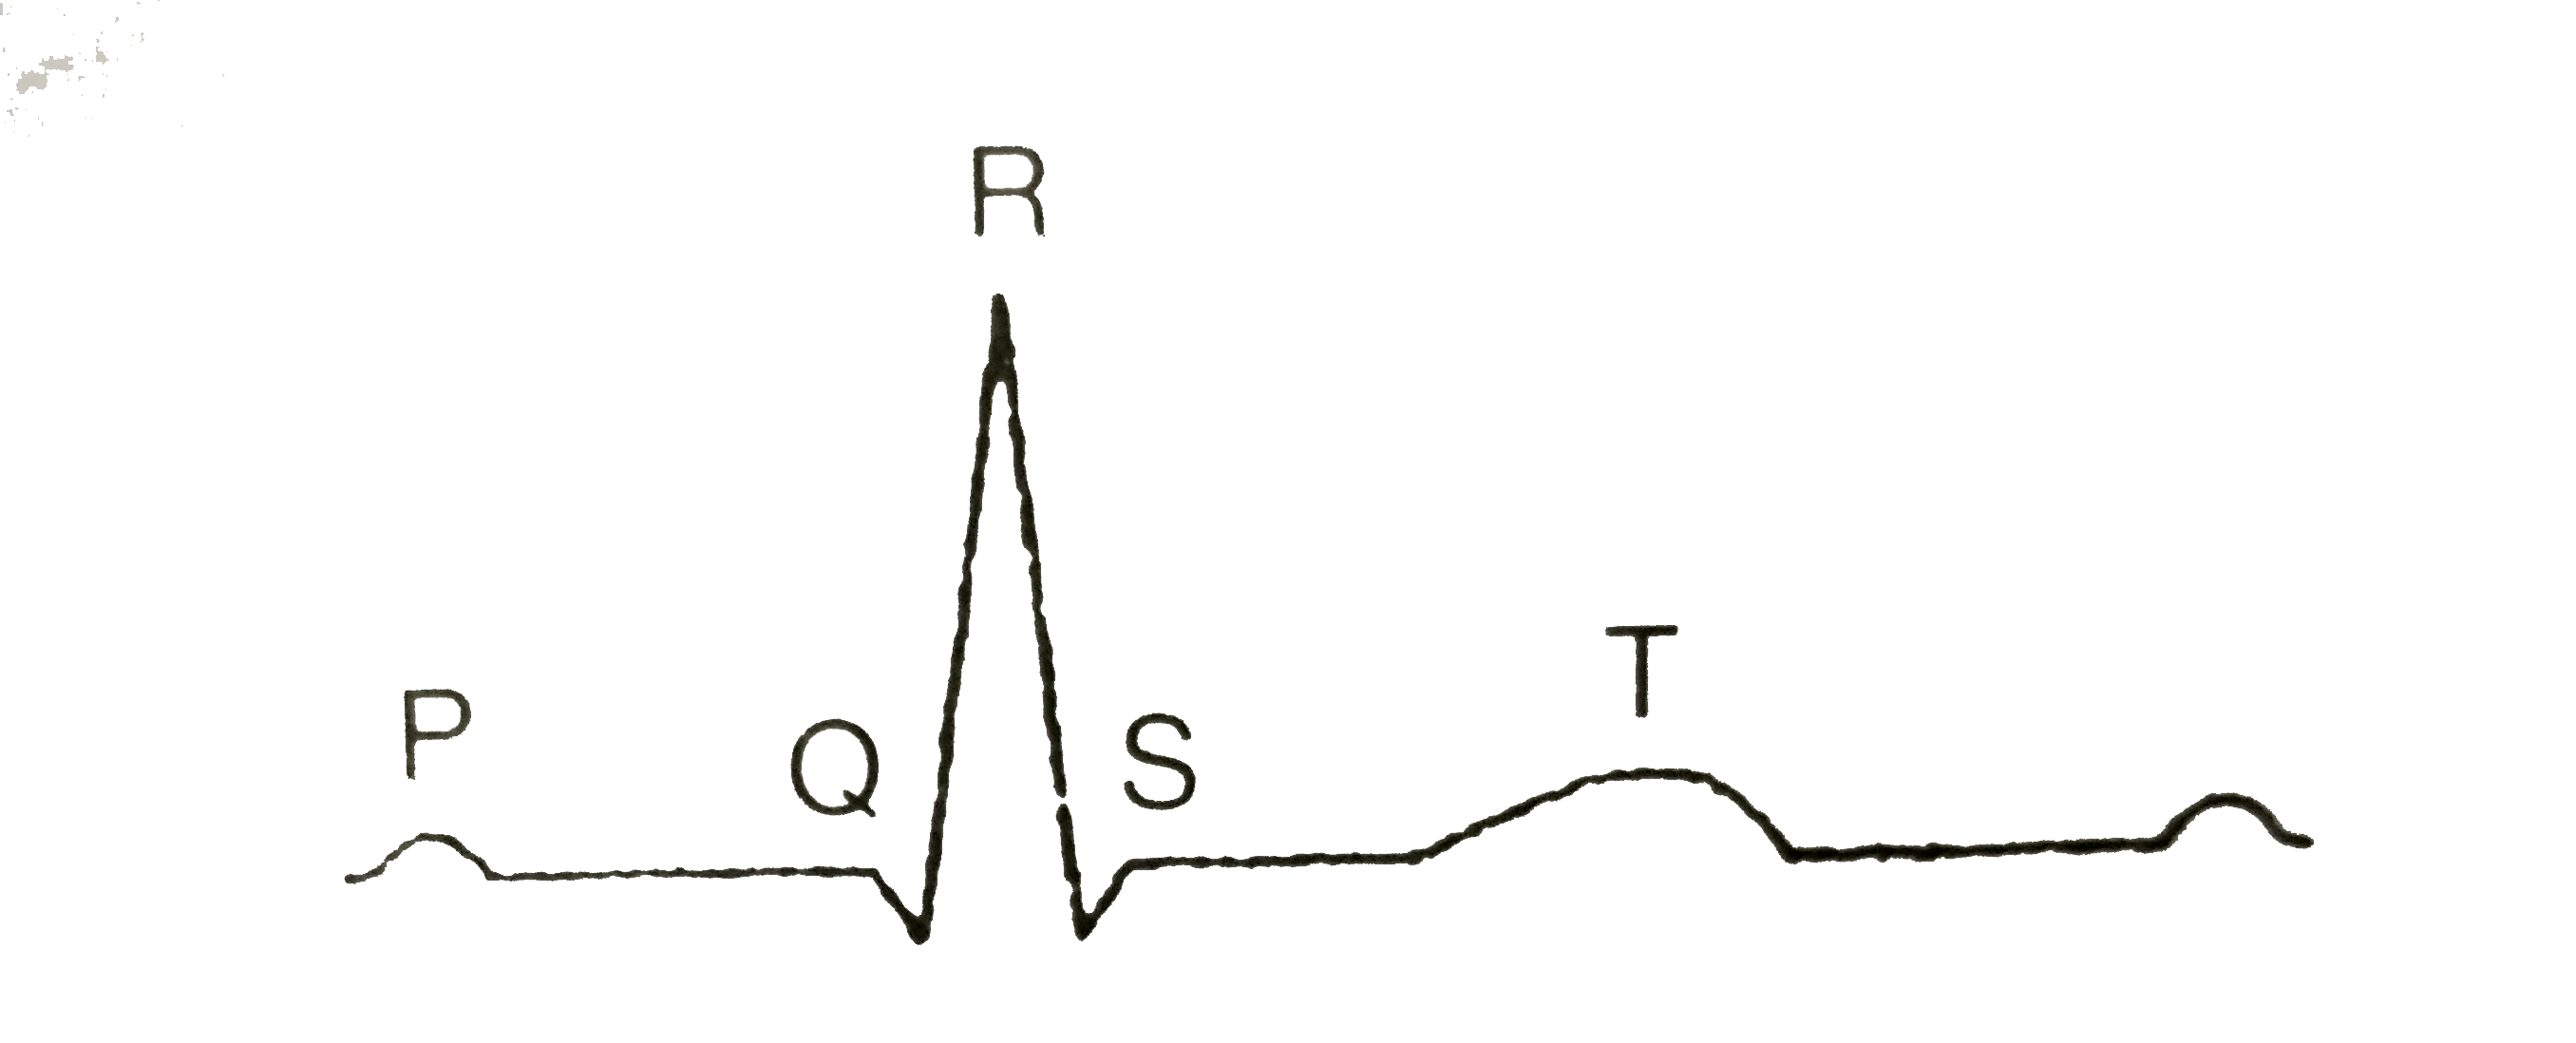
The diagram given here is the standard ECG of a normal person.The P-wave represents the
A
Beginning of the systole
B
End of systole
C
Contraction of both the atria
D
Both 1 & 3
Video Solution
Text Solution
The correct Answer is:D
Both the option (1) and (3) , are correct
P wave represents atrial depolarisation , i.e., atrial systole (contraction of atria). Cardiac cycle consists of first systole of heart followed by diastole. Cardiac systole consists of first atrial systole, followed by ventricular systole. Thus beginning of systole of heart is represented by atrial systole which is further respresented by the P wave.
|
Topper's Solved these Questions
- BIOTECHNOLOGY : PRINCIPLES AND PROCESSESBOOK - TRUEMEN BIOLOGY ENGLISHCHAPTER - BIOTECHNOLOGY : PRINCIPLES AND PROCESSESEXERCISE - MULTIPLE CHOICE QUESTIONS
124 Videos
- BREATHING AND EXCHANGE OF GASES BOOK - TRUEMEN BIOLOGY ENGLISHCHAPTER - BREATHING AND EXCHANGE OF GASES EXERCISE - MULTIPLE CHOICE QUESTIONS
199 Videos
Similar Questions
Knowledge Check
The diagram given here is the representation of
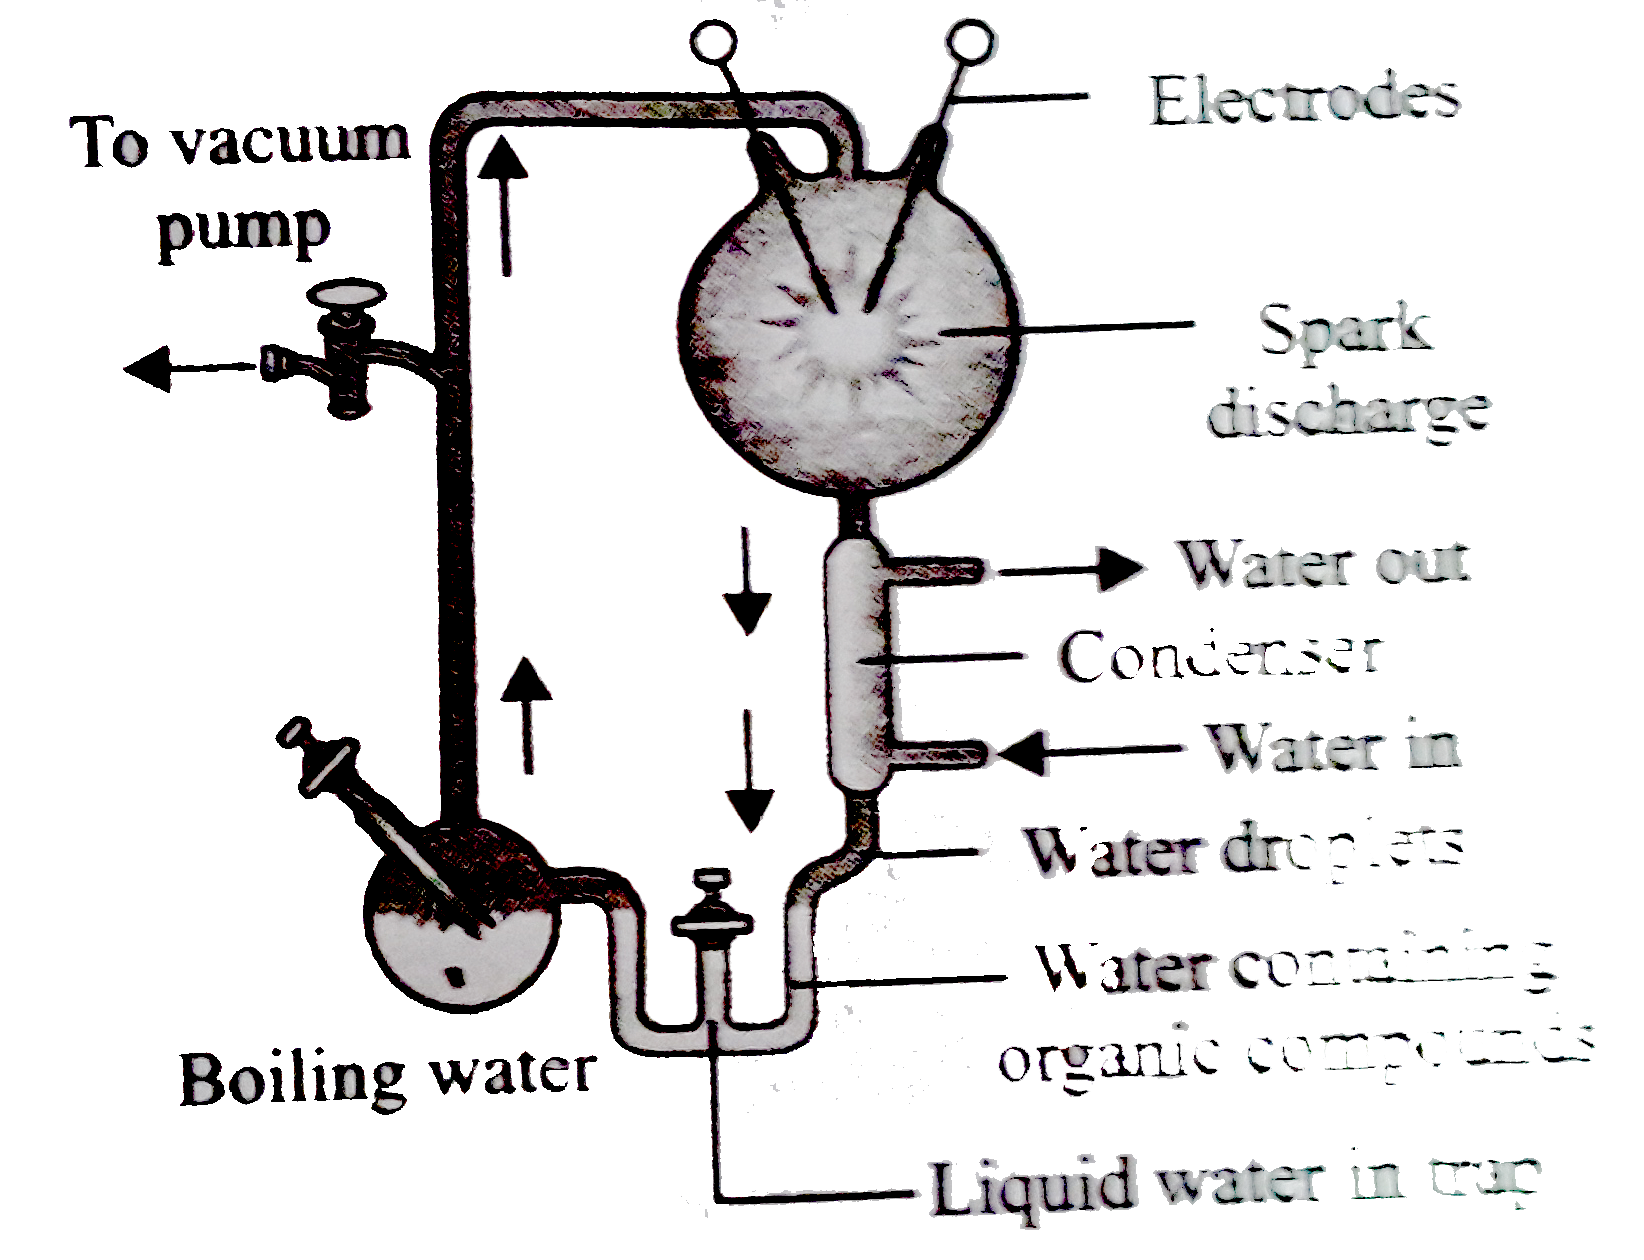 AMiller's experimentBRedi's experimentCLouis pasteur's experimentDSpallanzani's experiment
Study the diagram given below and answer the questions that follow:
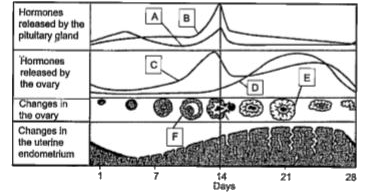
The alphabet 'A' represents ______ hormone.AOestrogenBProgesteroneCFSHDLH
The diagram given below represents
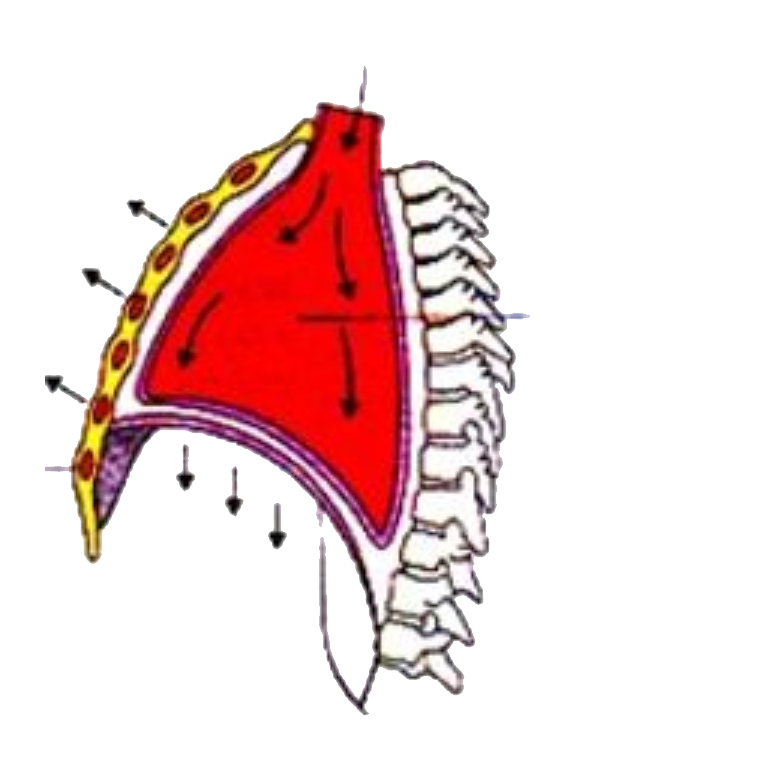
View SolutionThe given diagram represents
View SolutionIn ECG, what does T wave represent?
View Solution'T' wave in an ECG represents
View SolutionT wave in a standard ECG represents
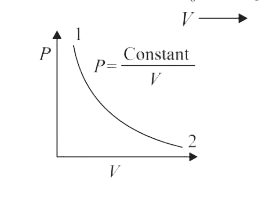
View SolutionFor the diagram given for an ideal gas, out of the following which one correctly represent the diagram?
View Solution

