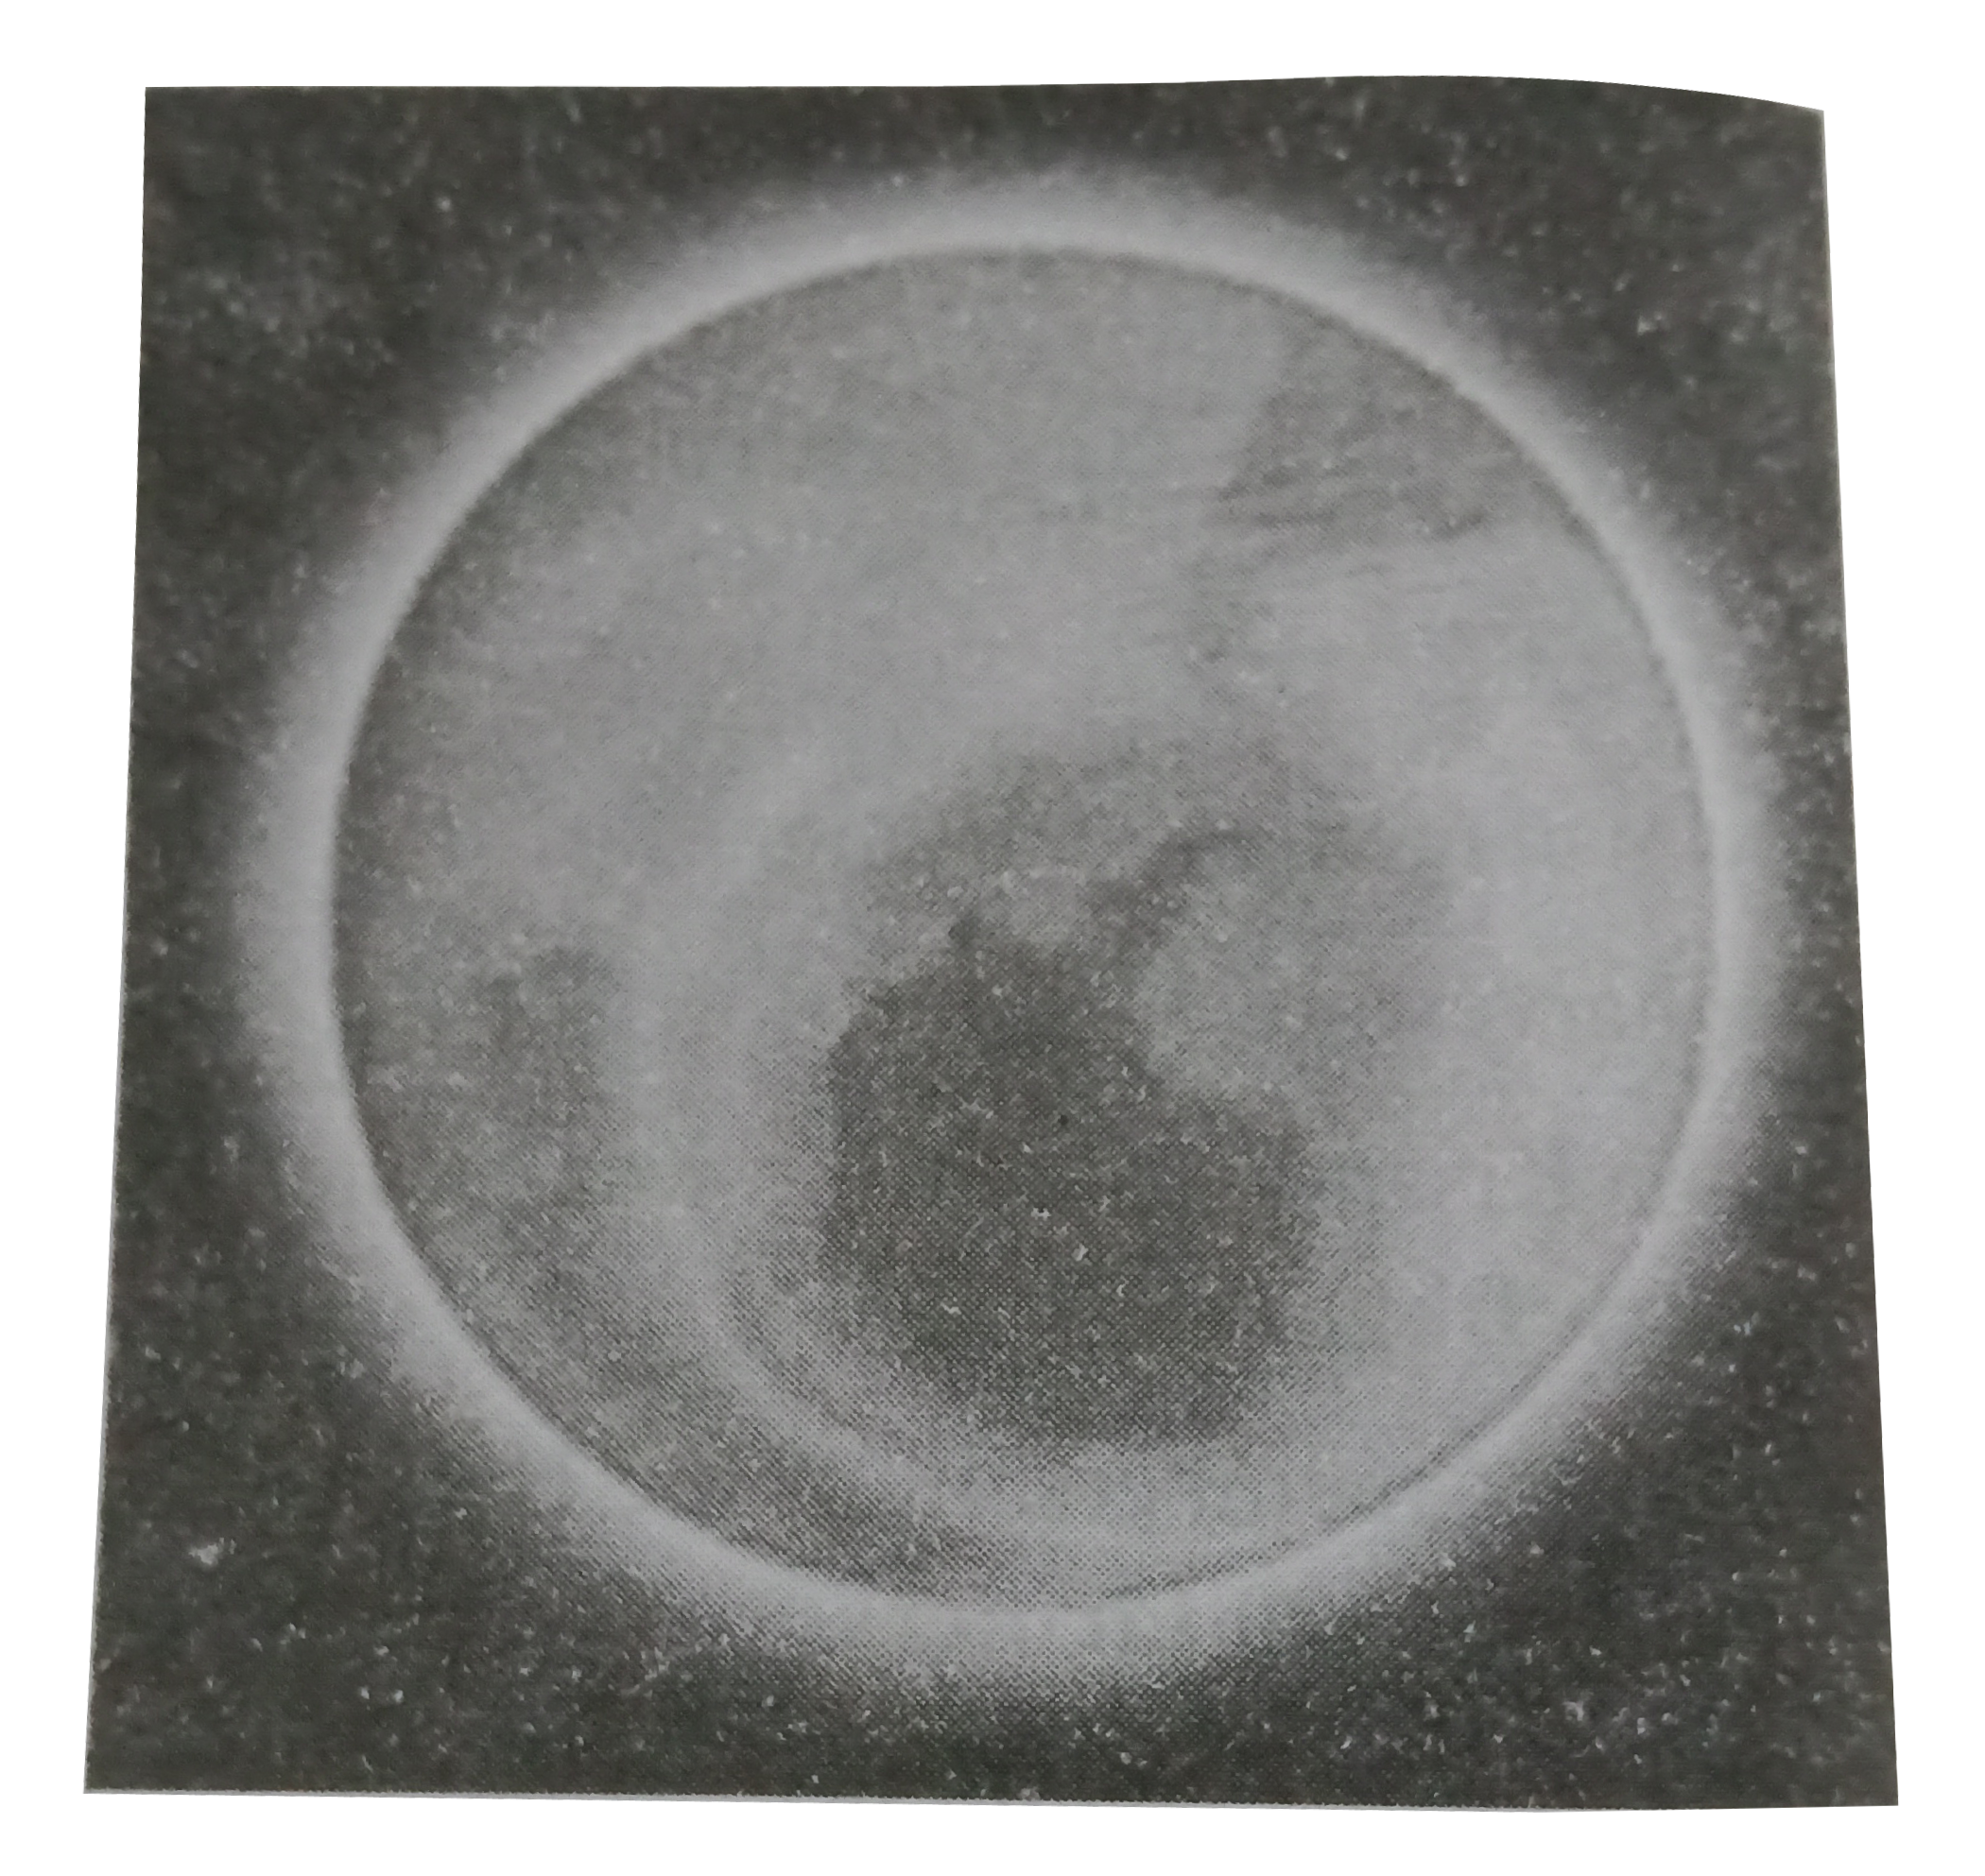
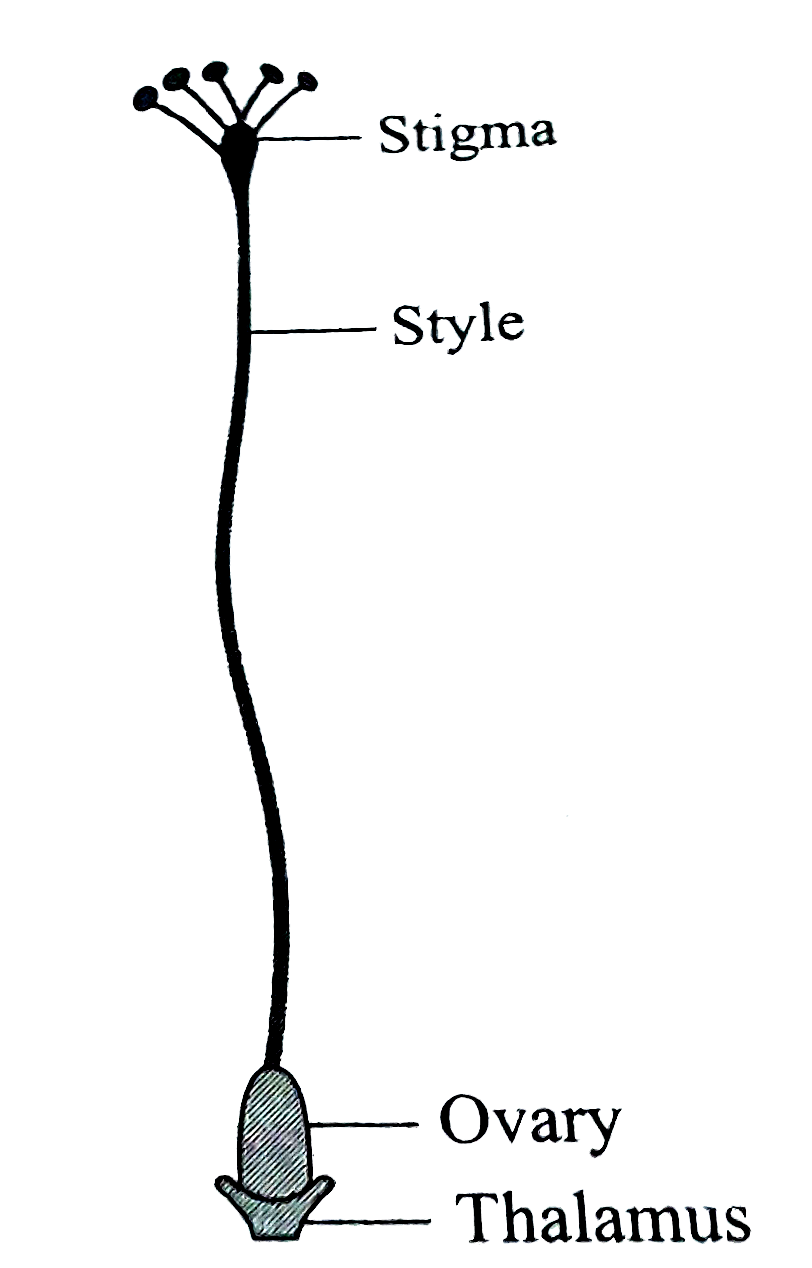
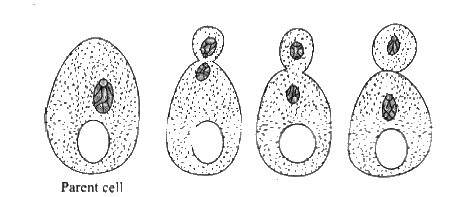
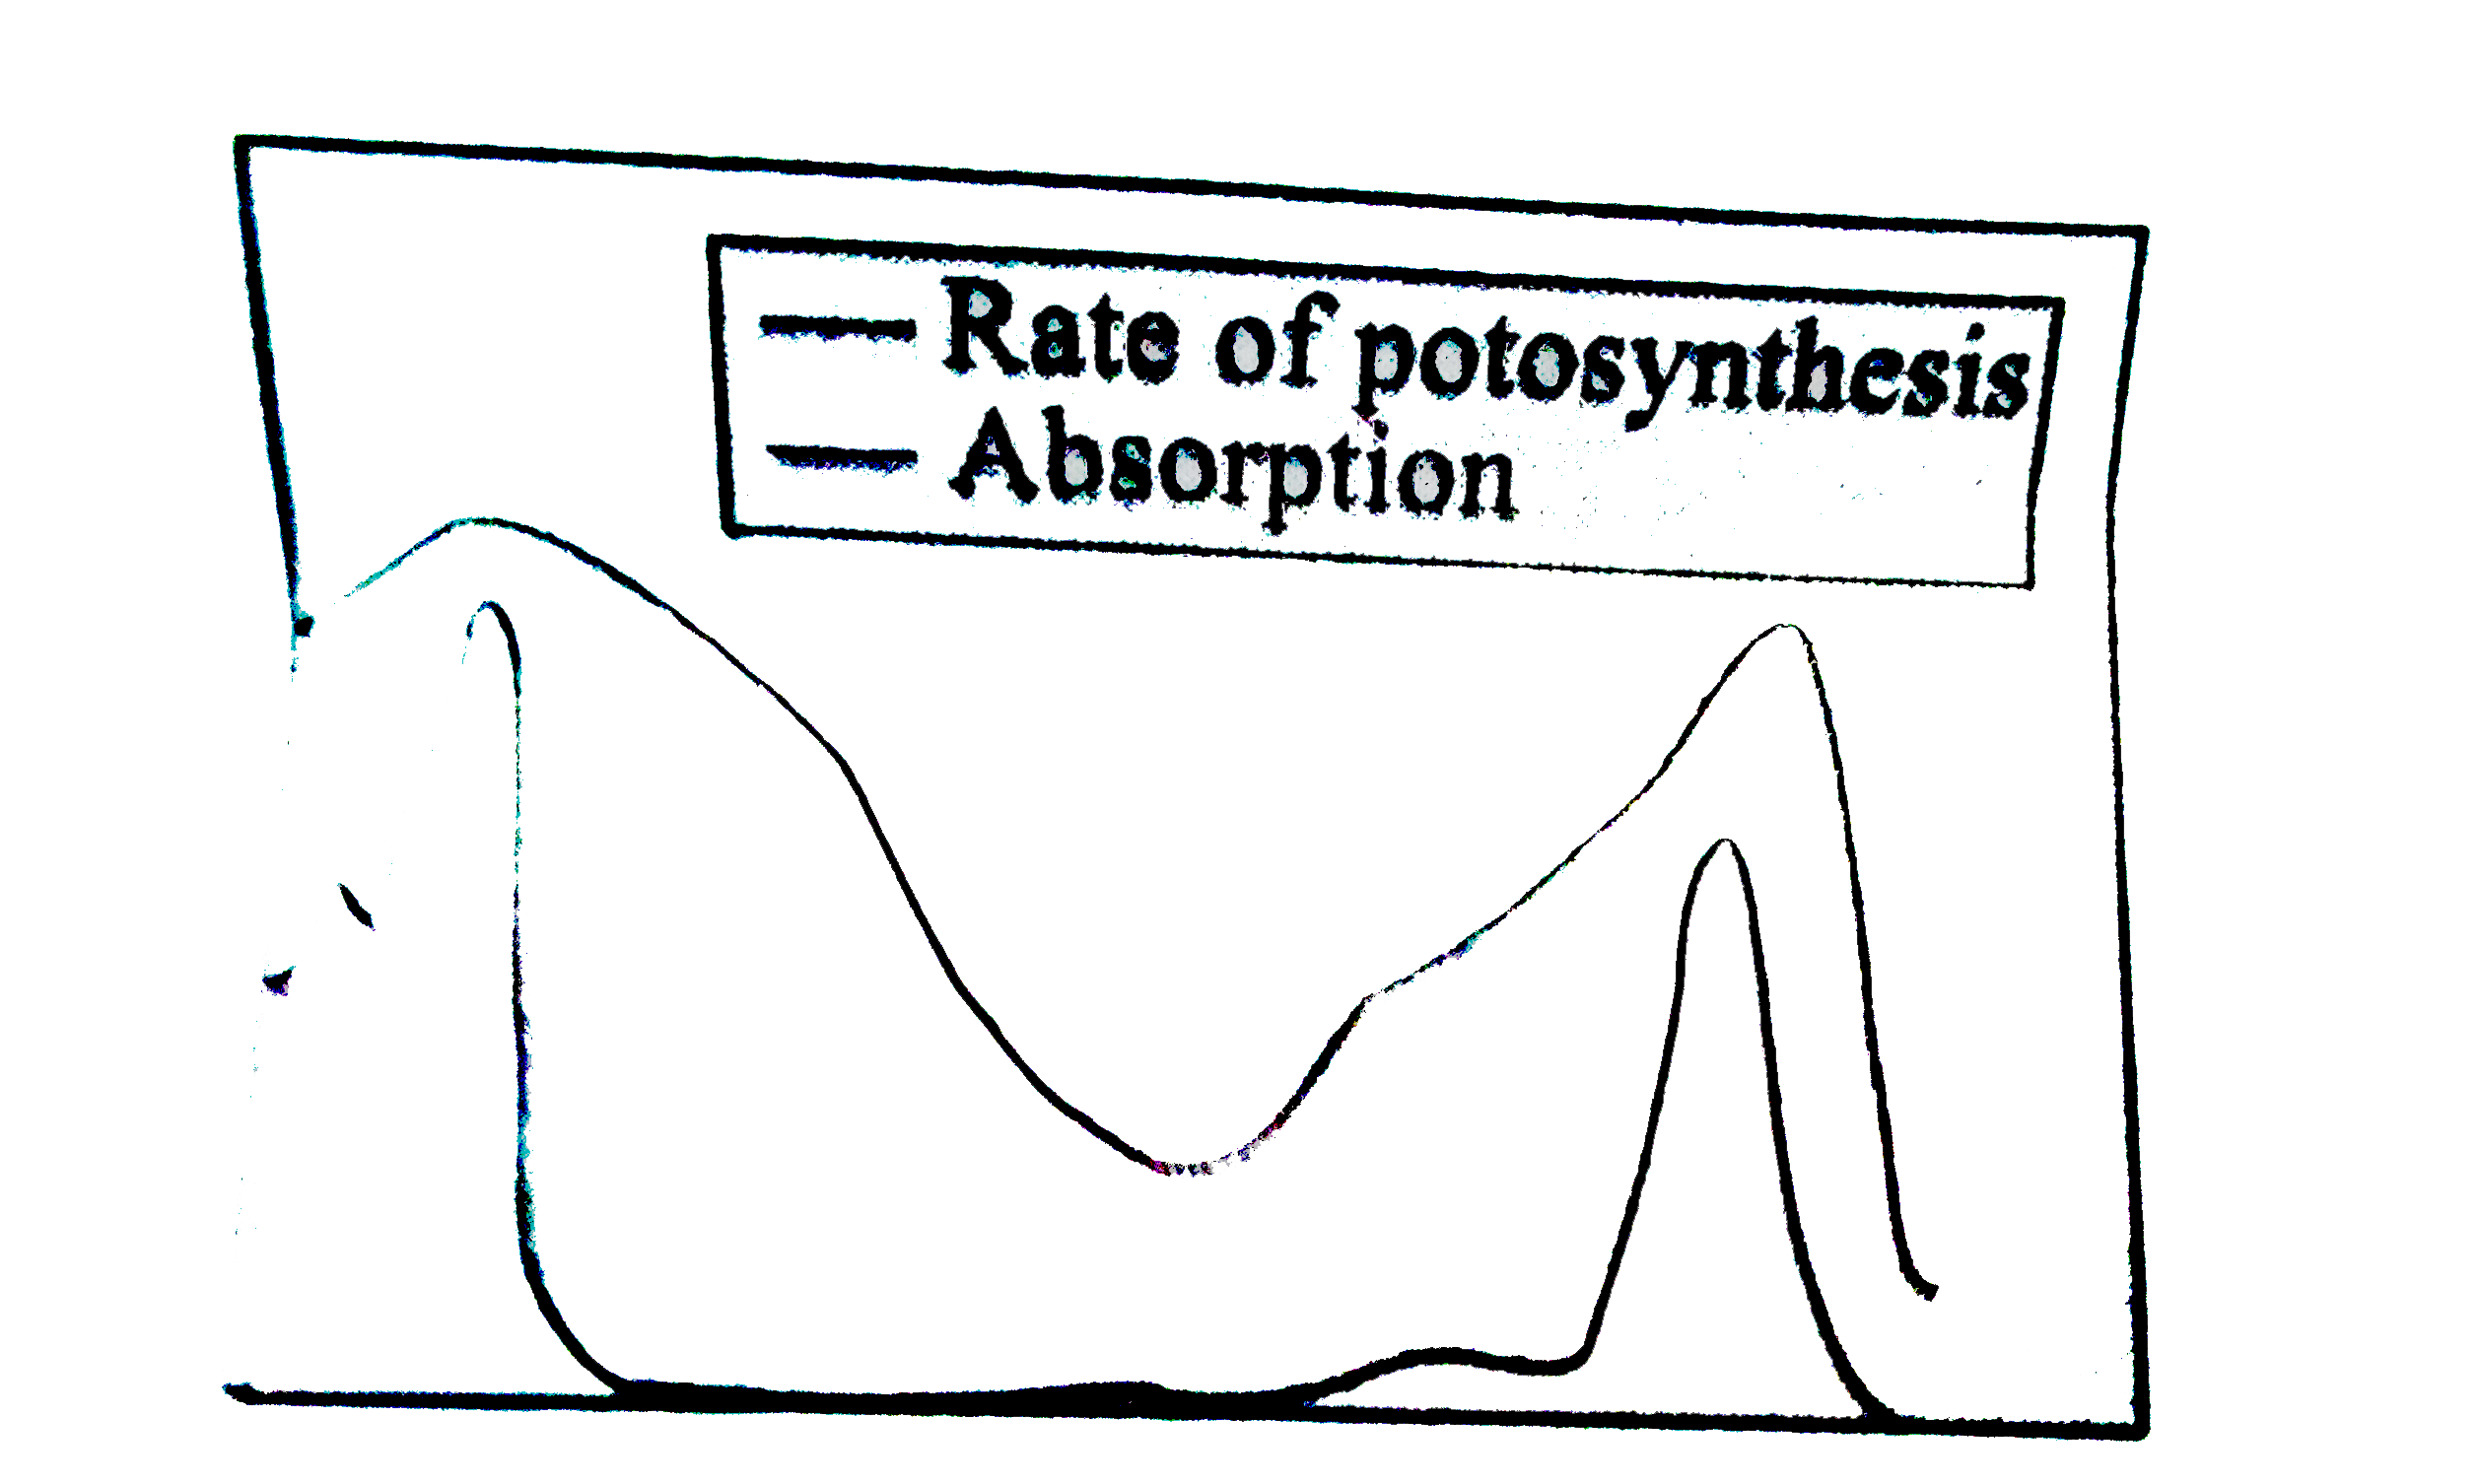
The following figure show the :
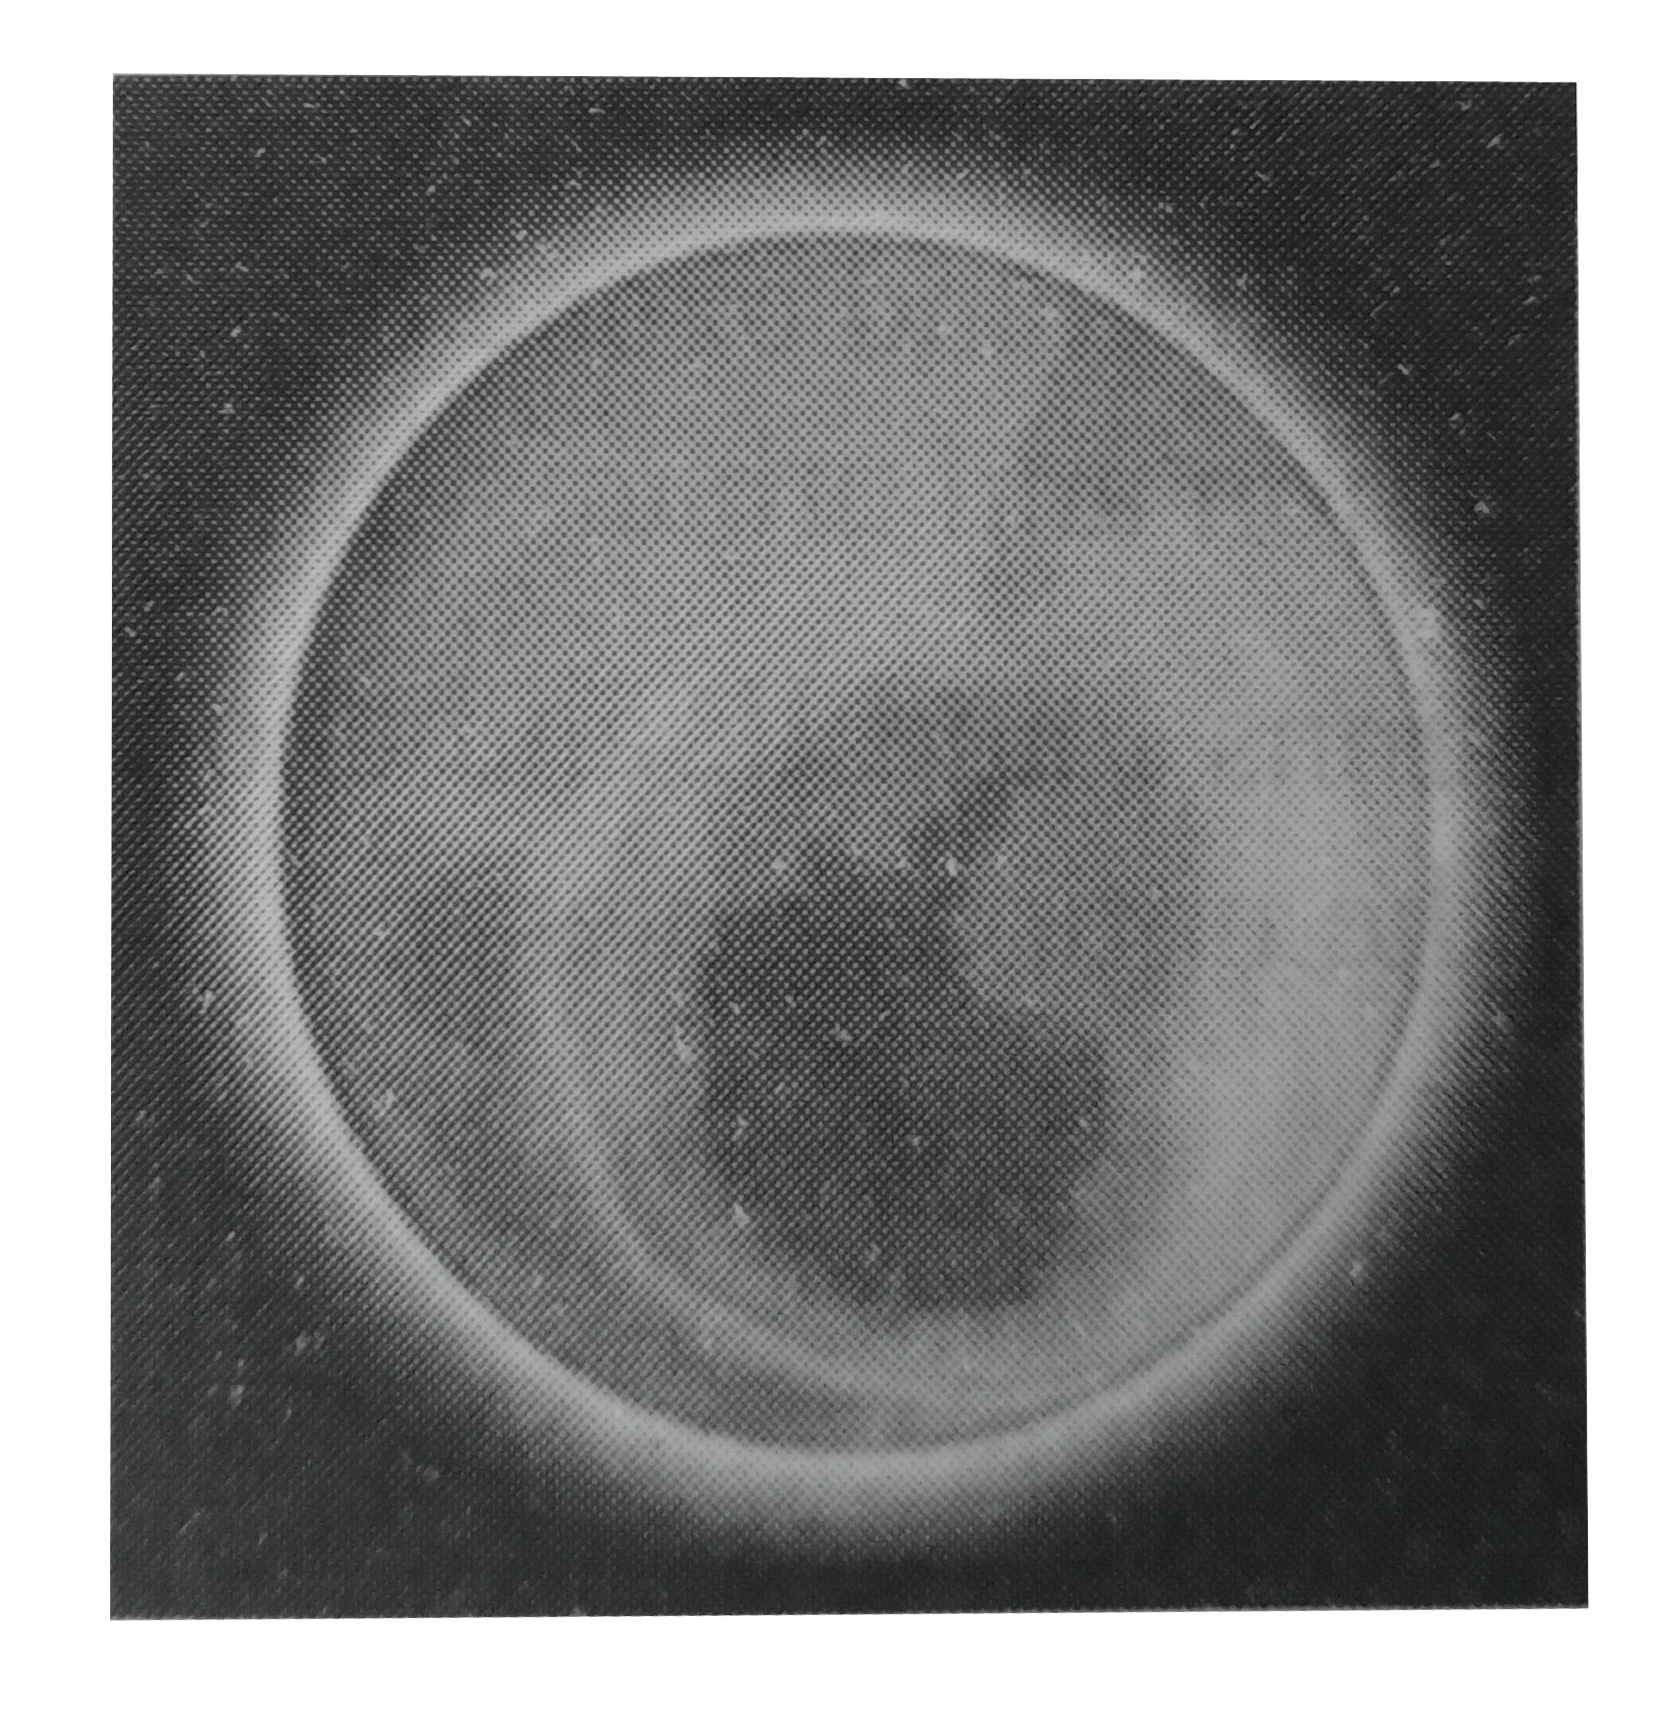
A
Ozone hole
B
Greenhouse effect
C
Global warming
D
El Nino effect
Video Solution
Text Solution
The correct Answer is:A
|
Topper's Solved these Questions
- ENVIRONMENTAL ISSUESBOOK - A2ZCHAPTER - ENVIRONMENTAL ISSUESEXERCISE - Section A: Topicwise Questions (topic 6: Degration By Improper Resource Utilisation And Maintenance,
22 Videos
- ENVIRONMENTAL ISSUESBOOK - A2ZCHAPTER - ENVIRONMENTAL ISSUESEXERCISE - Section B (assertion - Reasoning Questions)
28 Videos
- ENVIRONMENTAL ISSUESBOOK - A2ZCHAPTER - ENVIRONMENTAL ISSUESEXERCISE - Section A: Topicwise Questions (topic 4:green House Effect And Global Warming )
26 Videos
- ECOSYSTEMBOOK - A2ZCHAPTER - ECOSYSTEMEXERCISE - Section-d Chapter-end Test
50 Videos
- EVOLUTIONBOOK - A2ZCHAPTER - EVOLUTIONEXERCISE - Section D : Chapter-end Test
50 Videos
Similar Questions
Knowledge Check
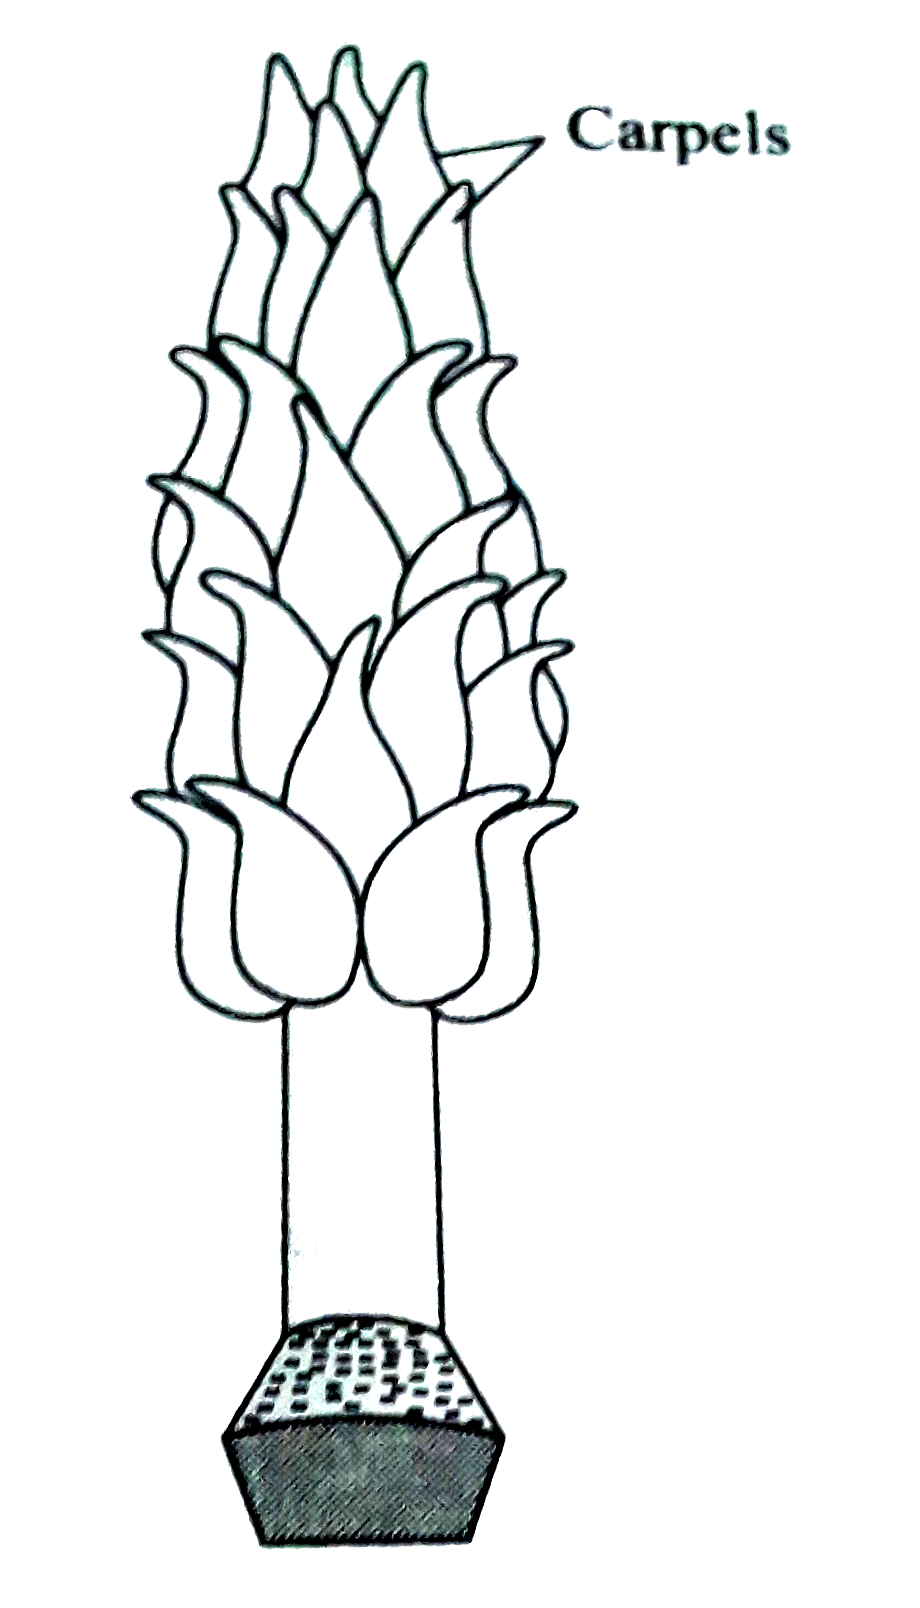
The following figure shows the
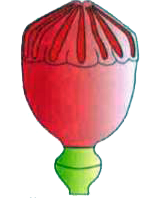 AMulticarpellary suncarpous pistil of PapaverBMulticarpellary apocarpous gynoecium of MicheliaCPentacarpellary syncarpous gynoecium of the MicheliaDMulticarpellary apocarpous gynoecium of the Papaver
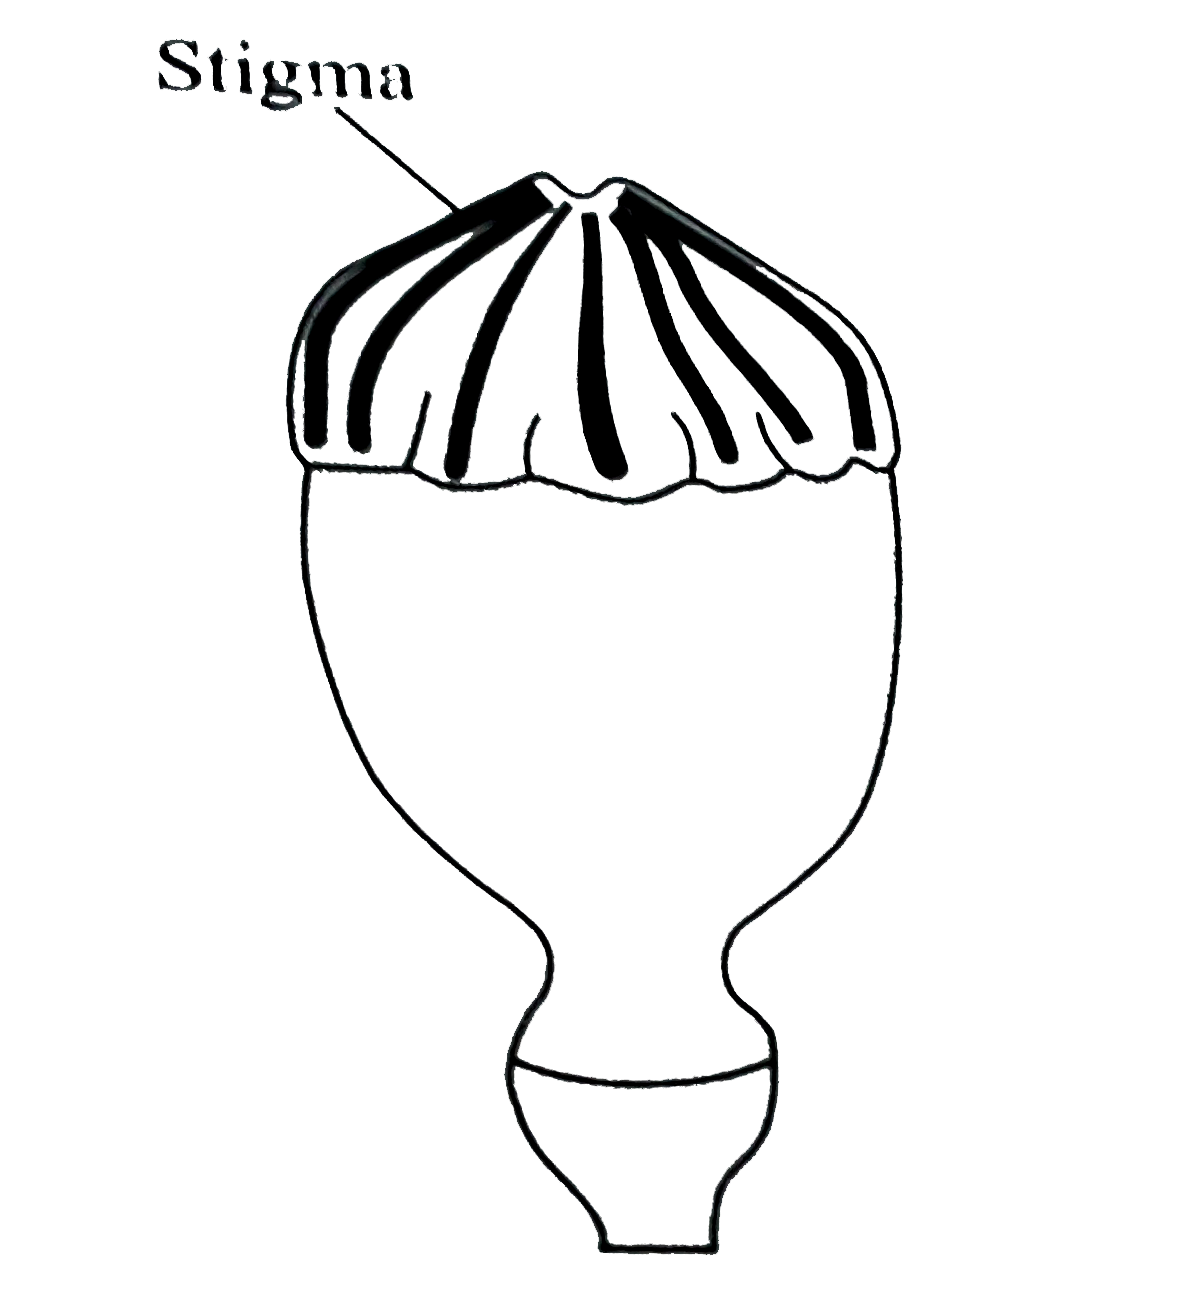
The following figure shows the
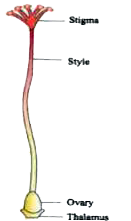 AMulticarpellary syncarpous pistil of PapaverBMulticarpellary apocarpous gynoecium of MicheliaCPentacarpellary syncarpous gynoecium of the HibiscusDMulticarpellary apocarpous gynoecium of the chinarose
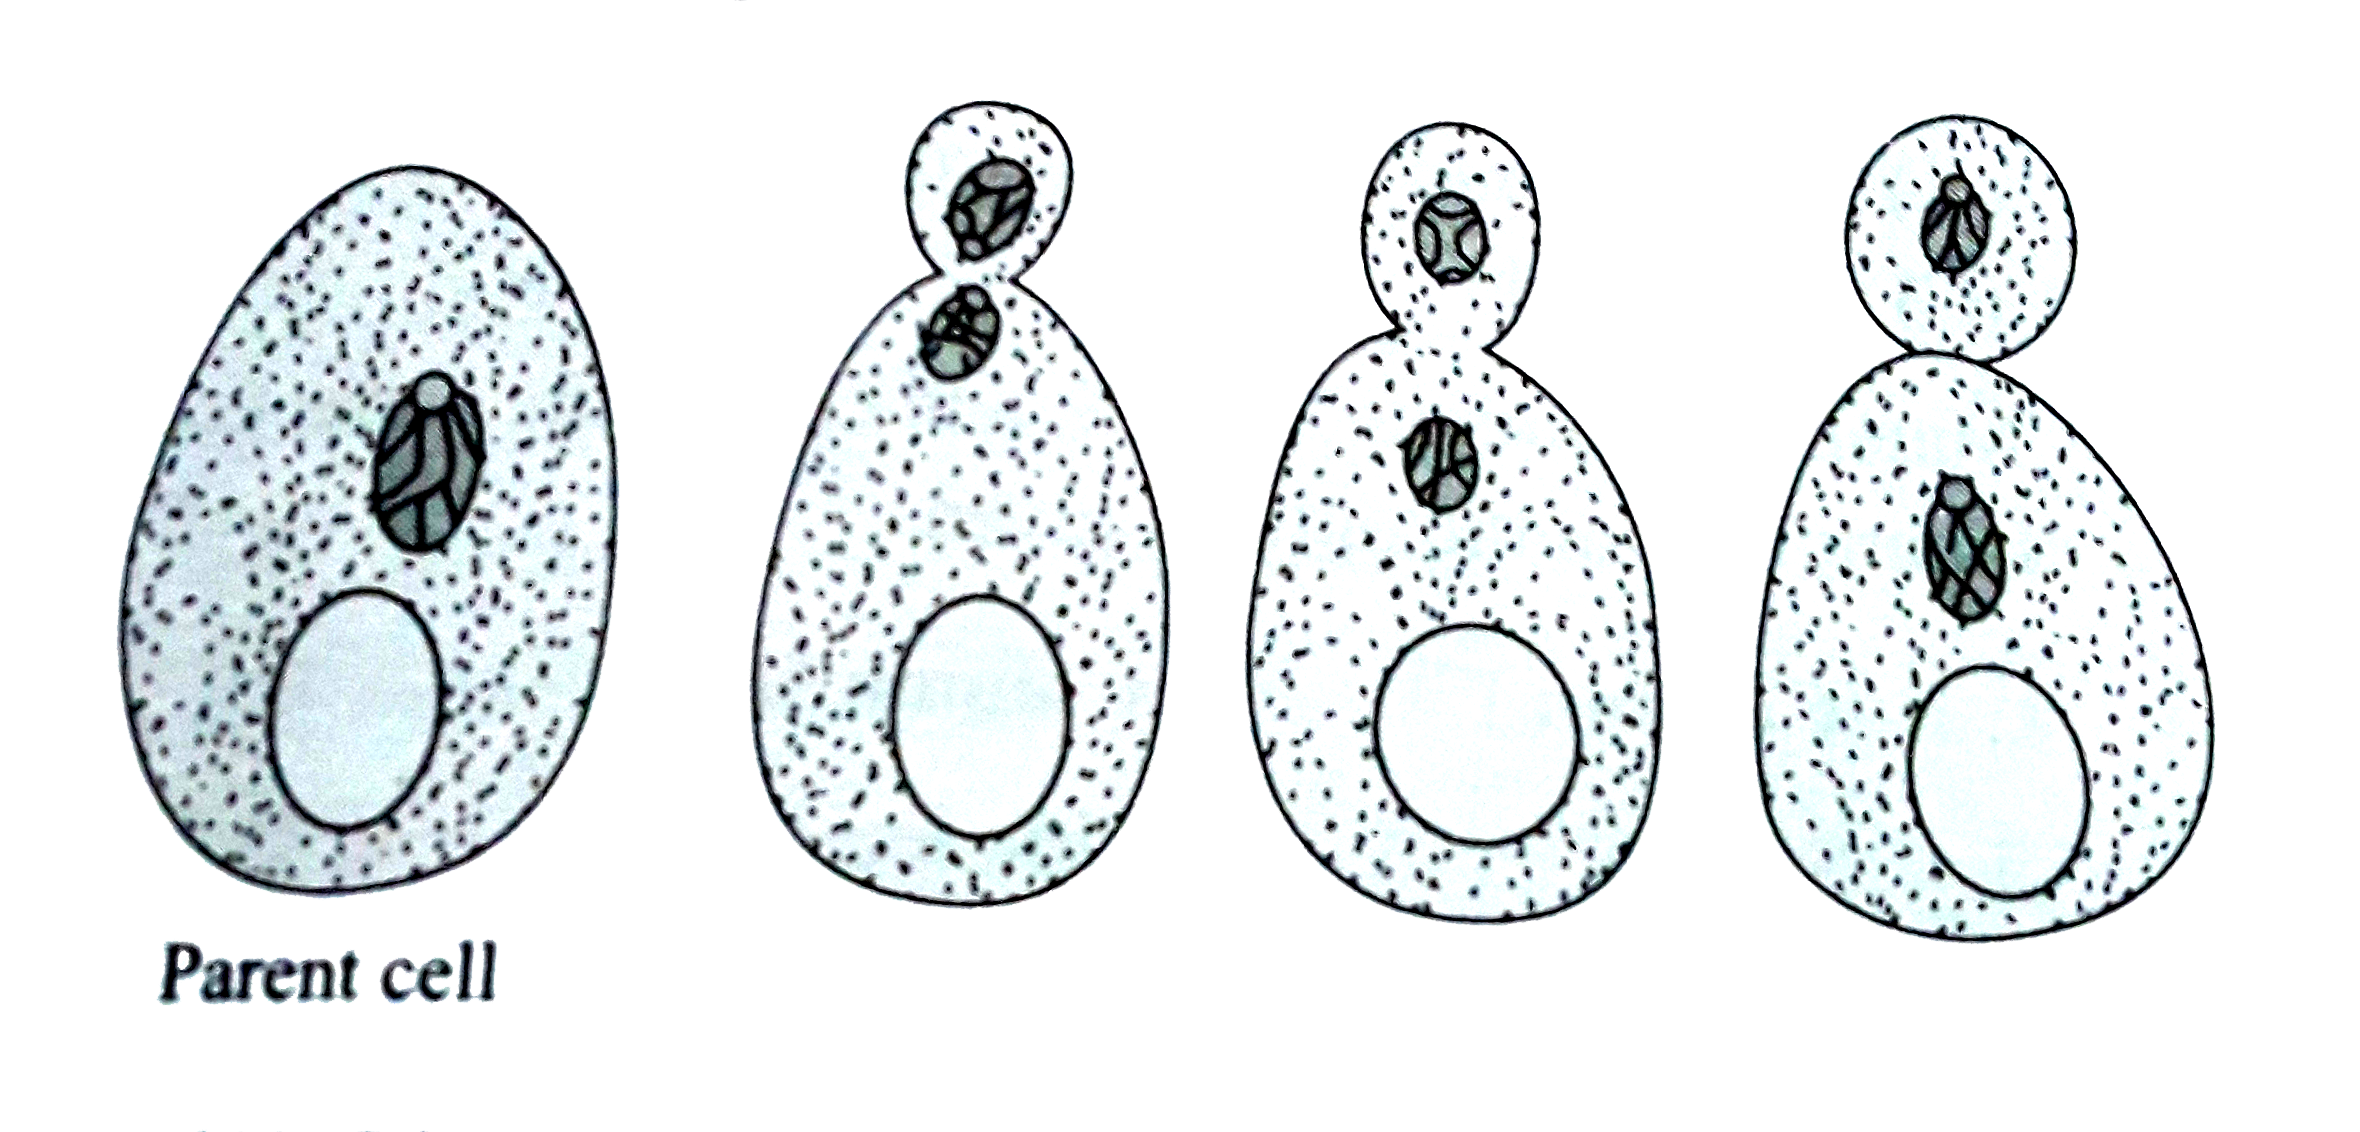
The following figure shows the
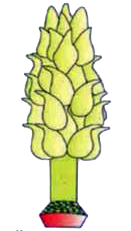 AMulticarpellary suncarpous pistil of PapaverBMulticarpellary apocarpous gynoeciumCPentacarpellary syncarpous gynoecium of the MicheliaDMulticarpellary apocarpous gynoecium of the Papaver
