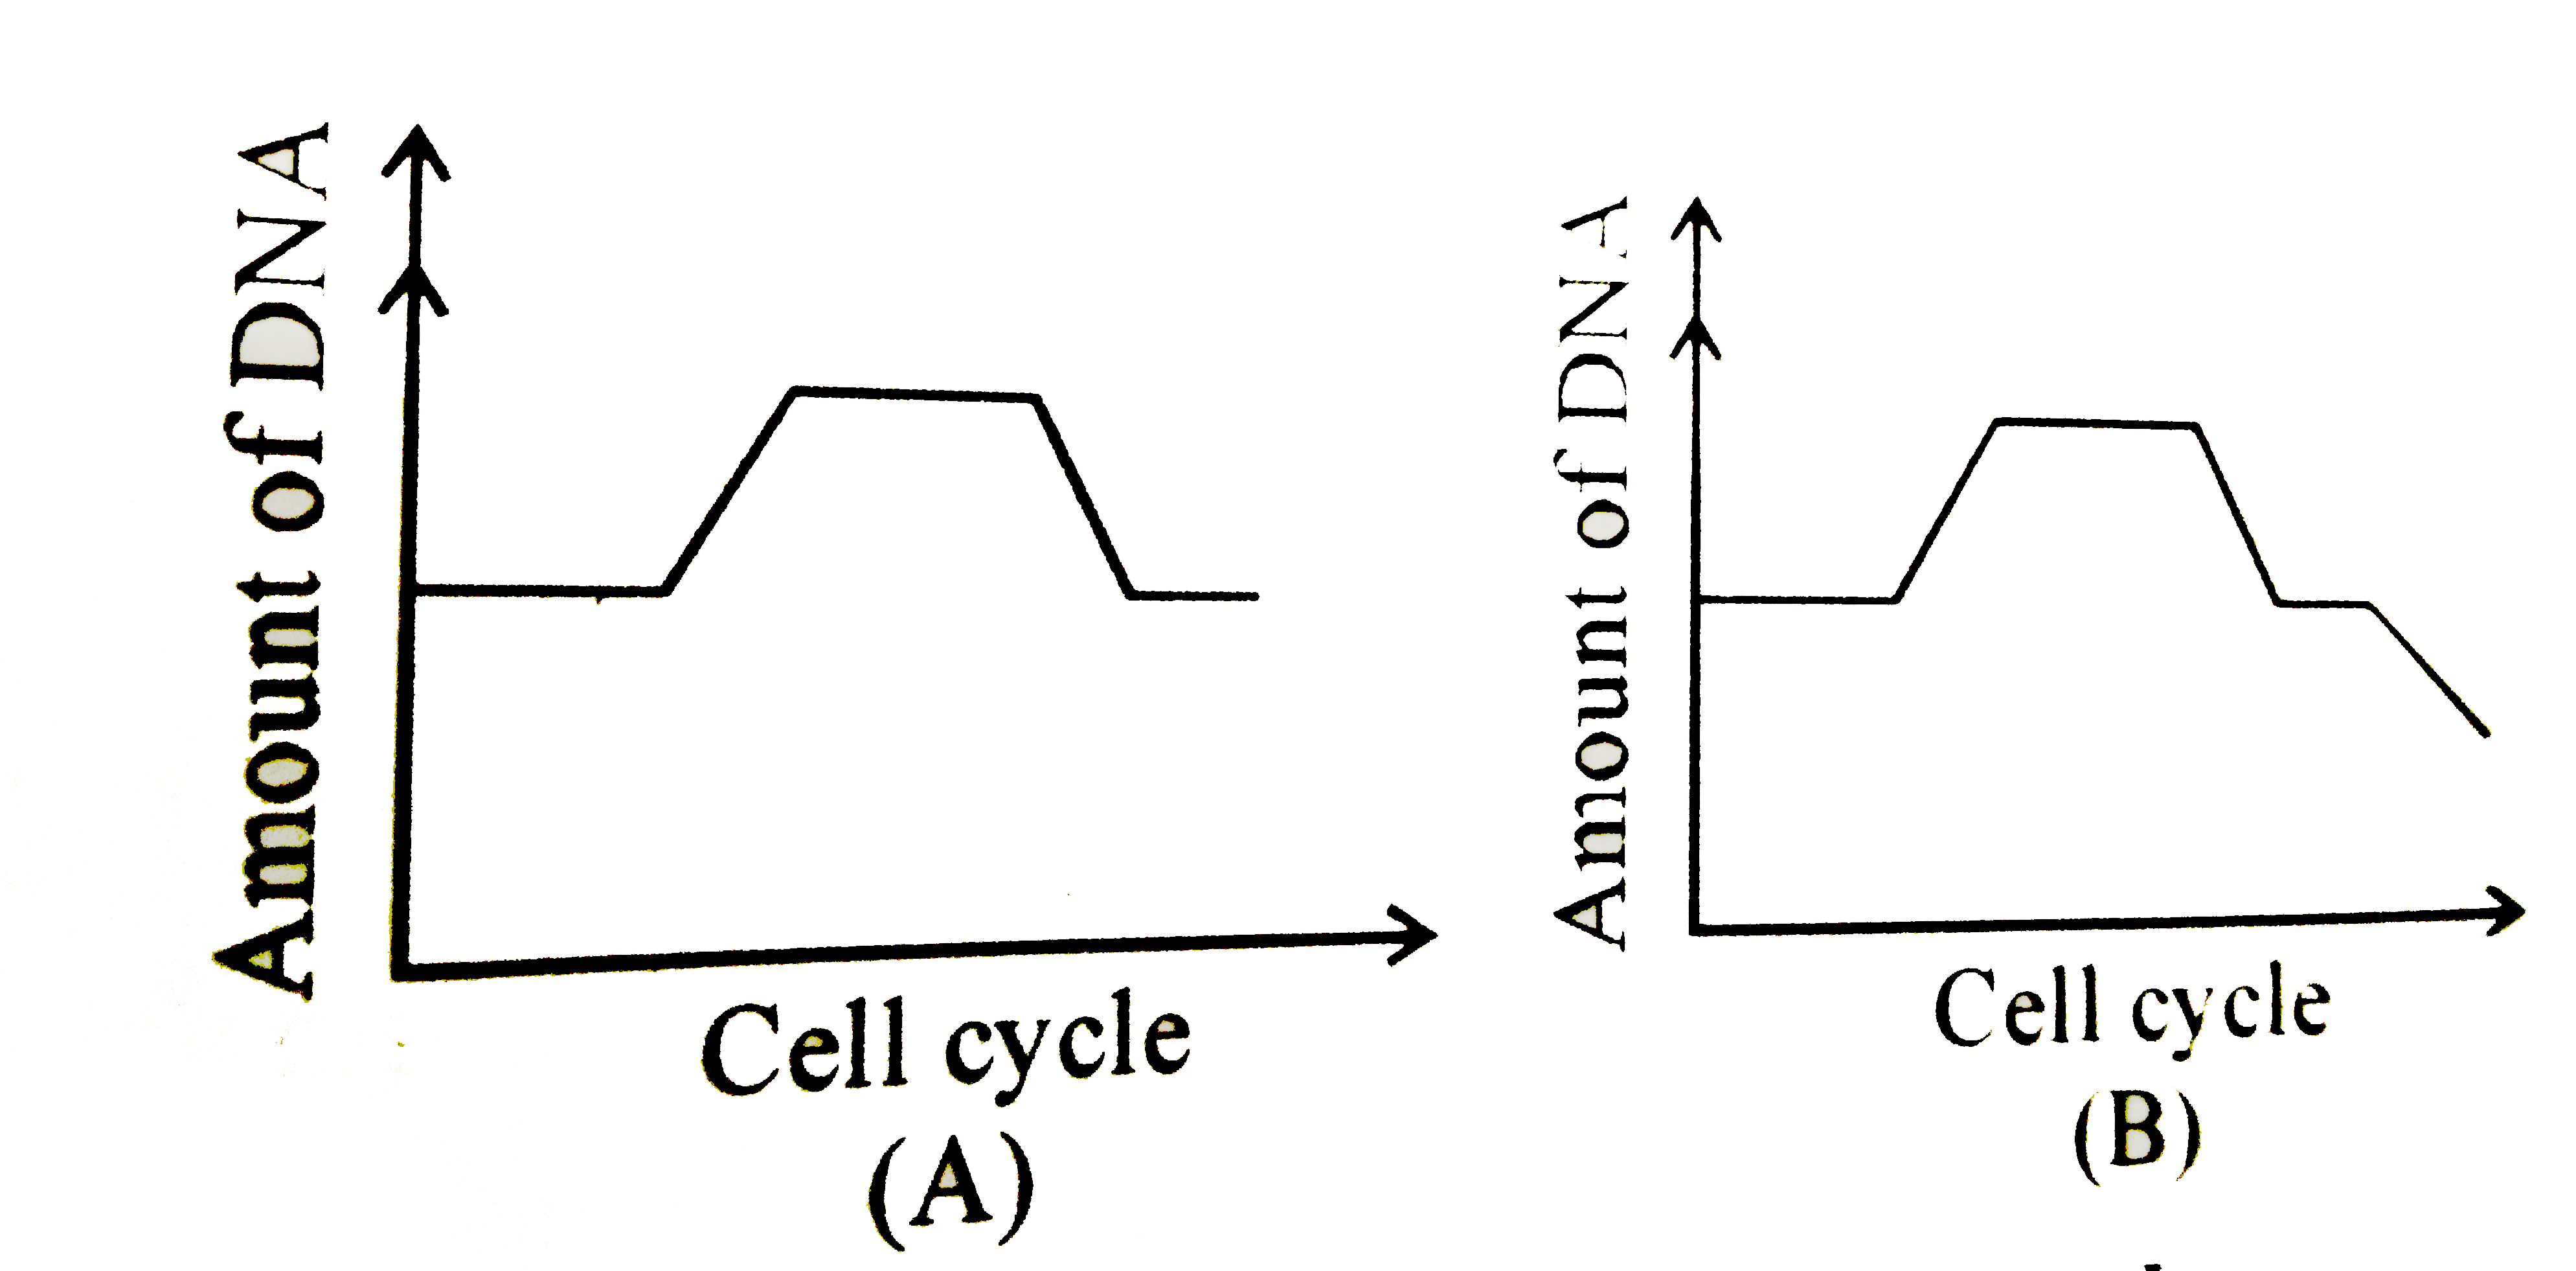
The following graphs (A and B) depicts changes in DNA Content during cell cycle. Identify the cell divison from A and B :-
A
A→Meiosis-II,B→Meiosis-I
B
A→Mitosis,B→Meiosis-I
C
A→Meiosis-I,B→Mitosis
D
A→Mitosis,B→Meiosis
Video Solution
Text Solution
The correct Answer is:D
|
Answer
Step by step video & image solution for The following graphs (A and B) depicts changes in DNA Content during cell cycle. Identify the cell divison from A and B :- by Biology experts to help you in doubts & scoring excellent marks in Class 12 exams.
Updated on:21/07/2023Similar Questions
Knowledge Check
DNA synthesis during cell cycle takes place in
AG1BS phaseCG2 phaseDG0 phaseDuring cell cycle, DNA replicates
AOnceBTwiceCMany timesDNot at allWhich of the following graphs best depicts the changes in one cycle of PCR ?
A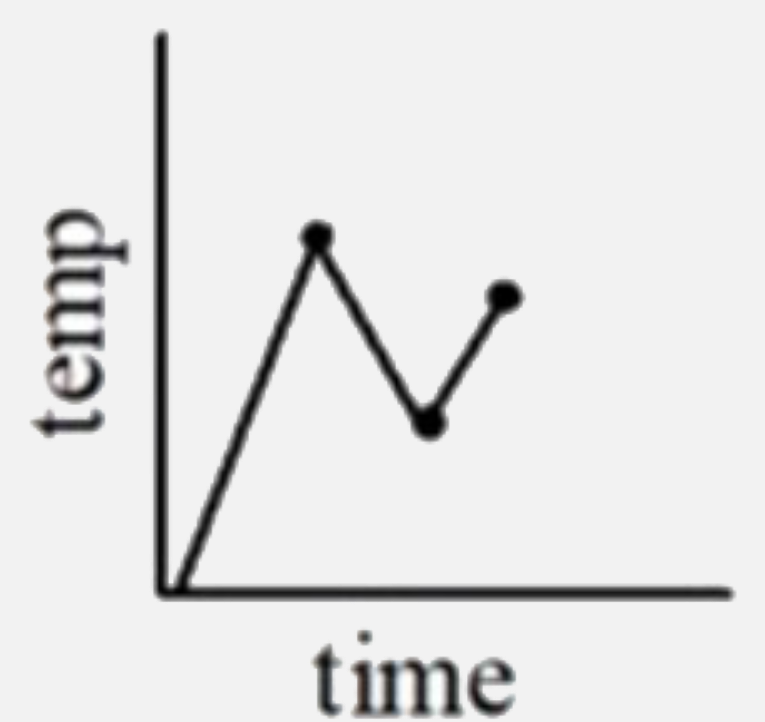 B
B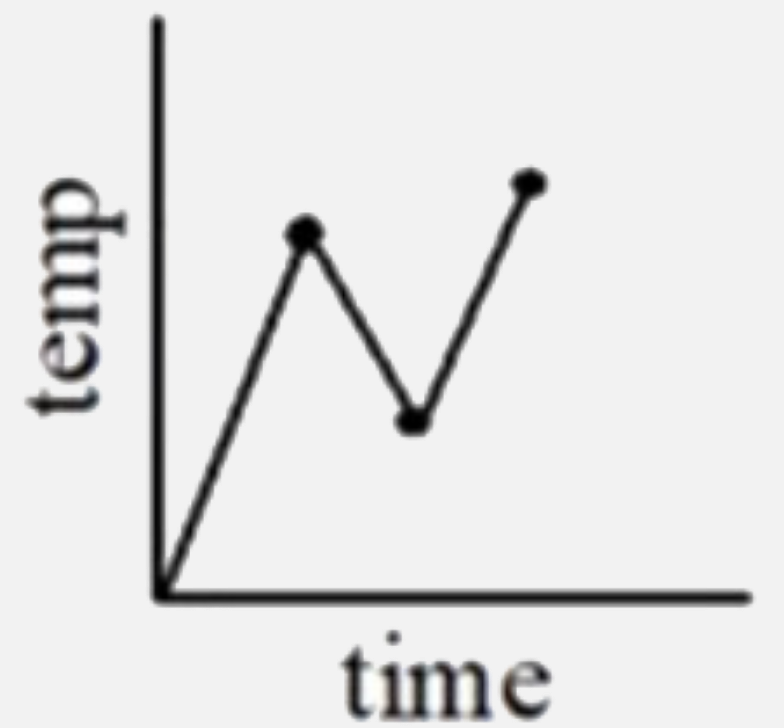 C
C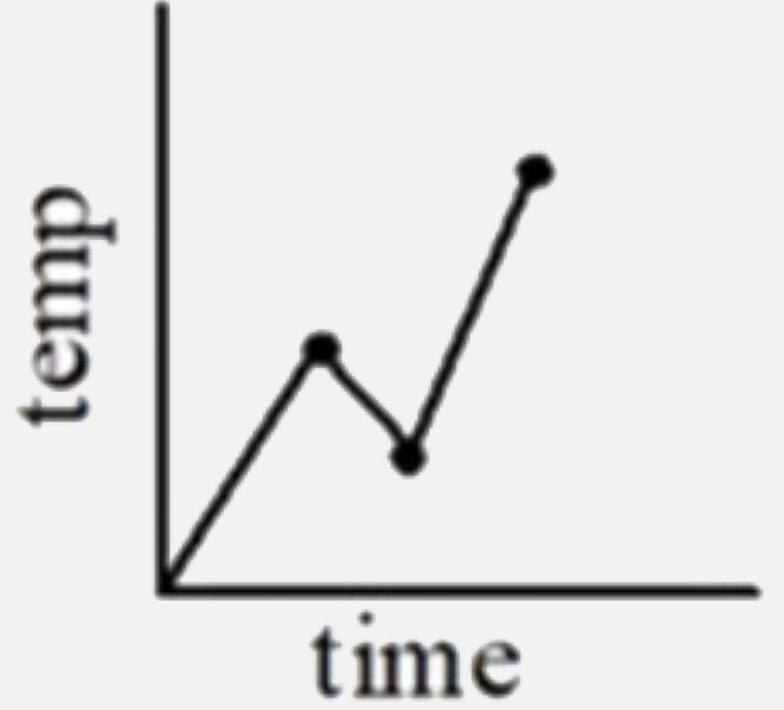 D
D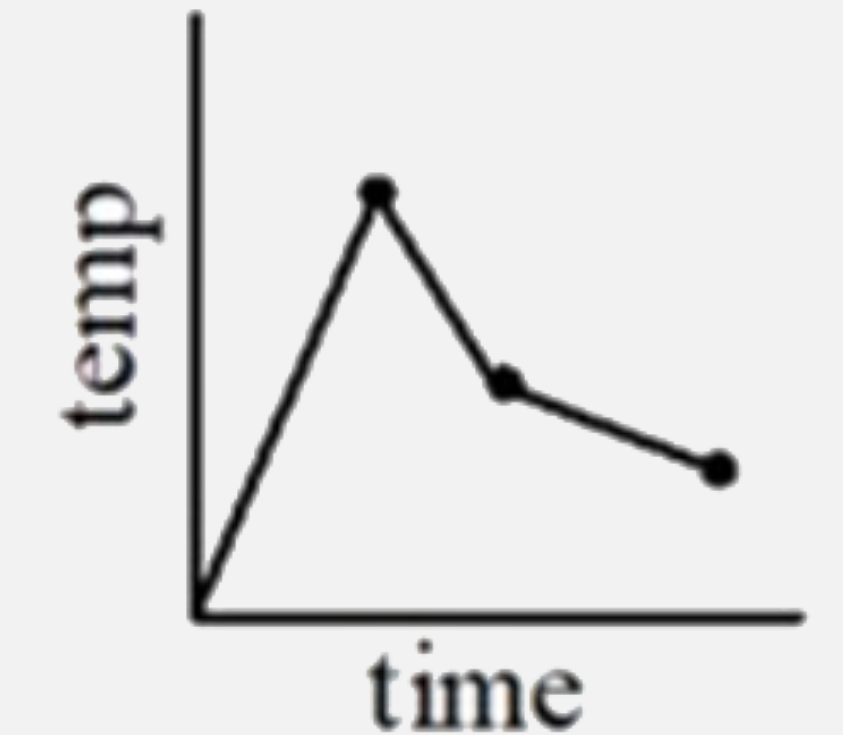
What happens in synthesis phase during cell cycle:-
View SolutionEach cell grows during the cell cycle in
View SolutionRabi orientation of chromosomes during cell cycle
View SolutionThe given graph shows the change in DNA content during various phases (A to D) in a typical mitotic cell cycle. Identify the phases and select the correct option.
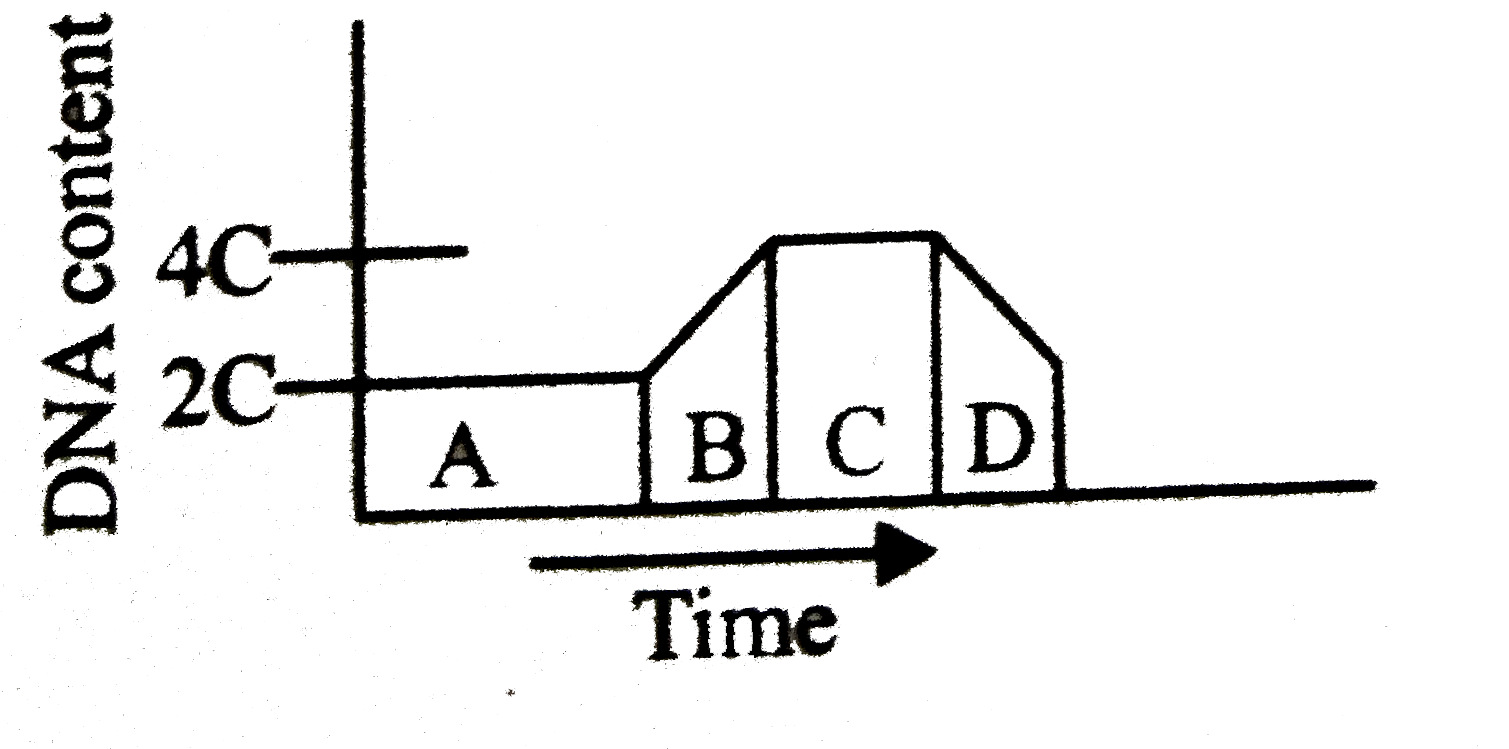
View SolutionMost of the histone production during cell cycle occurs in
View Solution
