The given figure represents the food web of a river.
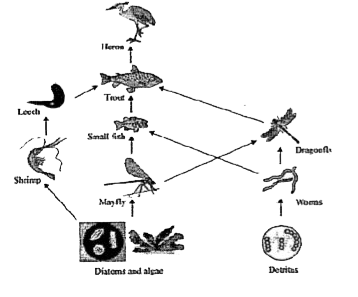
A decrease in trout population will lead to
A decrease in the population of algae and diatoms
An increase in the population of herons and shrimps
A decrease in the population of small fish and worms
An increase in the population of leeches and dragonflies
Step by step video & image solution for The given figure represents the food web of a river. A decrease in trout population will lead to by Biology experts to help you in doubts & scoring excellent marks in Class 6 exams.
Updated on:21/07/2023Topper's Solved these Questions
- OUR ENVIRONMENTBOOK - BETOPPERSCHAPTER - OUR ENVIRONMENTEXERCISE - SUMMATIVE WORKSHEET (MULTIPLE TYPE QUESTIONS)
6 Videos
- OUR ENVIRONMENTBOOK - BETOPPERSCHAPTER - OUR ENVIRONMENTEXERCISE - SUMMATIVE WORKSHEET (FILL IN THE BLANKS)
11 Videos
- OUR ENVIRONMENTBOOK - BETOPPERSCHAPTER - OUR ENVIRONMENTEXERCISE - SUMMATIVE WORKSHEET (ANSWER THE FOLLOWING QUESTIONS:)
24 Videos
- LIFE ON EARTHBOOK - BETOPPERSCHAPTER - LIFE ON EARTHEXERCISE - SUMMATIVE WORKSHEET
5 Videos
- SOILBOOK - BETOPPERSCHAPTER - SOILEXERCISE - SUMMATIVE WORKSHEET
14 Videos
Similar Questions
Knowledge Check
The given figure best represents
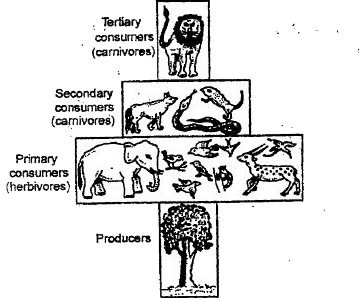 APyramid of number in parasitic food chainBPyramid of biomass in forest ecosystemCPyramid of number in grassland ecosystemDPyramid of number in forest ecosystem
The symbol given in figure represents
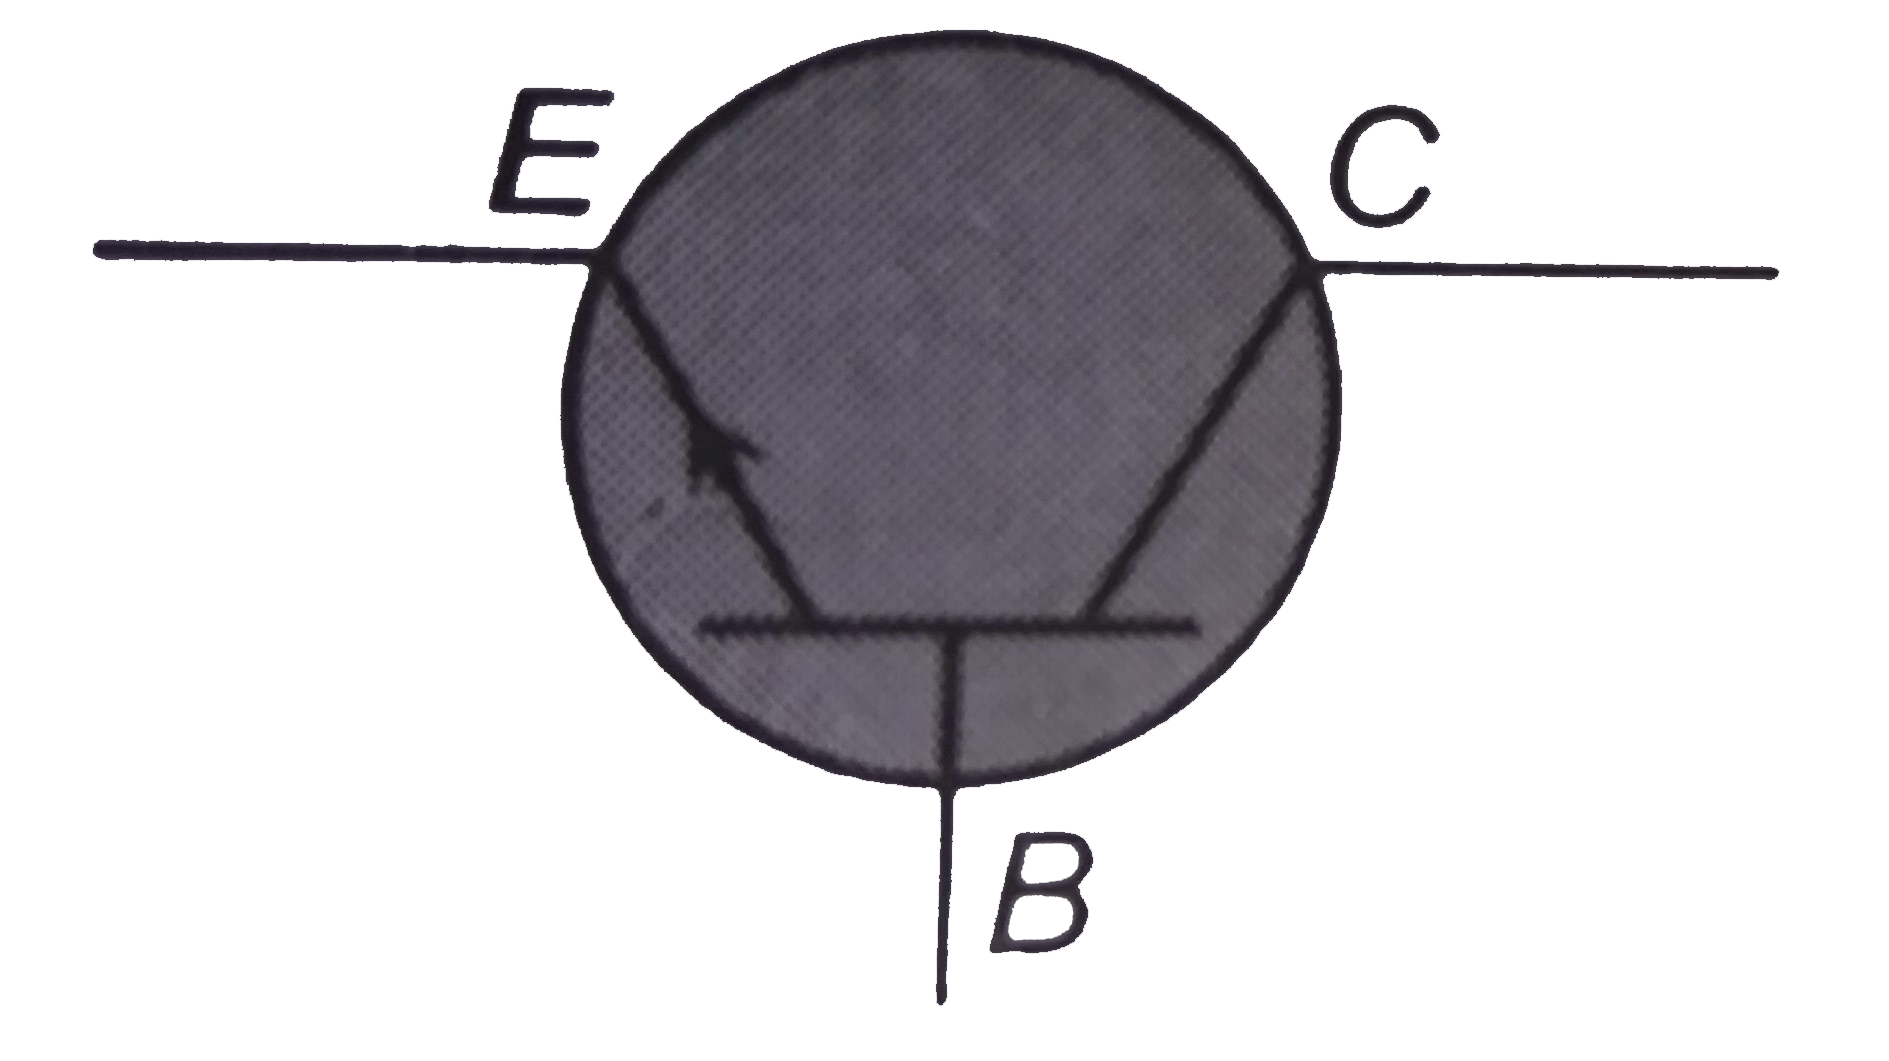 ANPN transistorBPNP transistorCForward biased PN junction diodeDReverse biased NP junction diode
The given figure represents a material which is
 AA-DNA,B-RNA, C-Rho factorBA-RNA, B-RNA polymerase, C- Rho factorCA-RNA, B-RNA polymerase, C- sigma factorDA-DNA, B-DNA polymerase, C-Sigma factor
The given figure represents a material which is
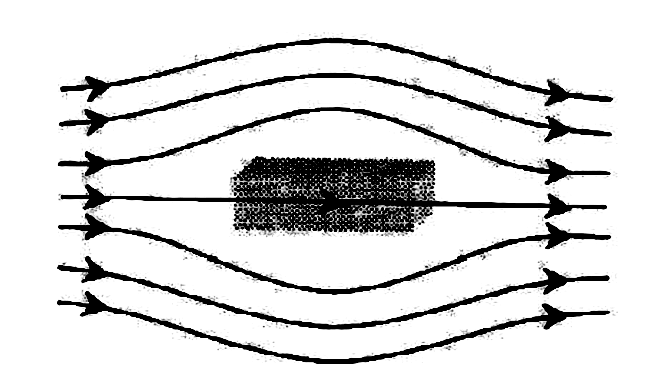
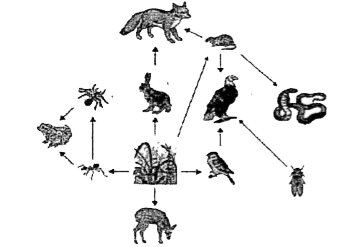
View SolutionThe given figure represents a food web.
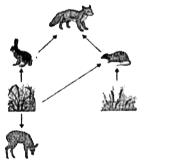
Who is the producer in the given food web?
View SolutionThe given figure shows a food web in a particular forest.
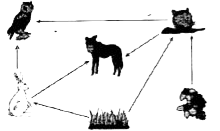
The introduction of deer population in the given forest will result in
View Solution
What dows the given figure represent?
View SolutionWhat does the given figure represent?
View Solution

