The given graphs show number and average biomass of different organisms present in an aquatic ecosystem.
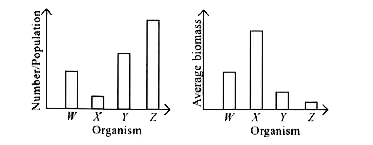
Select the correct option regarding the food chain formed by interlinking organisms W, X, Y and Z.
X could be a producer and forms the first link in the food chain formed by interlinking these organisms.
Y and W could be primary and secondary consumers respec tively in the food chain formed by interlinking these organisms .
The correct relation of these organisms in the food chain is X→W→Z→Y.
If a population of an exotic species is introduced in this community which exclusively feeds on X, then populations of Z and W will be negatively affected.
The correct Answer is:B
In an aquatic ecosystem, the members of successive higher trophic level are fewer than the previous one and biomass of successive trophic level is higher than the previous one. On the basis of this, the correct relation of these organisms in the food chain is Z→Y→W→X. Therefore, Z is producer Y is primary consumer, W is secondary consumer and X is top consumer. If exotic species that exclusively feeds on X, is introduced then population of W and Z will increase.
Topper's Solved these Questions
Similar Questions
Knowledge Check
Refer to the given Venn diagram and select the correct option regarding Y and Z.
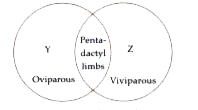 AY can be lizard and Z can be tiger.BY can be bat and Z can be ostrich.CY can be snake and Z can be emu.DY can be crocodile and Z can be frog.
Refer to the given figure and select the correct option regarding X,Y and Z.
 AXYZBrachioaurusArchaeopteryxTriceratopsBXYZArchaeopteryxTryannosaurusPteranodonCXYZArchaeopteryxStgosaurusTryrannosaurusDXYZArchaeopteryxBrachiosaurusTriceratops
The given figure shows transport of two molecules A and B through three different modes of facilitated diffusion. Select the correct option regarding it.
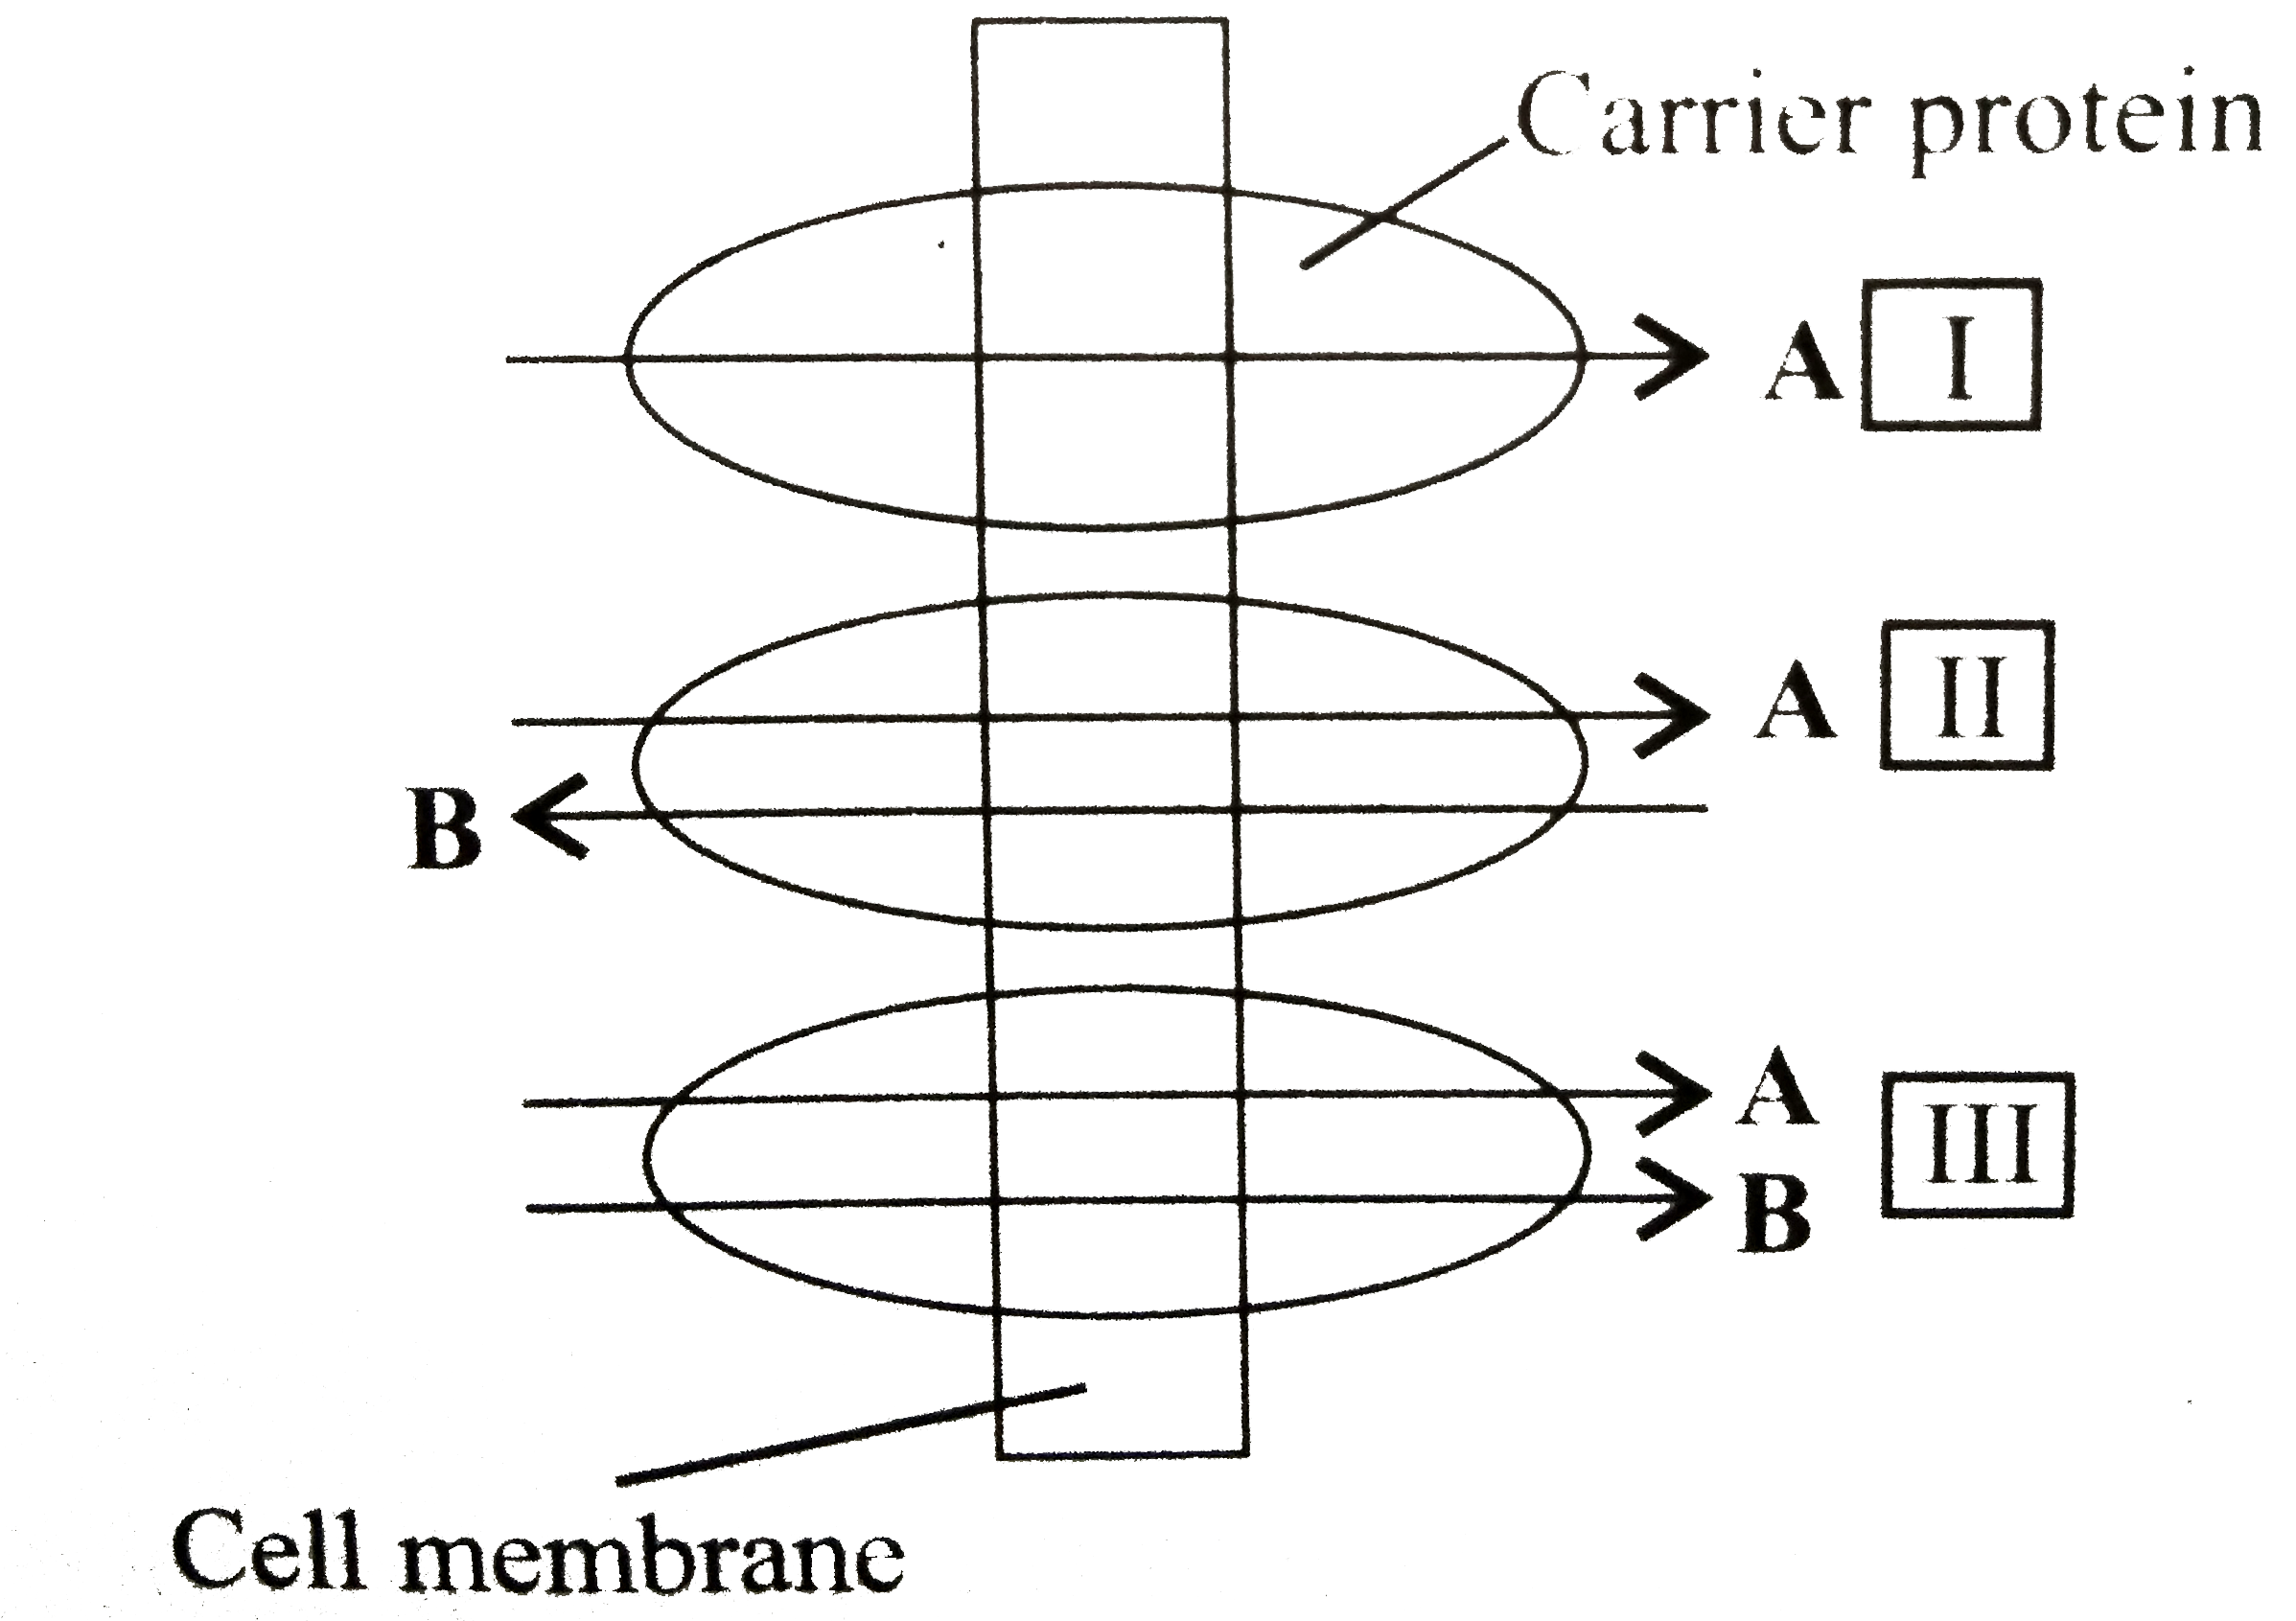 AIIIIII(a)UniportSymportAntiportBIIIIII(a)UniportAntiportSymportCIIIIII(a)AntiportUniportSymportDIIIIII(a)AntiportSymportUniport
Refer to the given figure and select the correct option regarding functions of X and Y.
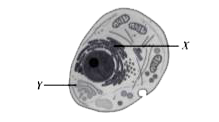

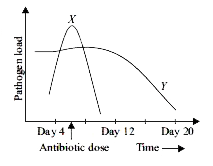
View SolutionThe given graph shows the pathogen load in the body of a person during the period of sickness.
Now select the correct option regarding this.
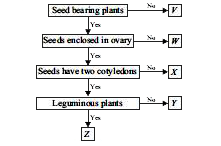
View SolutionRefer to the given flow chart and select the correct option regarding V, W, X, Y and Z.
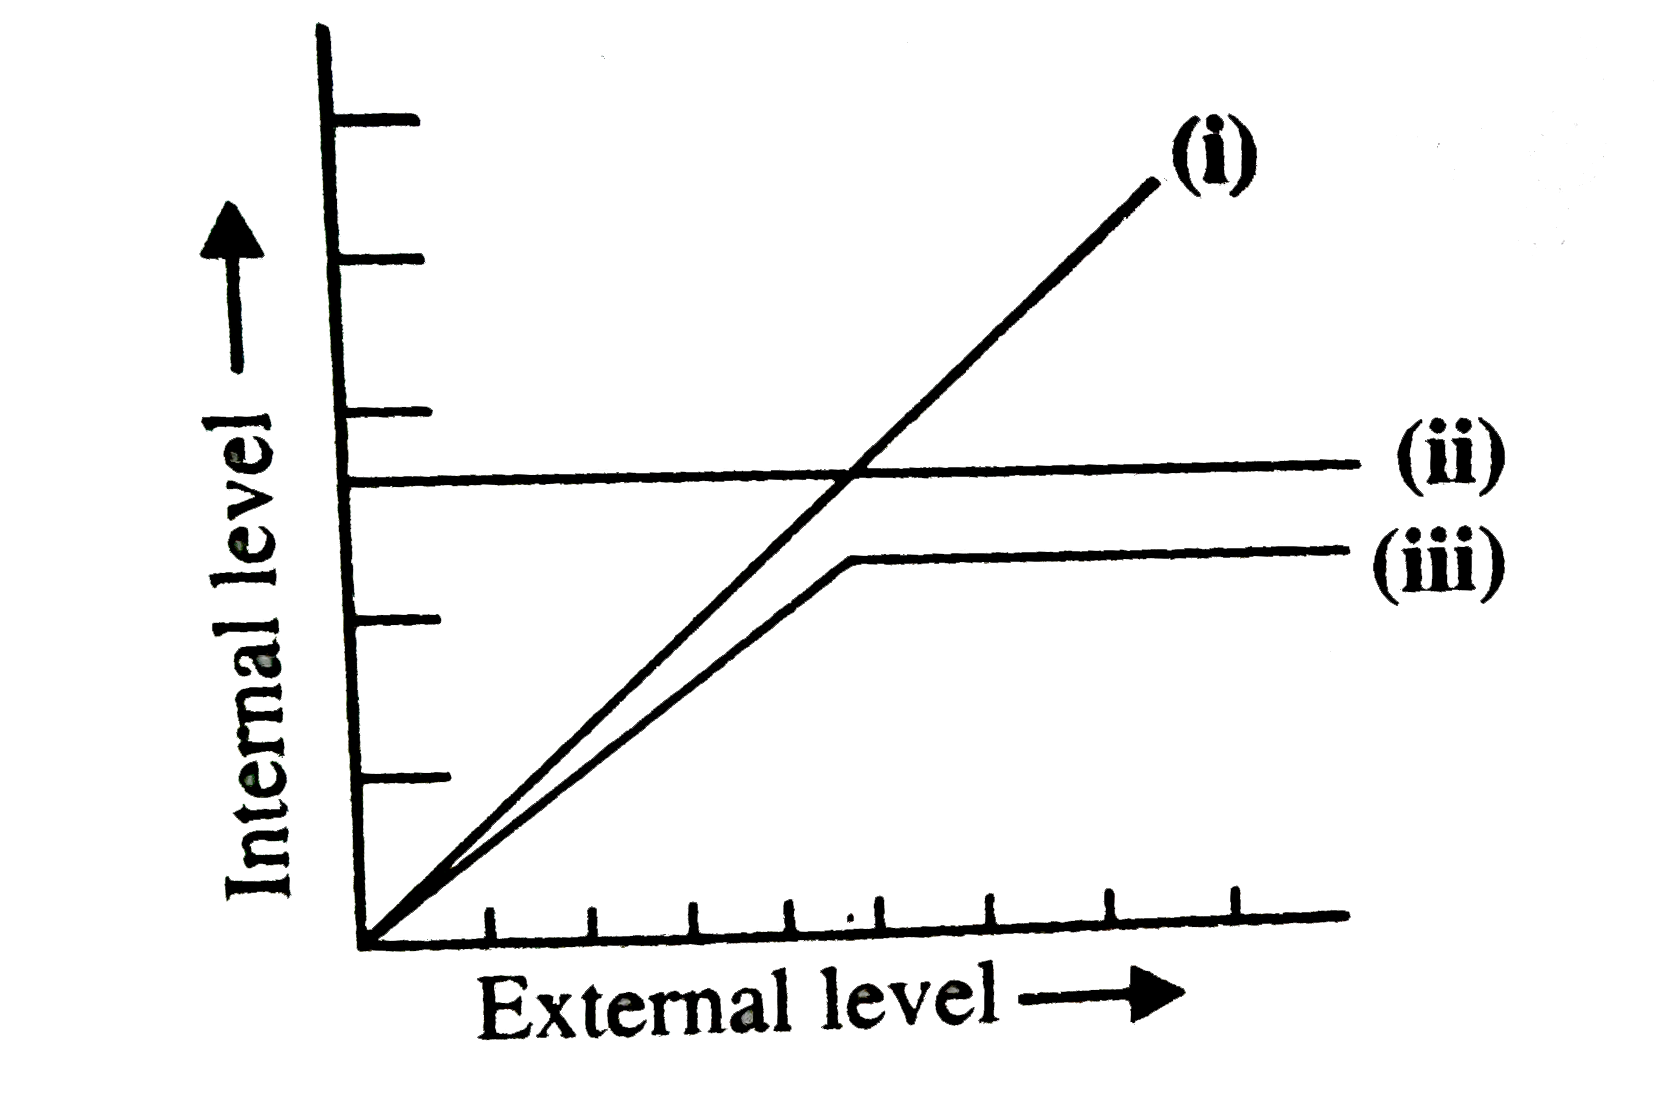
View SolutionGiven graph represents the response of organisms to various abiotic factors. On this basis, select the correct option for (i), (ii) and(iii)
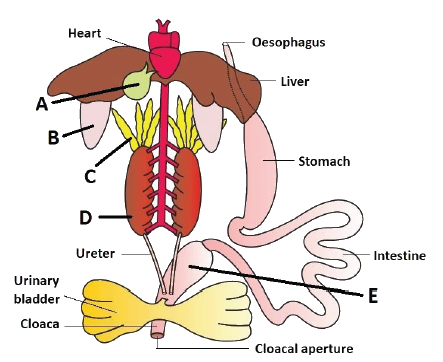
View SolutionThe figure given here shows diagrammatic representation of internal organs of frog. Identify A to E and select the correct option :
View Solution

