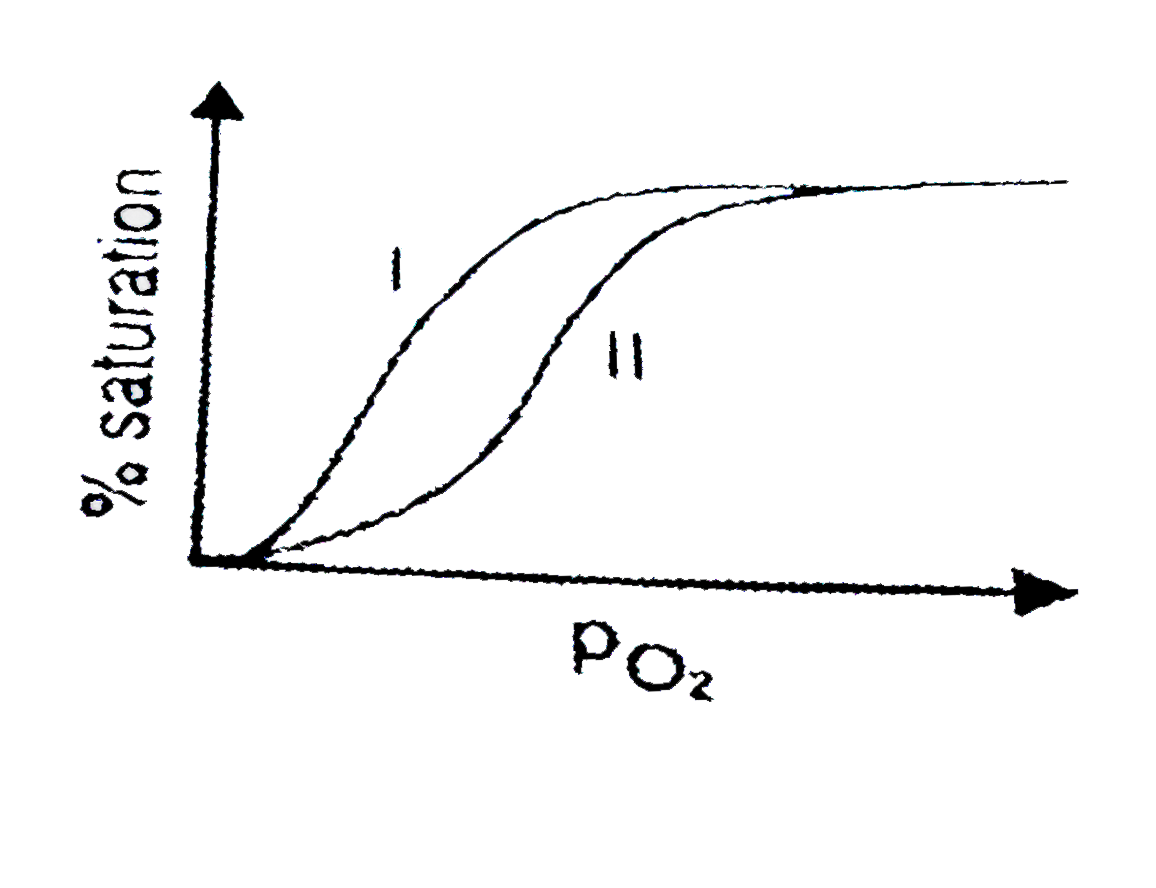
When precentrage saturation of haemoglobin with O2 is plotted against pO2 , the curve obtained is
A
J-shaped
B
hyperbola
C
sigmoid
D
U-shaped
Video Solution
Text Solution
The correct Answer is:C
|
Answer
Step by step video, text & image solution for When precentrage saturation of haemoglobin with O_(2) is plotted against pO_(2) , the curve obtained is by Biology experts to help you in doubts & scoring excellent marks in Class 12 exams.
Updated on:21/07/2023
Related Playlists
- BOOK - ARIHANT NEETCHAPTER - BREATHING AND EXCHANGE OF GASES EXERCISE - Chapter exercises B (Medical entrances special format questions )21videos
BREATHING AND EXCHANGE OF GASES
- BOOK - ARIHANT NEETCHAPTER - BODY FLUID AND CIRCULATIONEXERCISE - MEDICAL ENTRANCES GALLERY COLLECTION OF QUESTIONS ASKED IN NEET AND VARIOUS MEDICAL ENTRANCE EXAMS72videos
BODY FLUID AND CIRCULATION
- BOOK - ARIHANT NEETCHAPTER - CELL CYCLE AND CELL DIVISIONEXERCISE - Chapter Exercises (C) Medical entrances gallery (collection of questions asked in NEET & Various medical entrance exams)63videos
CELL CYCLE AND CELL DIVISION
Knowledge Check
- Question 1 - Select One
Assertion : A sigmoid curve is obtained when percentage saturation of haemoglobin with O2 is plotted against the PO2.
Reason : Every 100 mL of oxygenated blood can deliver around 5mL of O2 to the tissues under normal physiological conditions.AIf both assertion and reason are true and reason is the correct explanation of assertionBIf both assertion and reason are true and reason is not the correct explanation of assertionCIf assertion is true but reason is false.DIf both assertion and reason are false. - Question 1 - Select One
Combination of haemoglobin with O2 in lungs can be promoted by
AIncreasing CO2 concentration in bloodBIncreasing O2 concentration in bloodCDecreasing O2 concentration in bloodDIntroducing CO in blood - Question 1 - Select One
Haemoblobin is a Fe containing protein responsible for oxygen transport in the blood. The curves given below idicate the percentage suturation of haemoglobin by O2 as a funcion of partial pressure of O2.
Which of the following statement/s is/are correct for the given curves?
I. In presence of CO2, higher PO2 is needed for a given percentage saturation.
II. In presence of CO2, lower PO2 is needed for a give percentage saturation.
III. The maximum percentgae saturation is not affected by the presence of CO2
IV. In the absence of CO2, maximum saturation of haemoglobin occurs at lower pO2.
 AIa nd IVBII and IVCI,III and IVDII and III
 - Question 1 - Select One
What will be the change in graph depicting percentage saturation of oxyhaemoglobin and pO2 (mm of Hg) with increase in H+ concentration in blood ?
AGraph shifts to rightBGraph shift to leftCNo changeDAll of these - Question 1 - Select One
Assertion: The respiratory activity in cell maturation phase as compared to other phases is less.
\ Reason: If total growth is plotted against time, the curve obtained is known as S-shaped curve.AIf both Assertion and Reason are true and the Reason is a correct explanation of the Assertion.BIf both Assertion and Reason are true but the Reason is not a correct explanation of the Assertion.CIf Assertion is true but the Reason is false.DIf both Assertion and Reason are false. - Question 1 - Select One
If we plot the parameter of growth against time the curve obtained is known as,
AT-shaped curveBU-shaped curveCG-shaped curveDS-shaped curve. - Question 1 - Select One
When the product of pressure and volume is plotted against pressure for a given amount of gas, the line obtained is
Aparallel to x-axisBparallel to y-axisClinear with positive slopeDlinear with negative slope - Question 1 - Select One
Affinity of CO for haemoglobin as compared to O2 is
ATwo timesBTwenty timesC100 timesD200 times - Question 1 - Select One
Affinity of CO for haemoglobin as compared to O2 is
A2 timesB20 timesC100 timesD200 times - Question 1 - Select One
The reaction of O2 and CO with haemoglobin gives
Aonly oxygen - haeme complexBonly CO-haeme complexCboth but oxygen - haeme complex is more stableDboth but CO-haeme complex is more stable.

