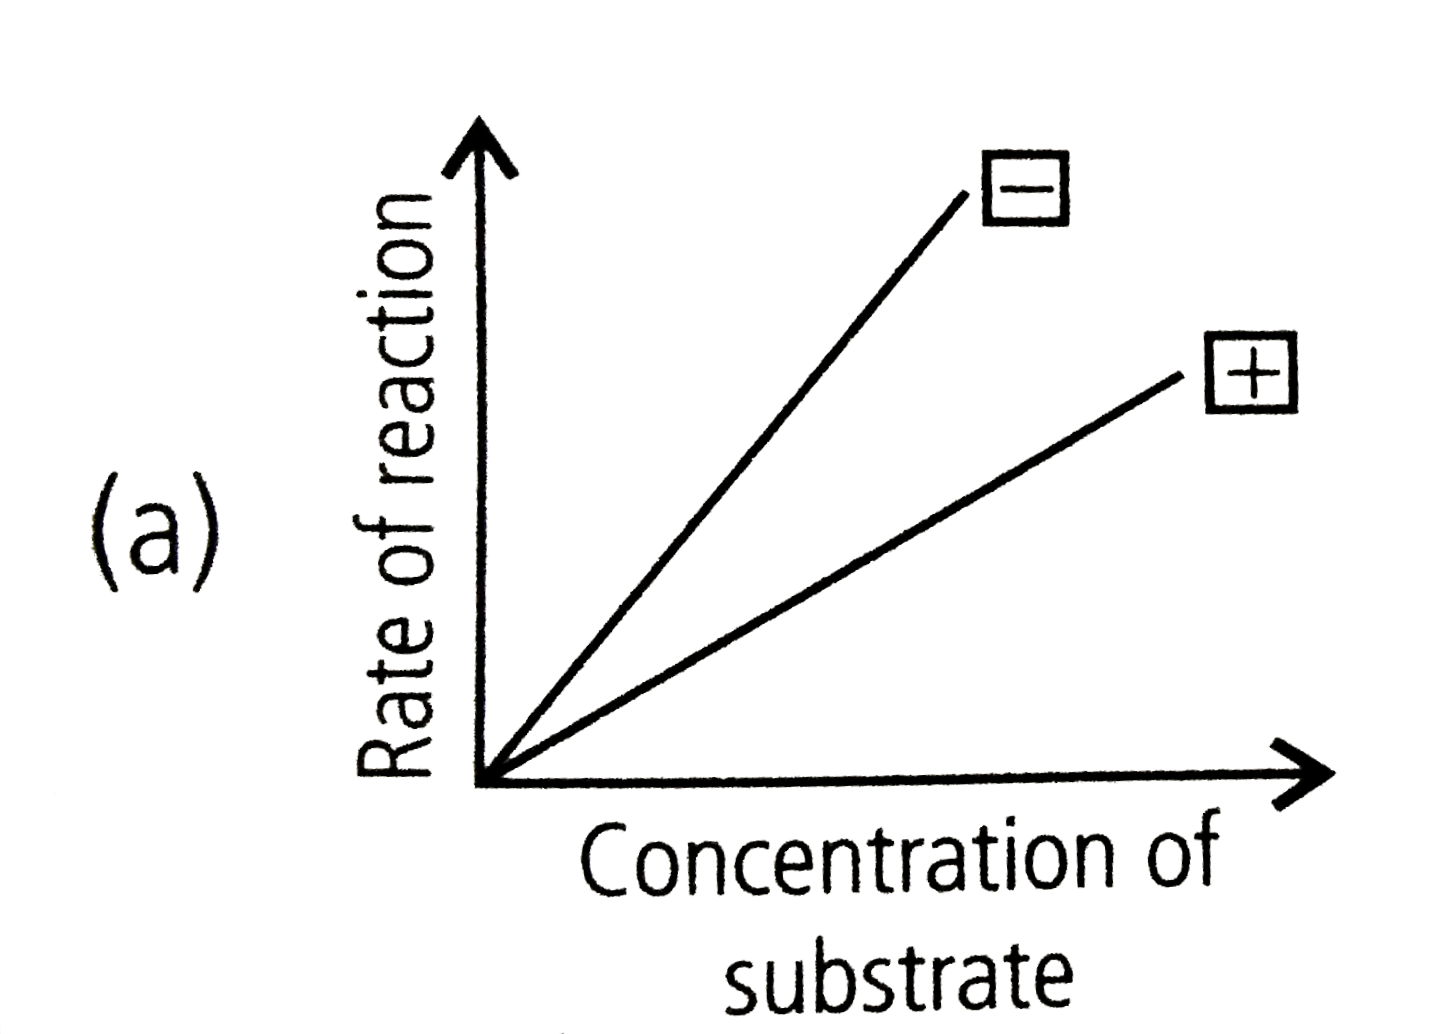
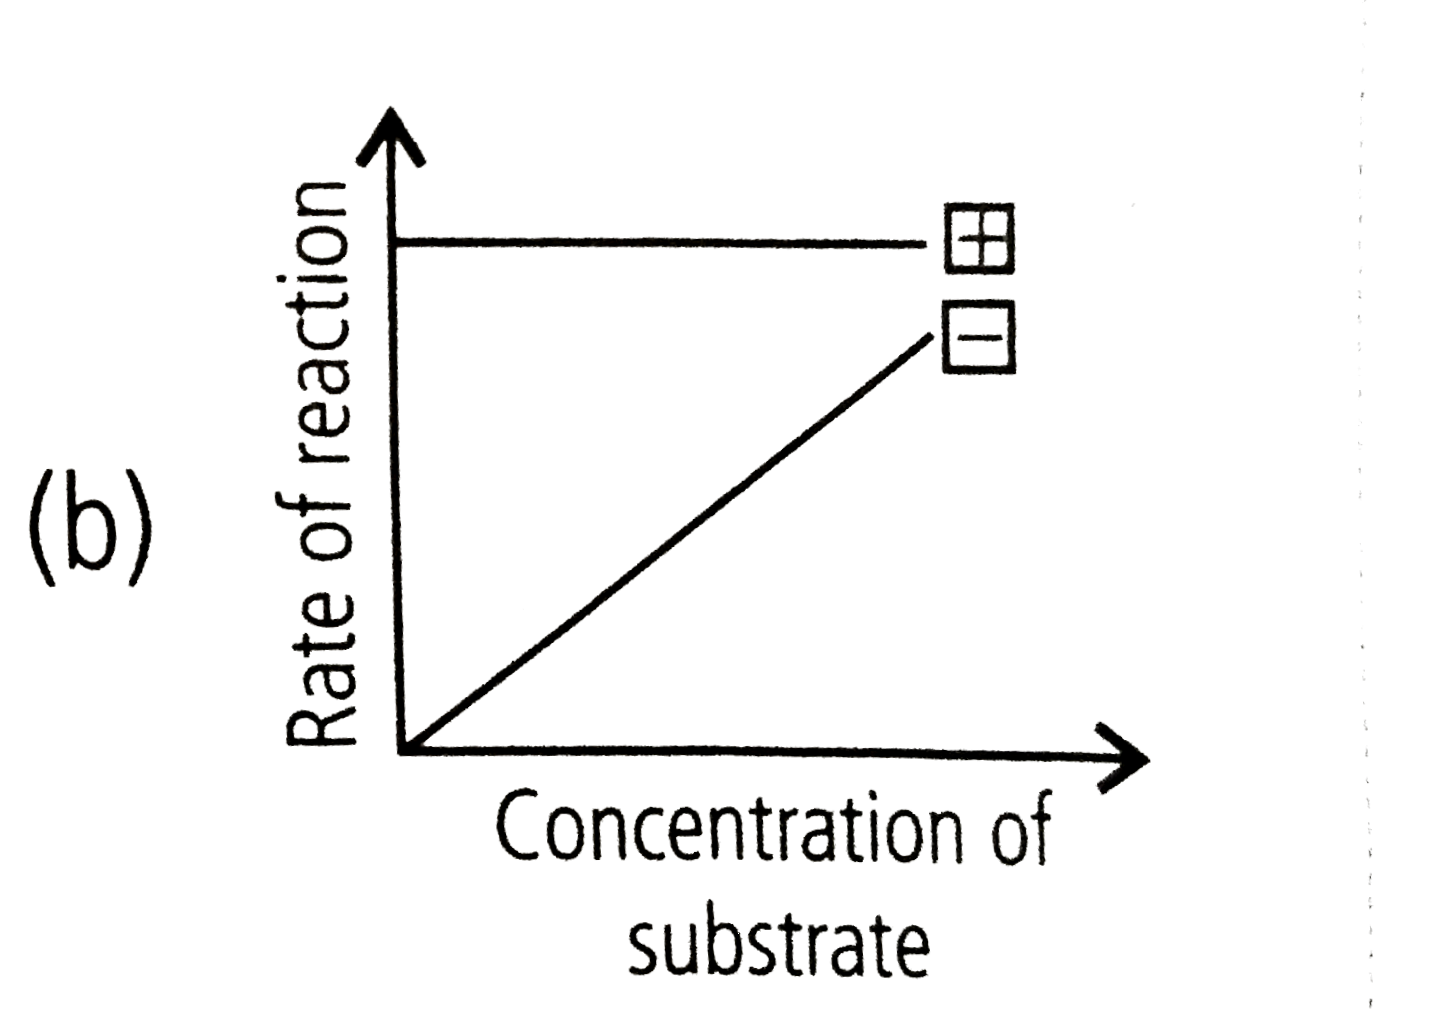
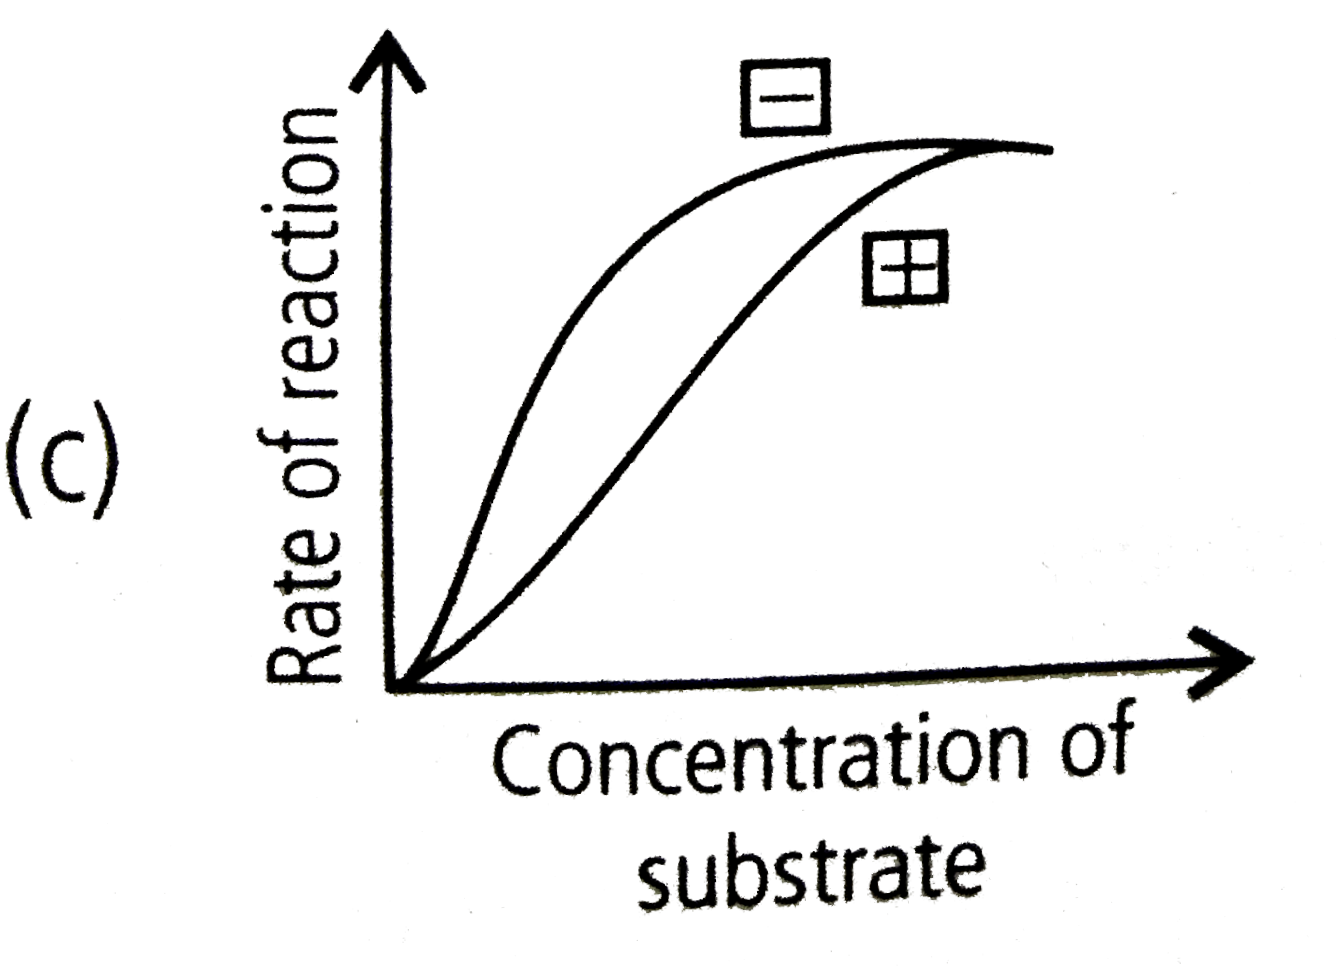
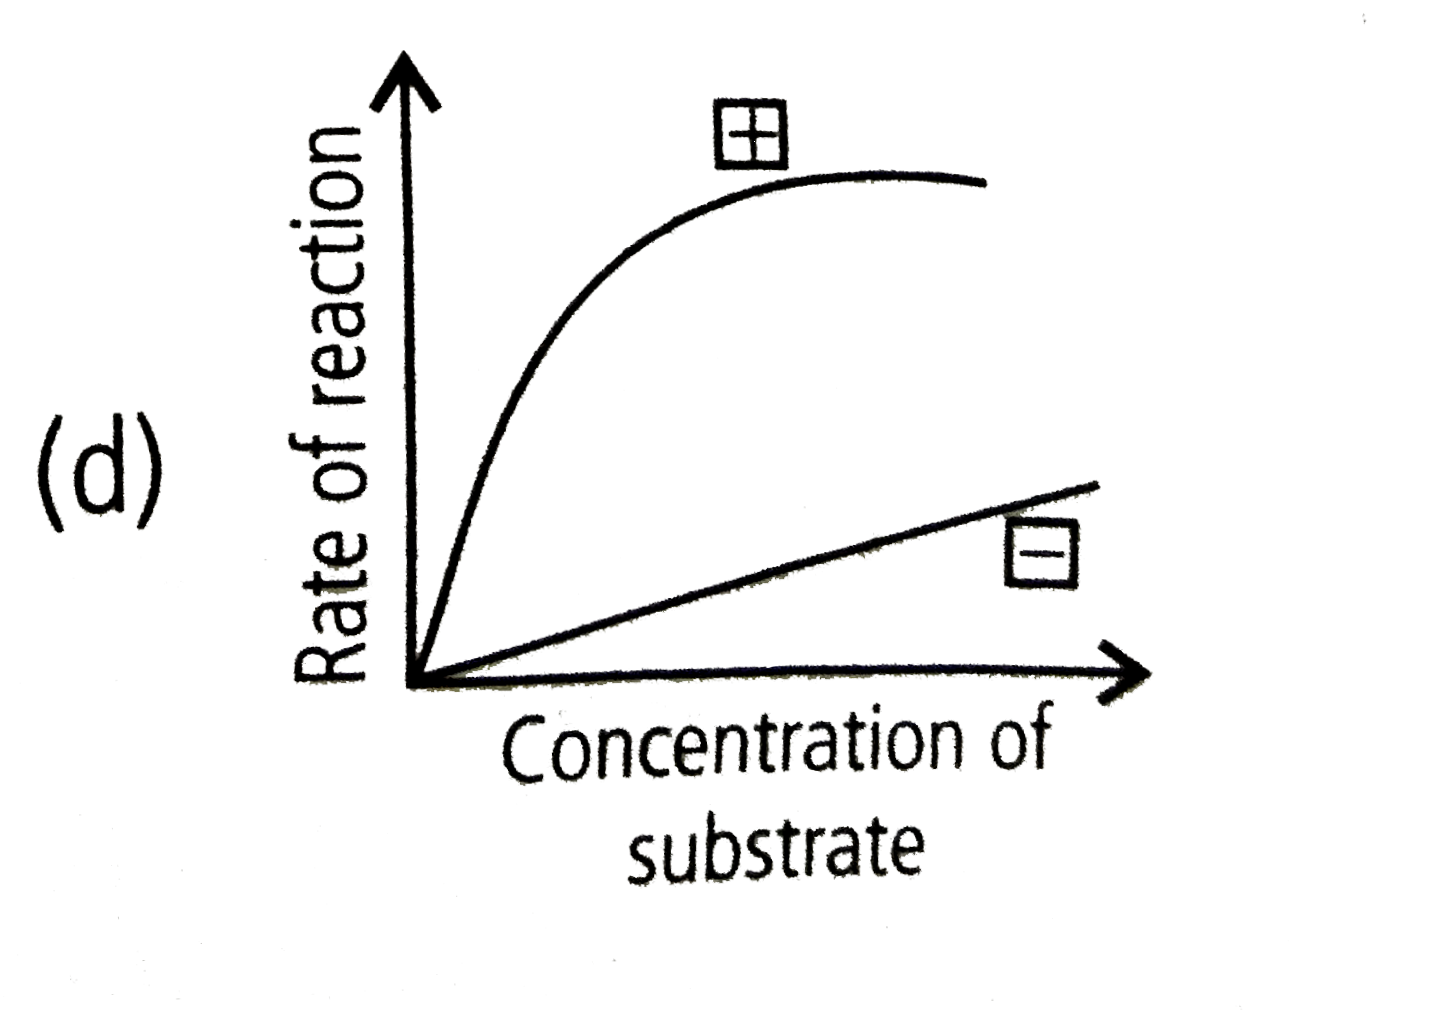
Which of the following graphs correctly indicates the reaction in presence (indicated bt +) and absence (indicated as -) of an enzyme ?


The correct Answer is:D
To determine which graph correctly indicates the reaction in the presence and absence of an enzyme, we can follow these steps:
1. Understand the Variables:
- The y-axis represents the rate of reaction.
- The x-axis represents the concentration of substrate.
2. Graph for Enzyme Presence (+):
- When an enzyme is present, it lowers the activation energy required for the reaction to occur.
- This results in a higher rate of reaction at a given substrate concentration.
- The graph will show an initial increase in the rate of reaction as substrate concentration increases, eventually leveling off when the enzyme becomes saturated (i.e., all active sites are occupied). This is typically a hyperbolic curve.
3. Graph for Enzyme Absence (-):
- In the absence of an enzyme, the reaction will still occur, but at a slower rate due to higher activation energy.
- The graph will show a gradual increase in the rate of reaction as substrate concentration increases, but it will not plateau as quickly as in the presence of an enzyme. This is often represented as a curve that rises more slowly and may appear exponential.
4. Identify the Correct Graph:
- Compare the provided graphs with the characteristics described above.
- Look for a graph that shows a steep increase in rate with the presence of the enzyme and a more gradual increase in rate without the enzyme.
5. Conclusion:
- After analyzing the graphs based on the behavior of reactions with and without enzymes, you can conclude that the correct graph is the one that fits the described characteristics for both conditions.
Final Answer:
The correct answer is the third option.
---
- The y-axis represents the rate of reaction.
- The x-axis represents the concentration of substrate.
- When an enzyme is present, it lowers the activation energy required for the reaction to occur.
- This results in a higher rate of reaction at a given substrate concentration.
- The graph will show an initial increase in the rate of reaction as substrate concentration increases, eventually leveling off when the enzyme becomes saturated (i.e., all active sites are occupied). This is typically a hyperbolic curve.
- In the absence of an enzyme, the reaction will still occur, but at a slower rate due to higher activation energy.
- The graph will show a gradual increase in the rate of reaction as substrate concentration increases, but it will not plateau as quickly as in the presence of an enzyme. This is often represented as a curve that rises more slowly and may appear exponential.
- Compare the provided graphs with the characteristics described above.
- Look for a graph that shows a steep increase in rate with the presence of the enzyme and a more gradual increase in rate without the enzyme.
- After analyzing the graphs based on the behavior of reactions with and without enzymes, you can conclude that the correct graph is the one that fits the described characteristics for both conditions.
The correct answer is the third option.
Topper's Solved these Questions
- BIOMOLECULESBOOK - NCERT FINGERTPS ENGLISHCHAPTER - BIOMOLECULESEXERCISE - Biomolecules
137 Videos
- BIOLOGICAL CLASSIFICATIONBOOK - NCERT FINGERTPS ENGLISHCHAPTER - BIOLOGICAL CLASSIFICATIONEXERCISE - Biological Classification
132 Videos
- BODY FLUIDS AND CIRCULATIONBOOK - NCERT FINGERTPS ENGLISHCHAPTER - BODY FLUIDS AND CIRCULATIONEXERCISE - Body Fluids And Circulation
151 Videos
Similar Questions
Knowledge Check
Which of the following acts as a self-indicator ?
AK2Cr2O7BKMnO4COxalicacDIodineWhich of the following are the indicators of pollution?
ALichensBFungiCAlgaeDNone of these
Which one of the following in birds, indicated their reptilian ancestry
View SolutionWhich one of the following in birds, indicated their reptilian ancestry
View SolutionWhich of the following symptoms indicate radiation sickness ?
View SolutionWhich of the following represents the incoorect order of the properties indicated?
View SolutionWhich of the following is indicated by the magnetic quantum number ?
View SolutionWhich one indicates the hypertension ?
View Solution
