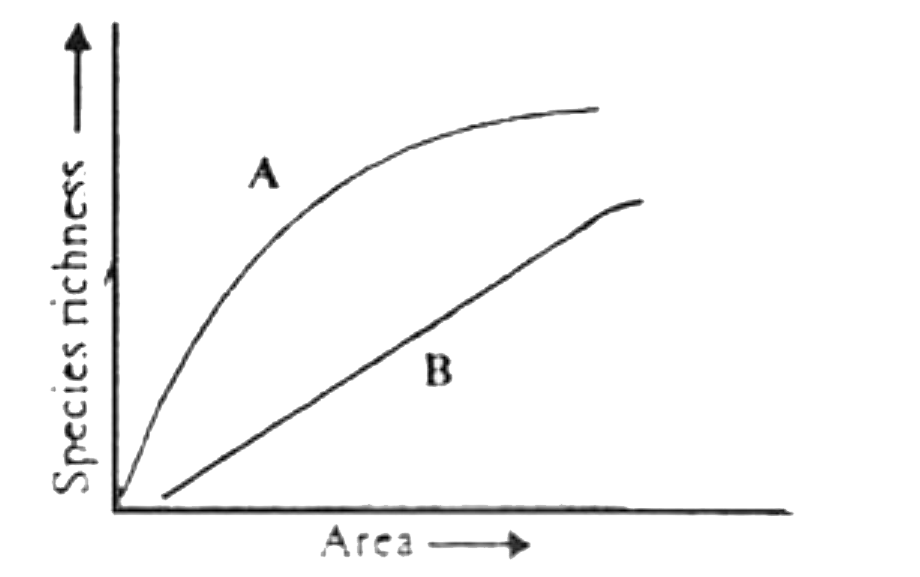
Which option correctly describes the equation for curves A and B, in the given graph of species - area relationship ?

A
B
C
D
Video Solution
Text Solution
The correct Answer is:A
|
Answer
Step by step video, text & image solution for Which option correctly describes the equation for curves A and B, in the given graph of species - area relationship ? by Biology experts to help you in doubts & scoring excellent marks in Class 12 exams.
Updated on:21/07/2023Topper's Solved these Questions
- BIODIVERSITY & CONSERVATIONBOOK - NCERT FINGERTPS ENGLISHCHAPTER - BIODIVERSITY & CONSERVATIONEXERCISE - HOTS
5 Videos
- BIODIVERSITY & CONSERVATIONBOOK - NCERT FINGERTPS ENGLISHCHAPTER - BIODIVERSITY & CONSERVATIONEXERCISE - NCERT (EXEMPLAR PROBLEMS
20 Videos
- BIOTECHNOLOGY - PRINCIPLES AND PROCESSESBOOK - NCERT FINGERTPS ENGLISHCHAPTER - BIOTECHNOLOGY - PRINCIPLES AND PROCESSESEXERCISE - Biotechnology - Principles And Processes
139 Videos
Similar Questions
Knowledge Check
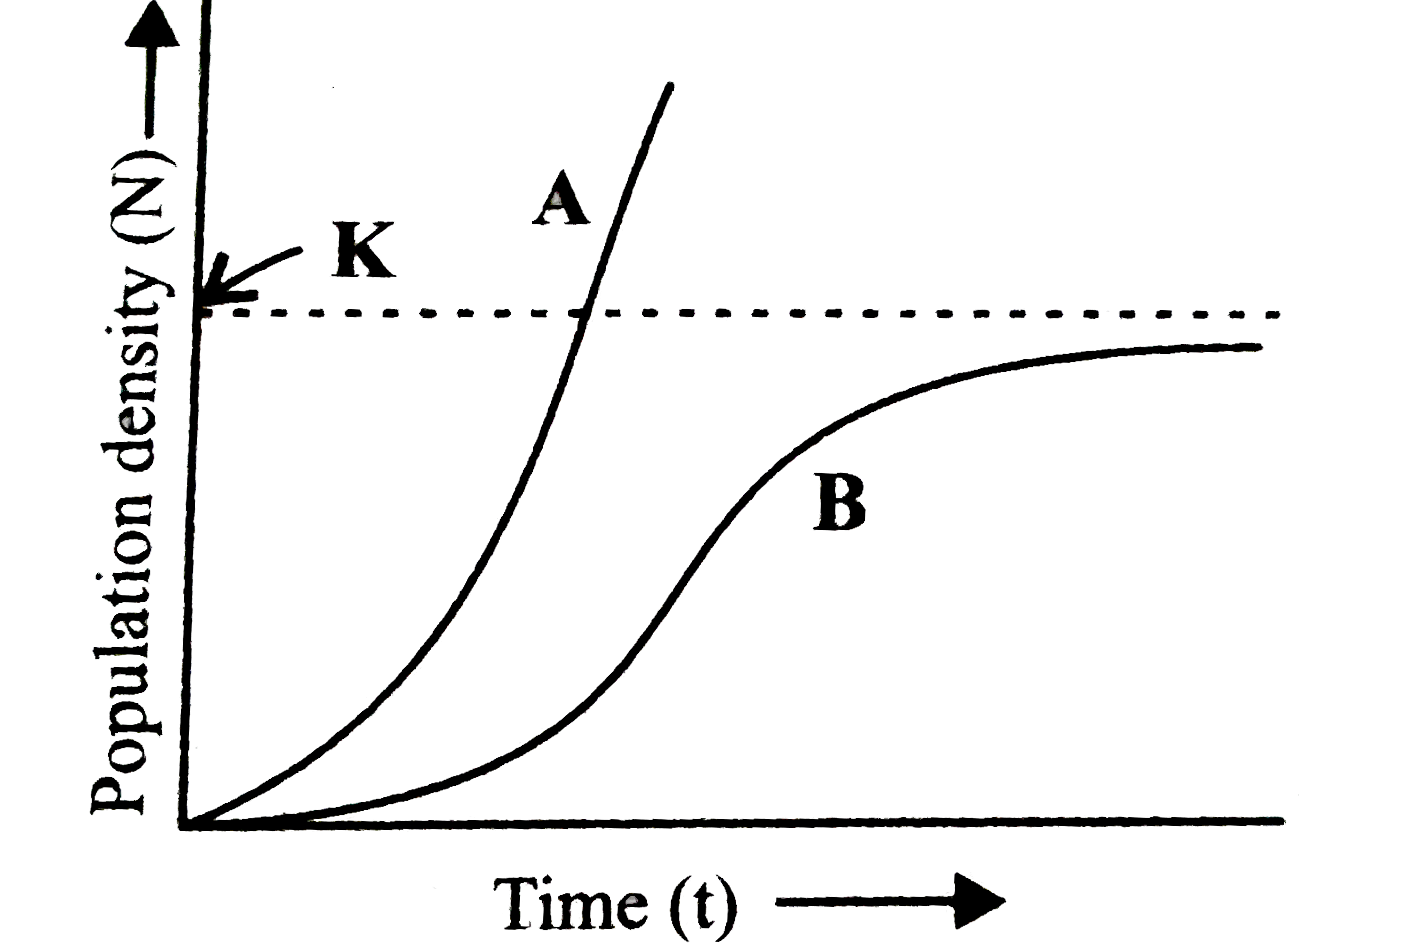
Study the population growth curves (A and B) in the given graph and select the incorrect option.
 ACurve 'A' shows exponential growth, represented by equation dNdt=rN.BCurve 'B' shows logistic growth, represented by equation dNdt=rN(K−NK)CExponential growth curve is considered as more realistic than the logistic growth curve.DCurve 'A' can also be represented by equation Nt=N0ert.
Which of the following correctly describes the location of the organ of Corti?
ABetween the tympanic membrane and the oval window in the inner earBIn the utricle and saccule within the vestibuleCBetween the tectorial membrane and the basilar membrane in the cochlear canalDBetween the outer and inner ear within the semicircular canals
Species area relationship was given by :-
View SolutionSelect the option which correctly describes the function of given hormones.
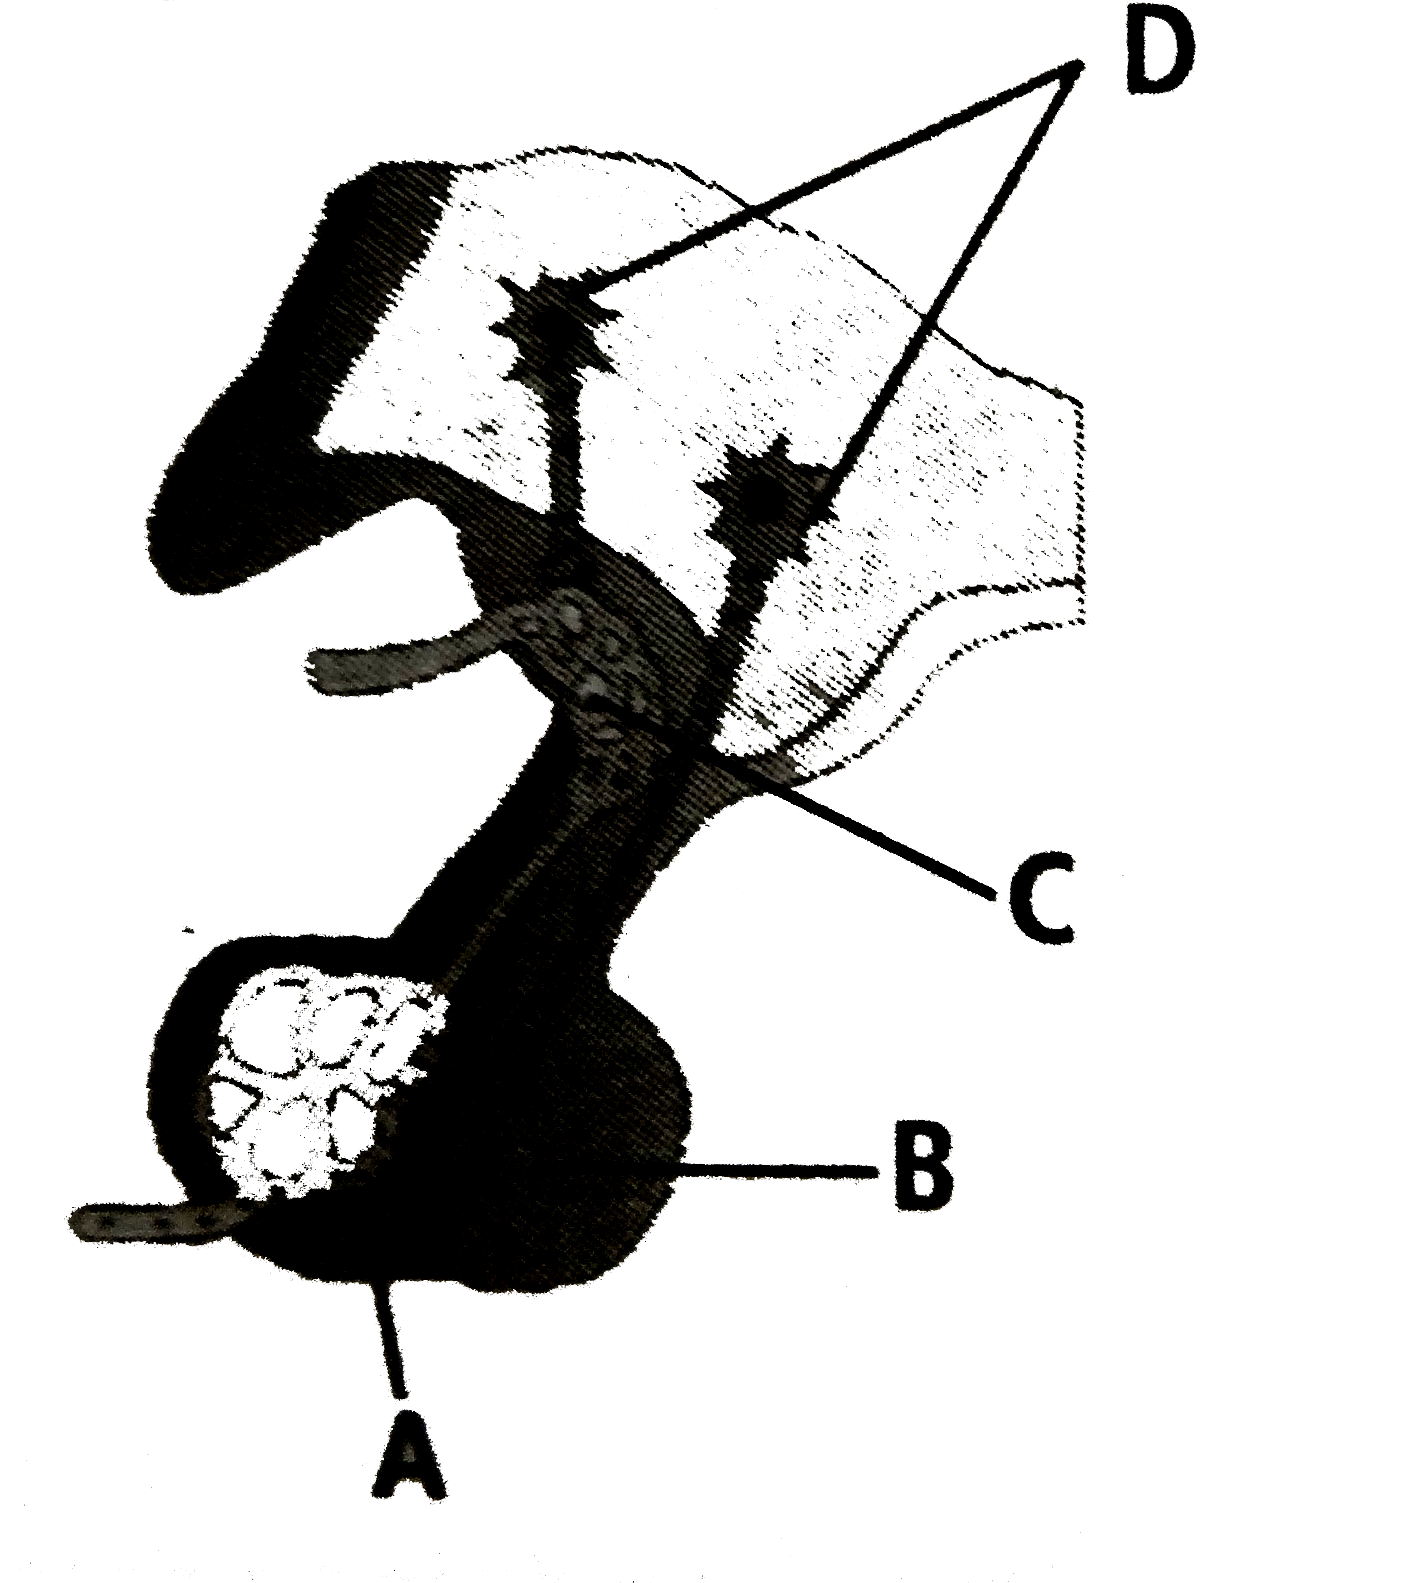
View SolutionSelect the option that correctly identifies the labels A,B, C and D in the given diagram.

View SolutionWhich if these correctly describes the valves of the heart?
View SolutionWhich of the following correctly describes the functions of FSH in females?
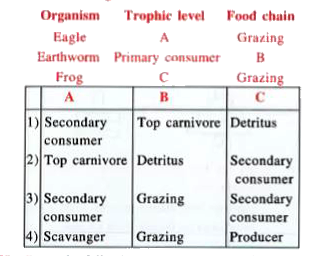
View SolutionSelect the option that correctly identifies A, B and C in the given table.

View Solution
