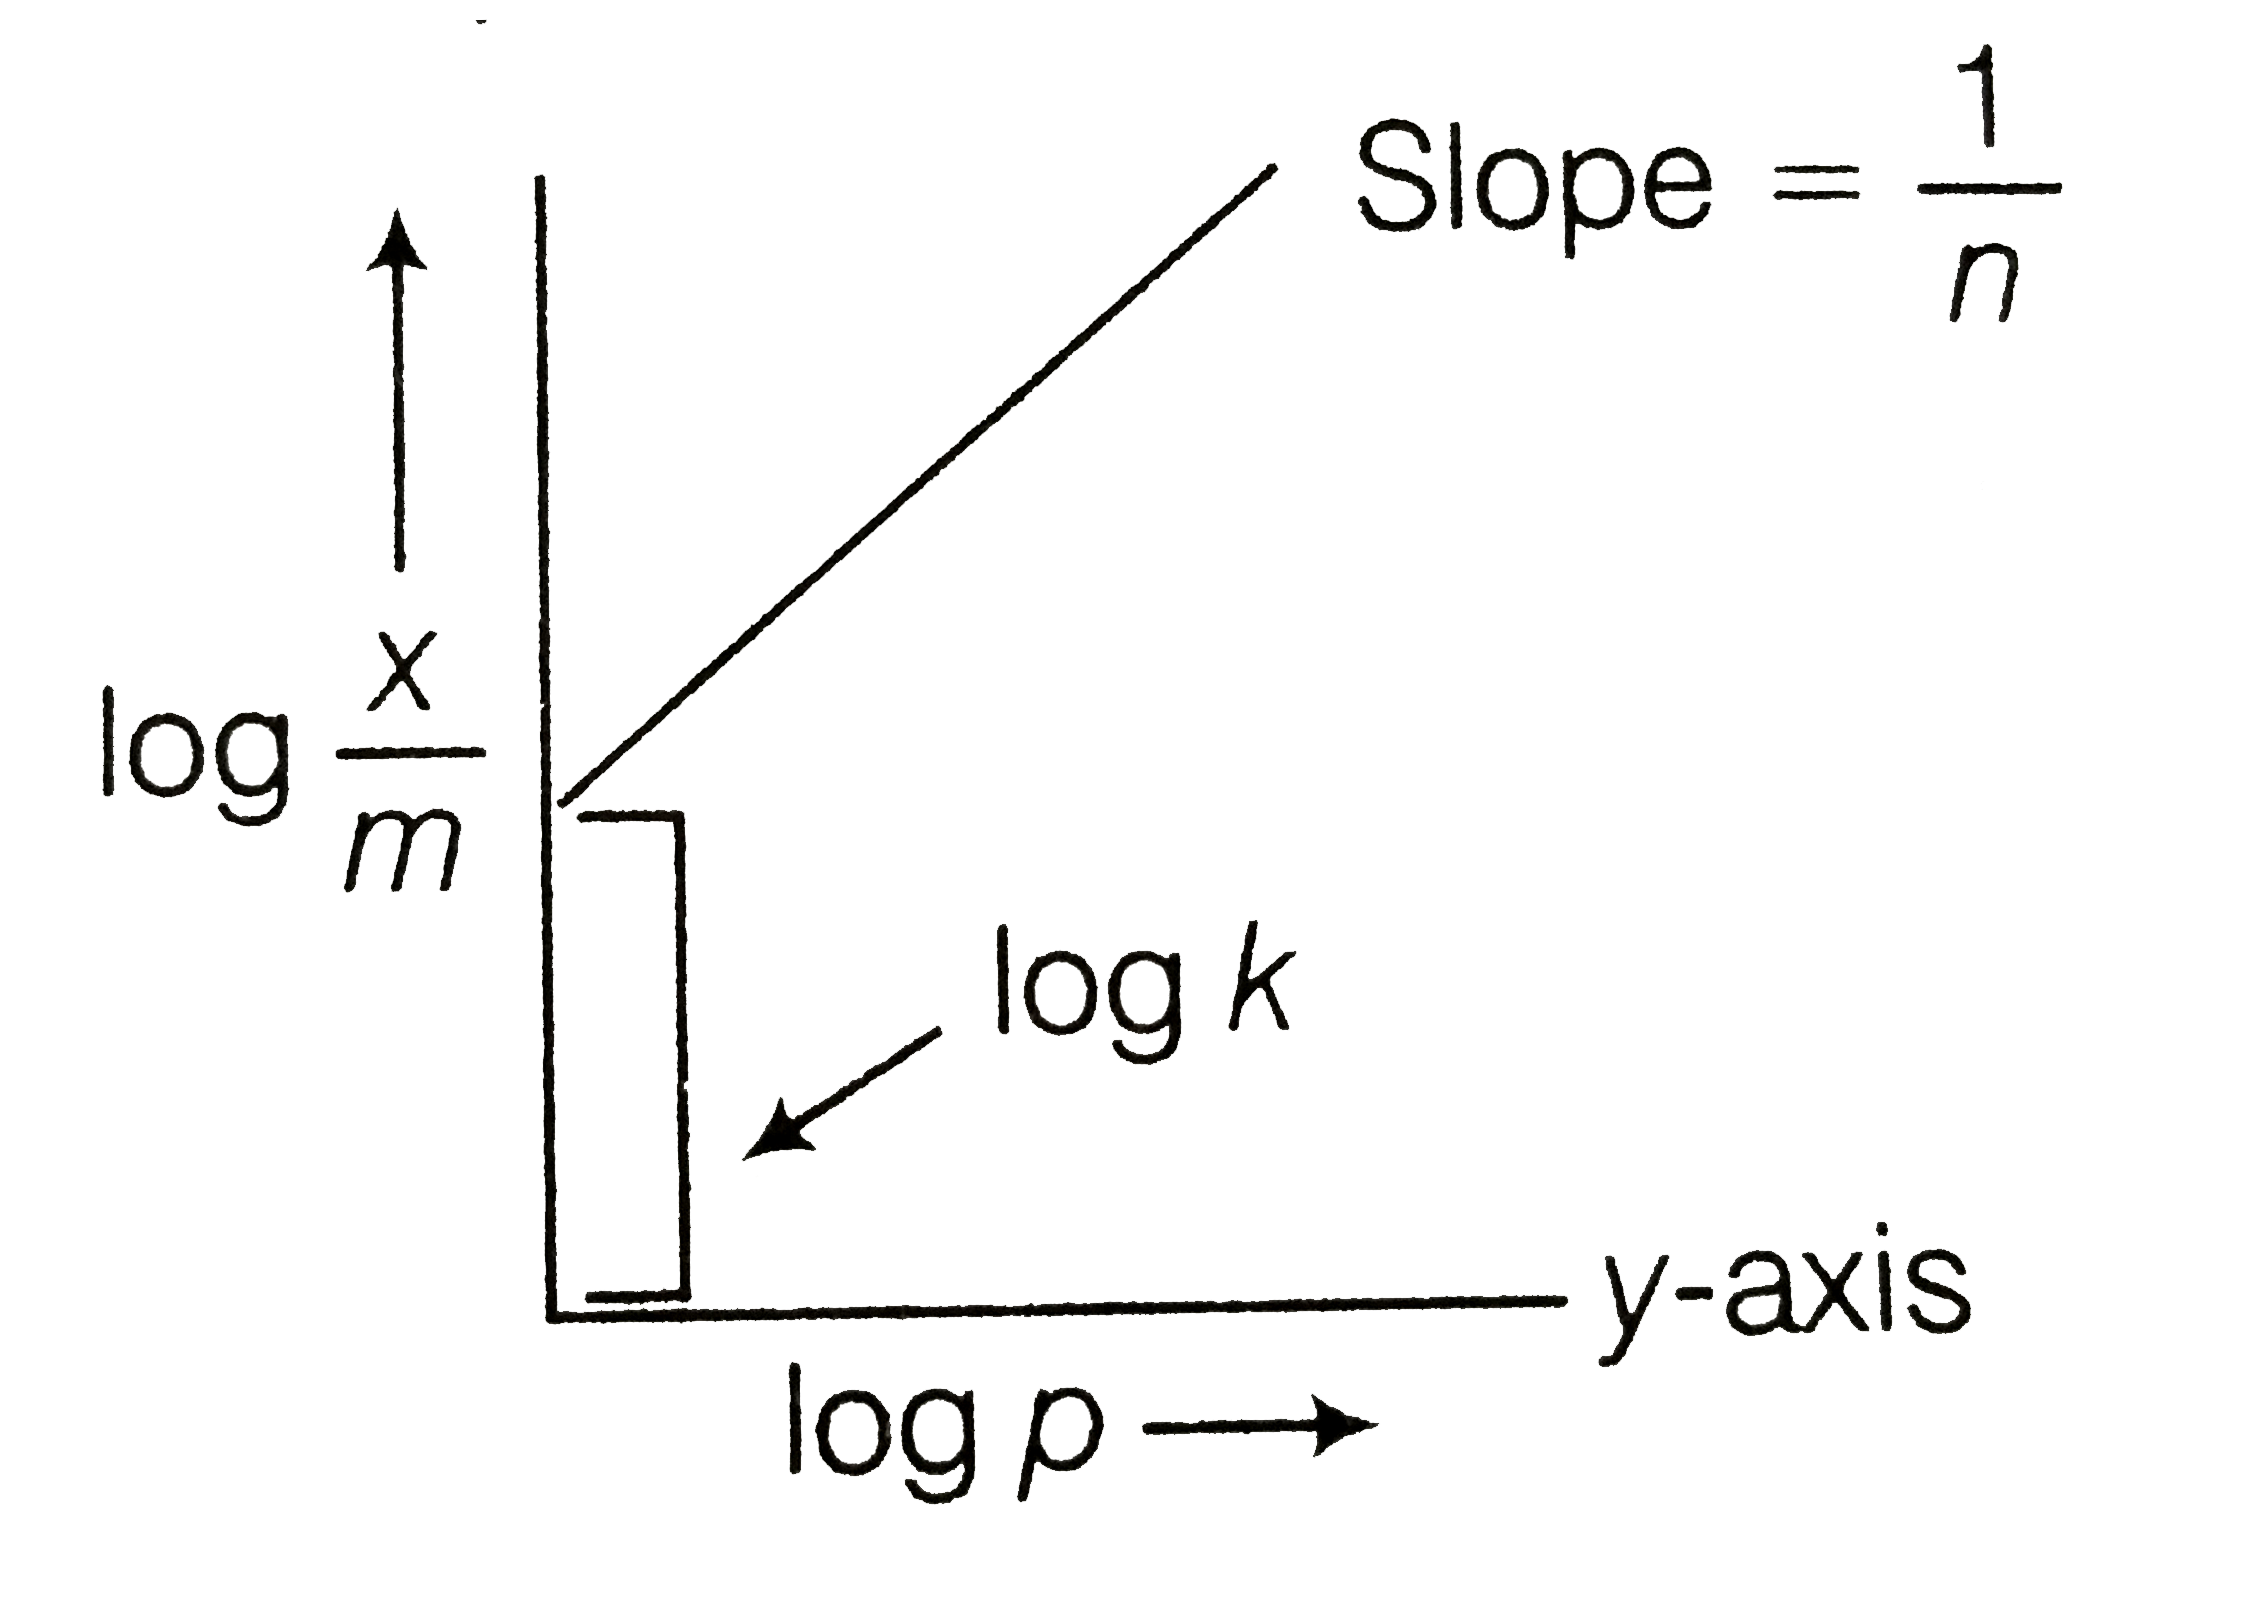
A plot of log x/m versus log p for the adsorption of a gas on a solid gives a straight line with slope equal to:
A
−logk
B
n
C
1n
D
logk
Video Solution
Text Solution
The correct Answer is:C
In a graph between log x/m against slope equal to 1/n and cordinate intercept equal to log k is obtained.

|
Topper's Solved these Questions
Similar Questions
Knowledge Check
A plot of x/m versus log p for the adsorption of a gas on a solid gives a straight line with slope equal to
A1/nBlog kC−logkDn.A plt of log Xm vs. log P for the adsorption of a gasd on a solid gives a straight line with slope equal to :
A1/nBlnKC−logKDnA plot of log (x/m) versus log p for the adsorption of a gas on the surface of a solid gives a straight line which slope equal to :
Alog KB−logKCnD1n
For the adsorption of a gas on a solid, the plot of log(x/m) versus log p is linear with slope equal to
View SolutionFor a first order reaction the plot of ‘t’ against log c gives a straight line with a slope equal to :
View SolutionFor a first order reaction the plot of ‘t’ against log c gives a straight line with a slope equal to :
View SolutionFor a first order reaction the plot of ‘t’ against log c gives a straight line with a slope equal to :
View SolutionAdsorption of a gas on a surface follows Freundlich adsorption isotherm. Plot of log xm versus log P gives a straight line with slope equal to 0.5, then :
(xm is the mass of the gas adsorbed per gram of adsorbent)
View Solution
