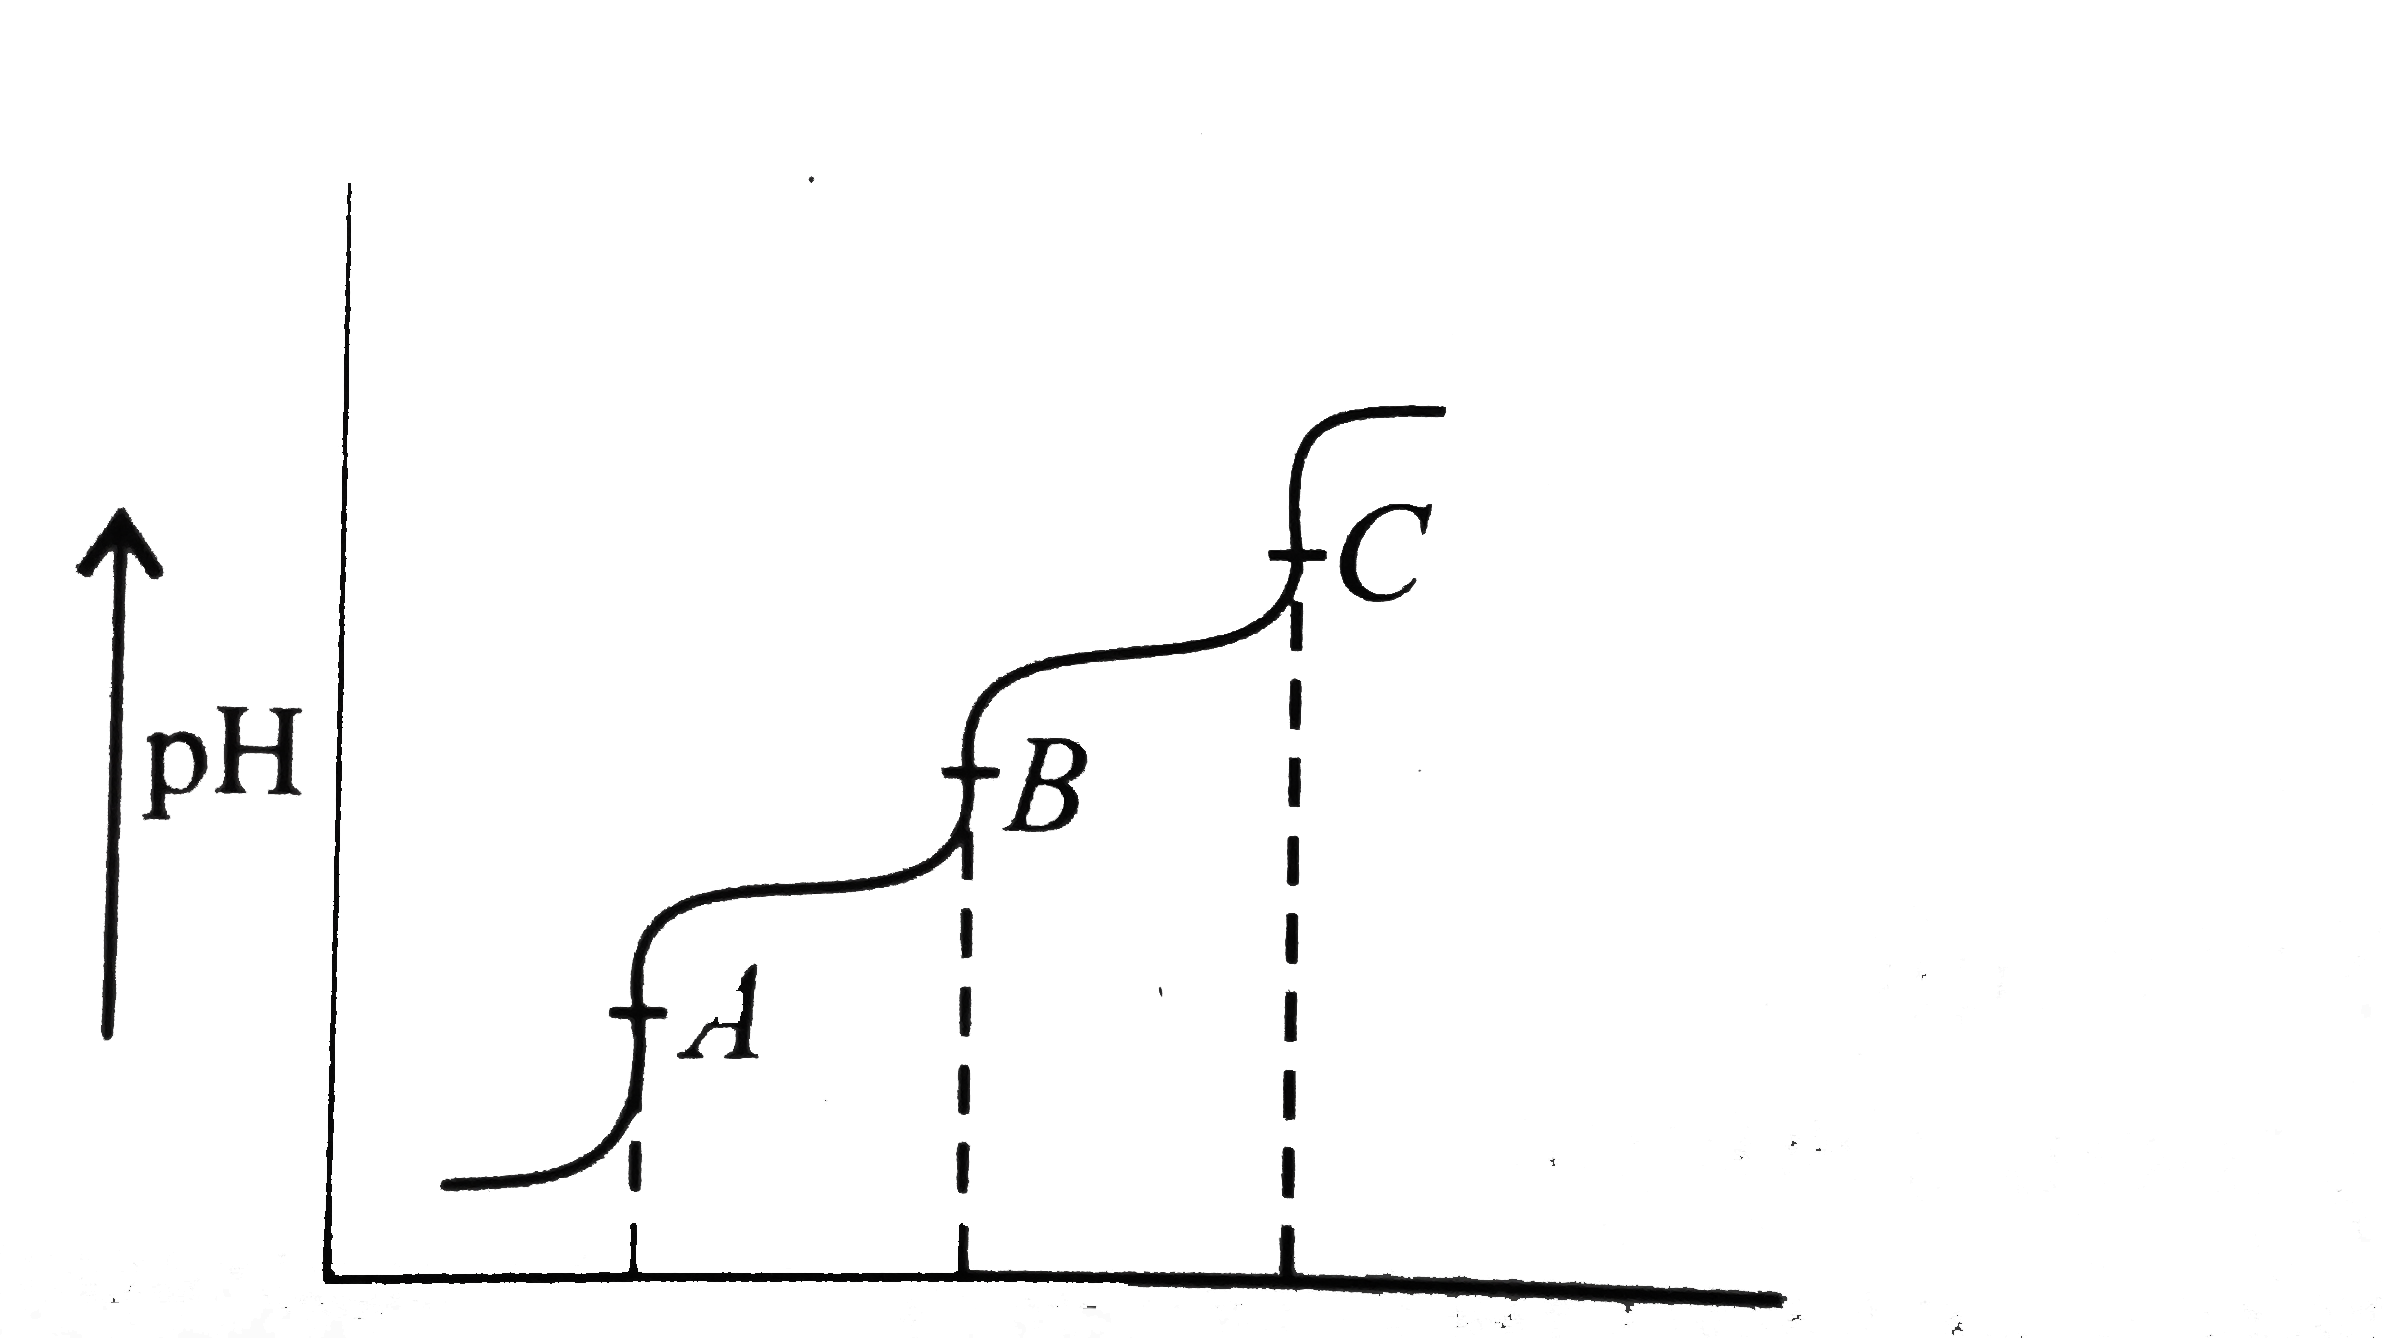
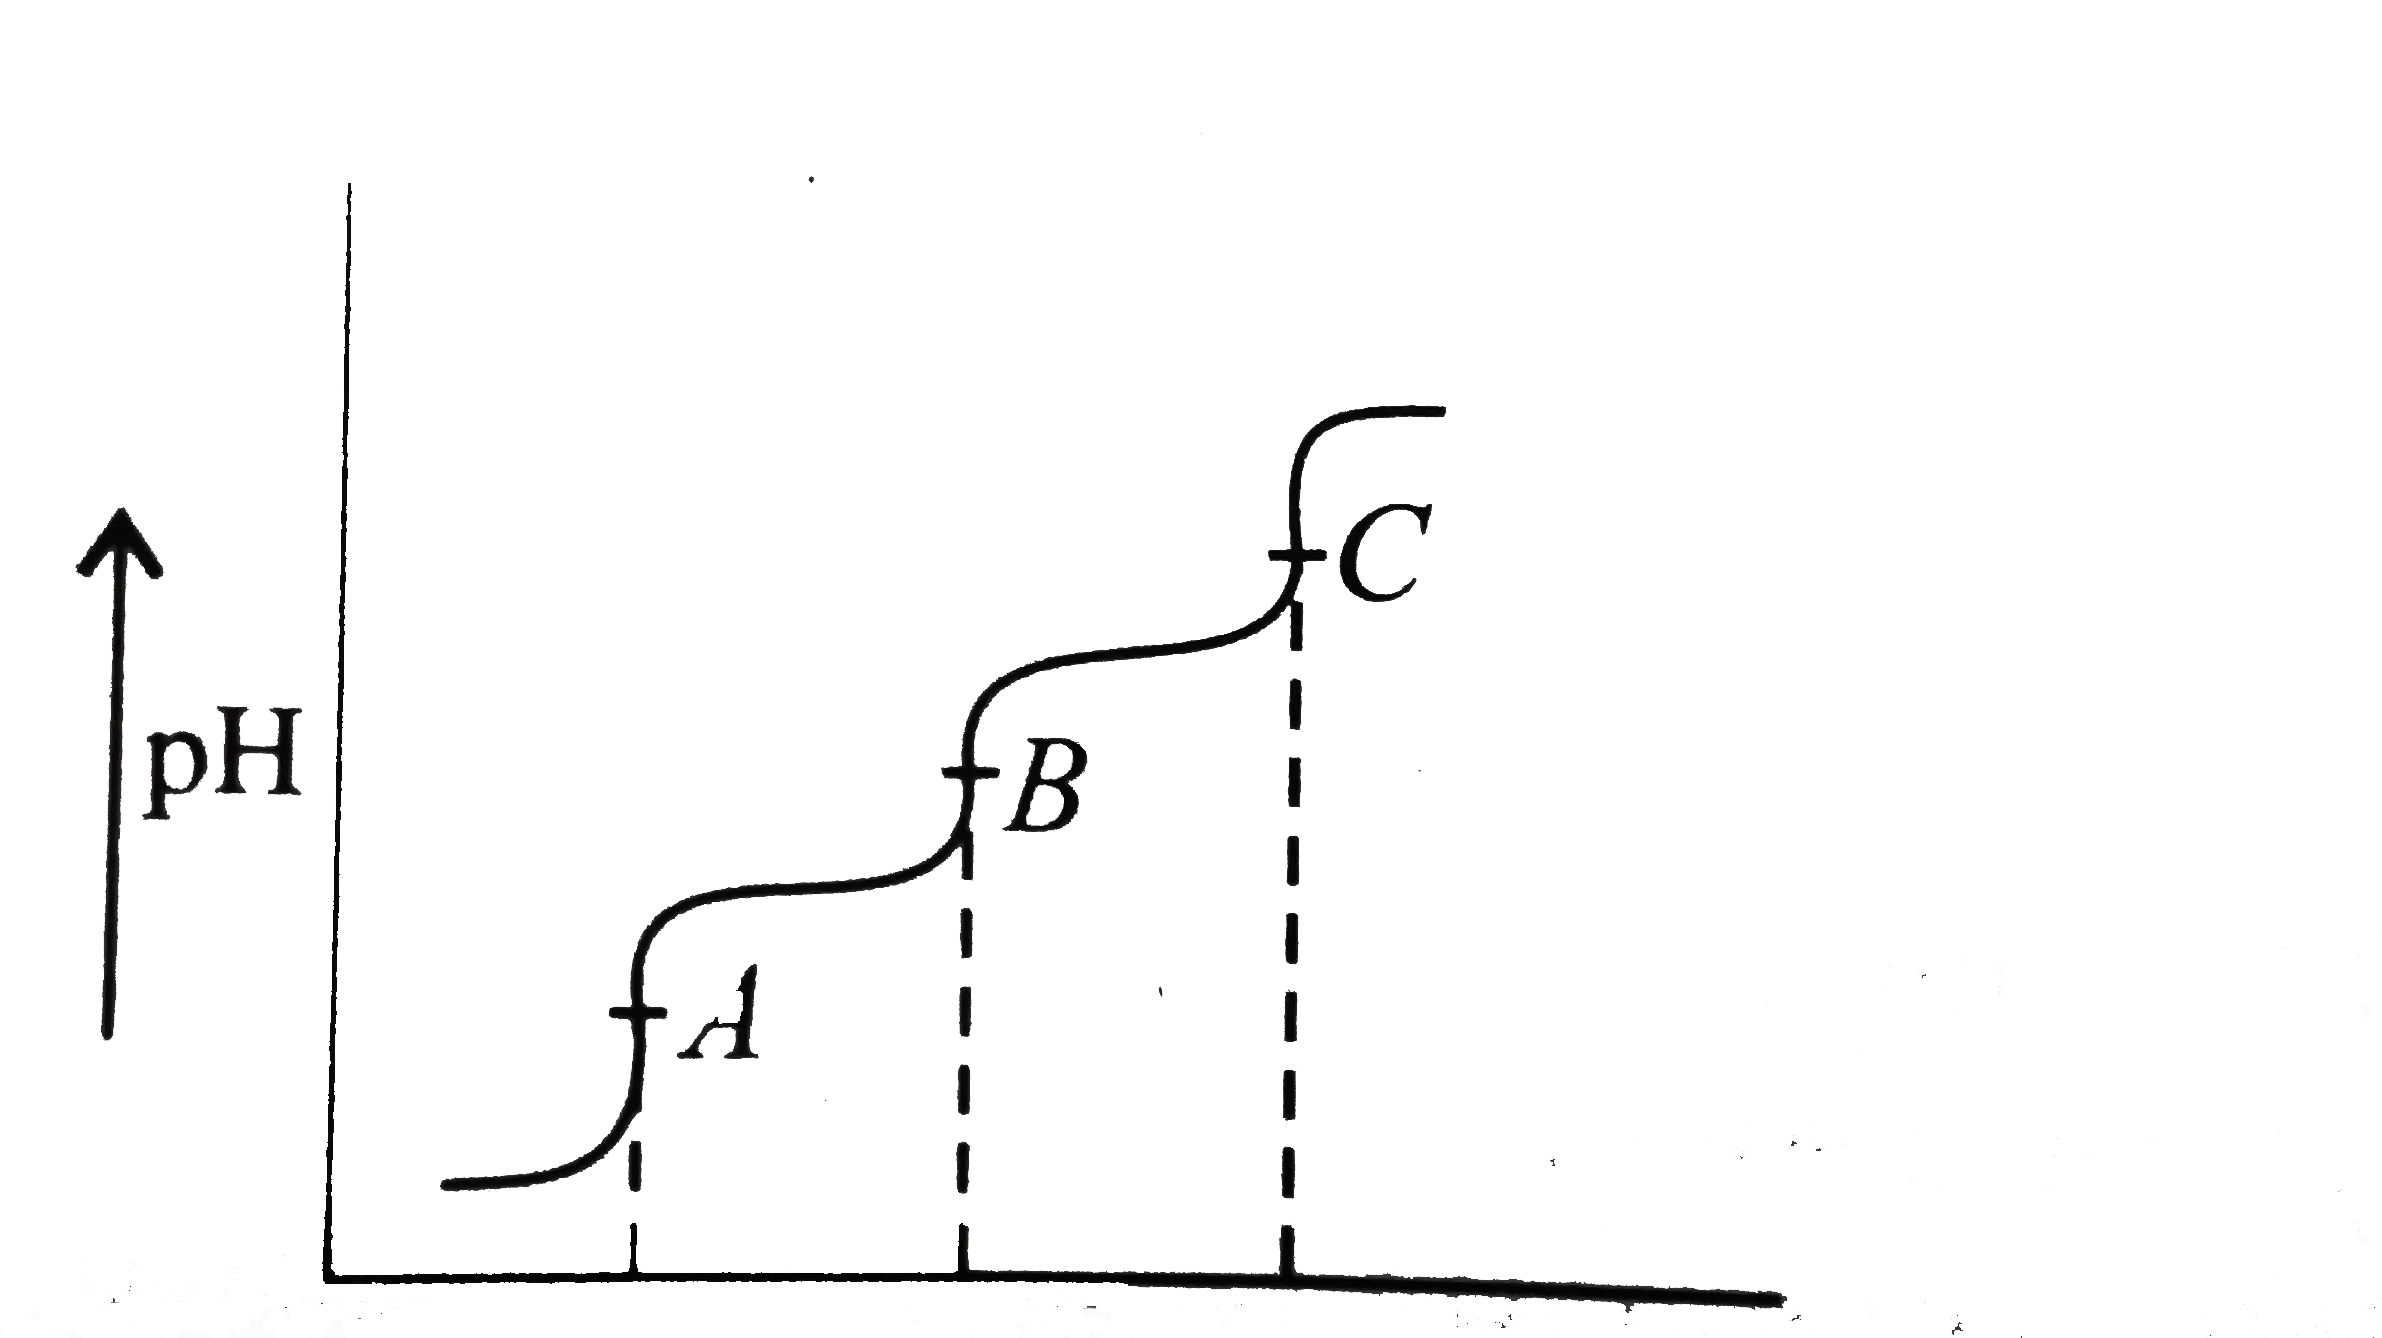
Acidic solution is defined as a solution whose [H⊕]>[ΘOH]. Base solution has [ΘOH]>[H⊕]. During acid-base titrations, pH of the mixture will change depending on the amount base added. This variation is shown in the form of graph by making plot as titration curves 100mL of 1.0MH3A(Ka1=10−3,Ka2=10−5,Ka3=10−7) is titrated against 0.1MNaOh. The titration curve is as follows.
![Acidic solution is defined as a solution whose [H^(o+)] gt [overset(Theta)OH]. Base solution has [overset(Theta)OH] gt [H^(o+)]. During acid-base titrations, pH of the mixture will change depending on the amount base added. This variation is shown in the form of graph by making plot as titration curves 100mL of 1.0 M H(3)A (K(a(1)) = 10^(-3), K(a(2)) = 10^(-5), K(a(3)) = 10^(-7)) is titrated against 0.1M NaOh. The titration curve is as follows. What is the pH at point A?](https://d10lpgp6xz60nq.cloudfront.net/physics_images/V_PHY_CHM_P1_C08_E01_176_Q01.png)
What is the pH at point A?
3
4
5
6
The correct Answer is:B
Since Ka1 and Ka2 are high values therfore point A,Ka1 and Ka2 are considered.
H3A⇔H⊕+H2AΘ
H2AΘ⇔H⊕+HA2−
Ka1×Ka2=[H⊕][HA2−][H2A][At equivalence point[HA2−]=[H3A]]
−logKa1−logKa2=−2log[H⊕]
pKa1+pKa2=2pH.
∴pH=pKa1+pKa22=3+52=4
Topper's Solved these Questions
- BOOK - CENGAGE CHEMISTRYCHAPTER - IONIC EQUILIBRIUMEXERCISE - Exercises Multiple Correct33videos
IONIC EQUILIBRIUM
- BOOK - CENGAGE CHEMISTRYCHAPTER - IONIC EQUILIBRIUMEXERCISE - Exercises Single Correct121videos
IONIC EQUILIBRIUM
- BOOK - CENGAGE CHEMISTRYCHAPTER - IONIC EQUILIBRIUMEXERCISE - Exercises Subjective(Coordination Equilibria)2videos
IONIC EQUILIBRIUM
- BOOK - CENGAGE CHEMISTRYCHAPTER - HYDROGEN, WATER AND HYDROGEN PEROXIDEEXERCISE - Subjective Archive (Subjective)3videos
HYDROGEN, WATER AND HYDROGEN PEROXIDE
- BOOK - CENGAGE CHEMISTRYCHAPTER - ISOMERISMEXERCISE - Assertion-Reasoning Type1videos
ISOMERISM
Similar Questions
Knowledge Check
- Question 1 - Select One
Acidic solution is defined as a solution whose [H⊕]>[ΘOH]. Base solution has [ΘOH]>[H⊕]. During acid-base titrations, pH of the mixture will change depending on the amount base added. This variation is shown in the form of graph by making plot as titration curves 100mL of 1.0MH3A(Ka1=10−3,Ka2=10−5,Ka3=10−7) is titrated against 0.1MNaOh. The titration curve is as follows.

What would be the pH is more of NaH2A is added to the titration mixture at point C ?A11.0B10.2C9.7D7.7 - Question 2 - Select One
Acidic solution is defined as a solution whose [H⊕]>[ΘOH]. Base solution has [ΘOH]>[H⊕]. During acid-base titrations, pH of the mixture will change depending on the amount base added. This variation is shown in the form of graph by making plot as titration curves 100mL of 1.0MH3A(Ka1=10−3,Ka2=10−5,Ka3=10−7) is titrated against 0.1MNaOh. The titration curve is as follows.

What will be the change in pH from point B to point C?A2.8B3.2C4.6D0.94 - Question 3 - Select One
Ratio of [HA+] in 1L of 0.1MH3A solution [Ka1=10−5,Ka2=10−8Ka3=10−11]& upon addition of 0.1mole HCl to it will be :
A10B100C1000D10,000
Calculate the changes in pH of 0.1MNaHA solution after diluting it to ten times the original volume.(Given that for H3A:Ka1=10−4,Ka2=10−7,Ka3=10−11)
View SolutionEqual volume of 0.1MH2CO3(Ka1=10−7,Ka2=10−11) and 0.1MH2S(Ka1=10−7,Ka2=10−14) are mixed together. Calculate value of pOH−pH for resulting solution.
View SolutionThe pH of the a solution containing 0.4MHCO−3 is :
[Ka1(H2CO3)=4×10⁻⁷,Ka2(HCO−3)=4×10⁻¹¹]View SolutionH∈ is an acidic indicator (KInd=10−7) which dissociates into aqueous acidic solution of 30mL of 0.05MH3PO4(K1=10−3,K2=10−7,K3=10−13)
Calculate the [IndΘH∈]View Solution0.03 M aqueous solution of a weak monobasic acid solution (Ka=10−12) is titrated against a 0.01MNaOH solution. What is the [H+] at the end point?
View Solution

