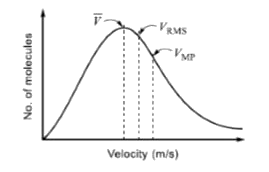
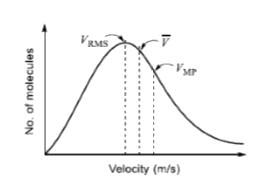
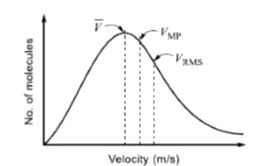
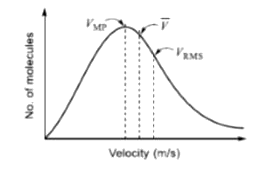
Among the following , the plot that shows the correct marking of most probable velocity average velocity and root mean square velocity ) is :


To solve the question about the correct marking of most probable velocity (V_MP), average velocity (V_avg), and root mean square velocity (V_RMS), we need to understand the relationships between these three types of velocities in the context of kinetic theory of gases.
1. Understand the Definitions:
- Most Probable Velocity (V_MP): This is the velocity of the molecules that is most likely to be found in a gas. It is given by the formula:
VMP=√2RTM
- Average Velocity (V_avg): This is the mean velocity of all the molecules in the gas. It is given by the formula:
Vavg=√8RTπM
- Root Mean Square Velocity (V_RMS): This is the square root of the average of the squares of the velocities of the molecules. It is given by the formula:
VRMS=√3RTM
2. Calculate the Ratios:
- To compare the velocities, we can express them in terms of a common factor, which is √RTM:
- VMP=√2⋅√RTM≈1.414⋅√RTM
- VRMS=√3⋅√RTM≈1.732⋅√RTM
- Vavg=√8π⋅√RTM≈1.596⋅√RTM
3. Order the Velocities:
- From the calculated values:
- VMP≈1.414
- Vavg≈1.596
- VRMS≈1.732
- Therefore, the order from lowest to highest is:
VMP<Vavg<VRMS
4. Identify the Correct Plot:
- Based on the order of velocities, we need to find the plot that correctly marks:
- V_MP (lowest)
- V_avg (middle)
- V_RMS (highest)
- According to the analysis, the correct option is D, where V_RMS is the highest, followed by V_avg, and V_MP is the lowest.
Conclusion:
The correct answer is Option D.
- Most Probable Velocity (V_MP): This is the velocity of the molecules that is most likely to be found in a gas. It is given by the formula:
VMP=√2RTM
- Average Velocity (V_avg): This is the mean velocity of all the molecules in the gas. It is given by the formula:
Vavg=√8RTπM
- Root Mean Square Velocity (V_RMS): This is the square root of the average of the squares of the velocities of the molecules. It is given by the formula:
VRMS=√3RTM
- To compare the velocities, we can express them in terms of a common factor, which is √RTM:
- VMP=√2⋅√RTM≈1.414⋅√RTM
- VRMS=√3⋅√RTM≈1.732⋅√RTM
- Vavg=√8π⋅√RTM≈1.596⋅√RTM
- From the calculated values:
- VMP≈1.414
- Vavg≈1.596
- VRMS≈1.732
- Therefore, the order from lowest to highest is:
VMP<Vavg<VRMS
- Based on the order of velocities, we need to find the plot that correctly marks:
- V_MP (lowest)
- V_avg (middle)
- V_RMS (highest)
- According to the analysis, the correct option is D, where V_RMS is the highest, followed by V_avg, and V_MP is the lowest.
The correct answer is Option D.
Topper's Solved these Questions
- KVPY 2021BOOK - KVPY PREVIOUS YEARCHAPTER - KVPY 2021EXERCISE - Part II Chemistry
5 Videos
- KVPY 2021BOOK - KVPY PREVIOUS YEARCHAPTER - KVPY 2021EXERCISE - PART-I Chemistry
20 Videos
- KVPYBOOK - KVPY PREVIOUS YEARCHAPTER - KVPYEXERCISE - exercise
14 Videos
- MOCK TEST 1BOOK - KVPY PREVIOUS YEARCHAPTER - MOCK TEST 1EXERCISE - EXERCISE
29 Videos
Similar Questions
Knowledge Check
The ratio of most probable velocity (α), average velocity (¯v), root mean square velocity (u) is
A√2:√8/π:√3B1:√2:√3C√2:√3:√8D1:√8π:√3The ratio of most probable velocity (α), average velocity (¯v), root mean square velocity (u) is
A√2:√8π:√3B1:√2:√3C√2:√3:√8D√1:√8π:√3The ratio of most probable velocity to that of average velocity is
A(π/2)B2/πC√π/2D2/√π
Most probable velocity, average velocity and root mean square velocity are related as
View SolutionThe ratio of most probable velocity to that of average velocity is
View SolutionThe ratio among most probable velocity, mean velocity and root mean velocity is given by
View SolutionThe ratio among most probable velocity, mean velocity and root mean velocity is given by
View SolutionThe ratio among most probable velocity, mean velocity and root mean velocity is given by
View Solution
