Comment and explain your observation obtained from the above graph.
Consider a situation wherein two hydrogen atoms (Ha and Hb) are separated by infininte distance . At this stage there is no interaction between these two atoms and the potential energy of this system is arbitrarily taken as zero . As these two atoms approach each other , in addition to the electrostatic attractive force between the nucleus and its own electron ( purple arrows), the following new forces begins to operate. The new attractive forces ( green arrows ) arise between
(i) Nucleus of Ha and valence electron of Hb
(ii) Nuclues of Hb and the valence electron of Ha.
The new repulsive forces (red arrows) arise between
(i) The nucleus of Ha and Hb
(ii) Valence electrons of Ha and Hb.
The attractive forces tend to bring Ha and Hb together whereas the repulsive forces tends to push them apart. At the initial stage , as the two hydrogen atoms approach each other, the attractive forces are stronger than the repulsive forces and the potential energy decreases.
A stage is reached where the net attractive forces are exactly balanced by repulsive forces and the potential energy of the system acquires a minimum energy.
At this stage , there is a a maximum overlap between the atomic orbitals of Ha and Hb , and the atoms Ha and Hb are now said to be bonded together by a covalent bond. The internuclear distance at this stage gives the H -H bond length and is equal to 74 pm. The liberated energy is 436 kJ mol− and is known as bond energy. Sincethe energy is releases during the bond formation , the resultant molecule is more stable. If the distance between the two atoms is decreased further, the repulsive forces dominate the attractive forces and the potential energy of the system sharply increases.
Topper's Solved these Questions
- CHEMICAL BONDINGBOOK - SURA PUBLICATIONCHAPTER - CHEMICAL BONDINGEXERCISE - CREATIVE QUESTIONS ( HOTS )
58 Videos
- CHEMICAL BONDINGBOOK - SURA PUBLICATIONCHAPTER - CHEMICAL BONDINGEXERCISE - Evaluate Yourself
16 Videos
- CHEMICAL BONDINGBOOK - SURA PUBLICATIONCHAPTER - CHEMICAL BONDINGEXERCISE - SHORT ANSWERS QUESTIONS :
22 Videos
- BASIC CONCEPTS OF ORGANIC REACTIONS BOOK - SURA PUBLICATIONCHAPTER - BASIC CONCEPTS OF ORGANIC REACTIONS EXERCISE - CREATIVE QUESTIONS [HOTS]
14 Videos
- ENVIRONMENTAL CHEMISTRY BOOK - SURA PUBLICATIONCHAPTER - ENVIRONMENTAL CHEMISTRY EXERCISE - 5 MARKS
1 Videos
Similar Questions
State the main implications of observations obtained from various photoelectric experiments. Can these implications be explained by wave nature of light? Justify your answer.
View SolutionIn an experiment of verification of Ohm's law, following observations are obtained.

Draw a V-I graph and use this graph to find :
the resistance in circuit.
View Solution
Knowledge Check
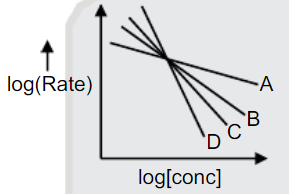
Following graph is obtained for four different reactions
On the basis of above graph, correct increasing order of reaction is AA>B>C>DBD>C>B>ACA>B>D>CDD>C>A>B
Comment of the similarity between the wing of a cockroach and the wing oi a bird. What do you infer from the above, with reference to evolution?
View SolutionComment of the similarity between the wing of a cockroach and the wing oi a bird. What do you infer from the above, with reference to evolution?
View SolutionFollowing graph is obtained for four different reactions
On the basis of above graph, correct increasing order of reaction is
View SolutionA balloon filled with helium gas floats in a big closed jar which is connected to an evacuating pump. What will be your observation, if air from jar is pumped out? Explain your answer.
View SolutionA student mixes sodium sulphate powder in barium chloride powder. What change would the student observe on mixing the two powders? Justify your answer and explain how he can obtain the desired change.
View SolutionA student mixes sodium sulphate powder in barium chloride powder. What change would the student observe on mixing the two powders? Justify your answer and explain how he can obtain the desired change.
View SolutionStudy the figure and answer the following

(a)Write your observations on the variations seen in the Darwin's finches shown above .
(b)How did Darwin explain the existance of different varietie of finches on Galapagos Islands ?
View Solution
