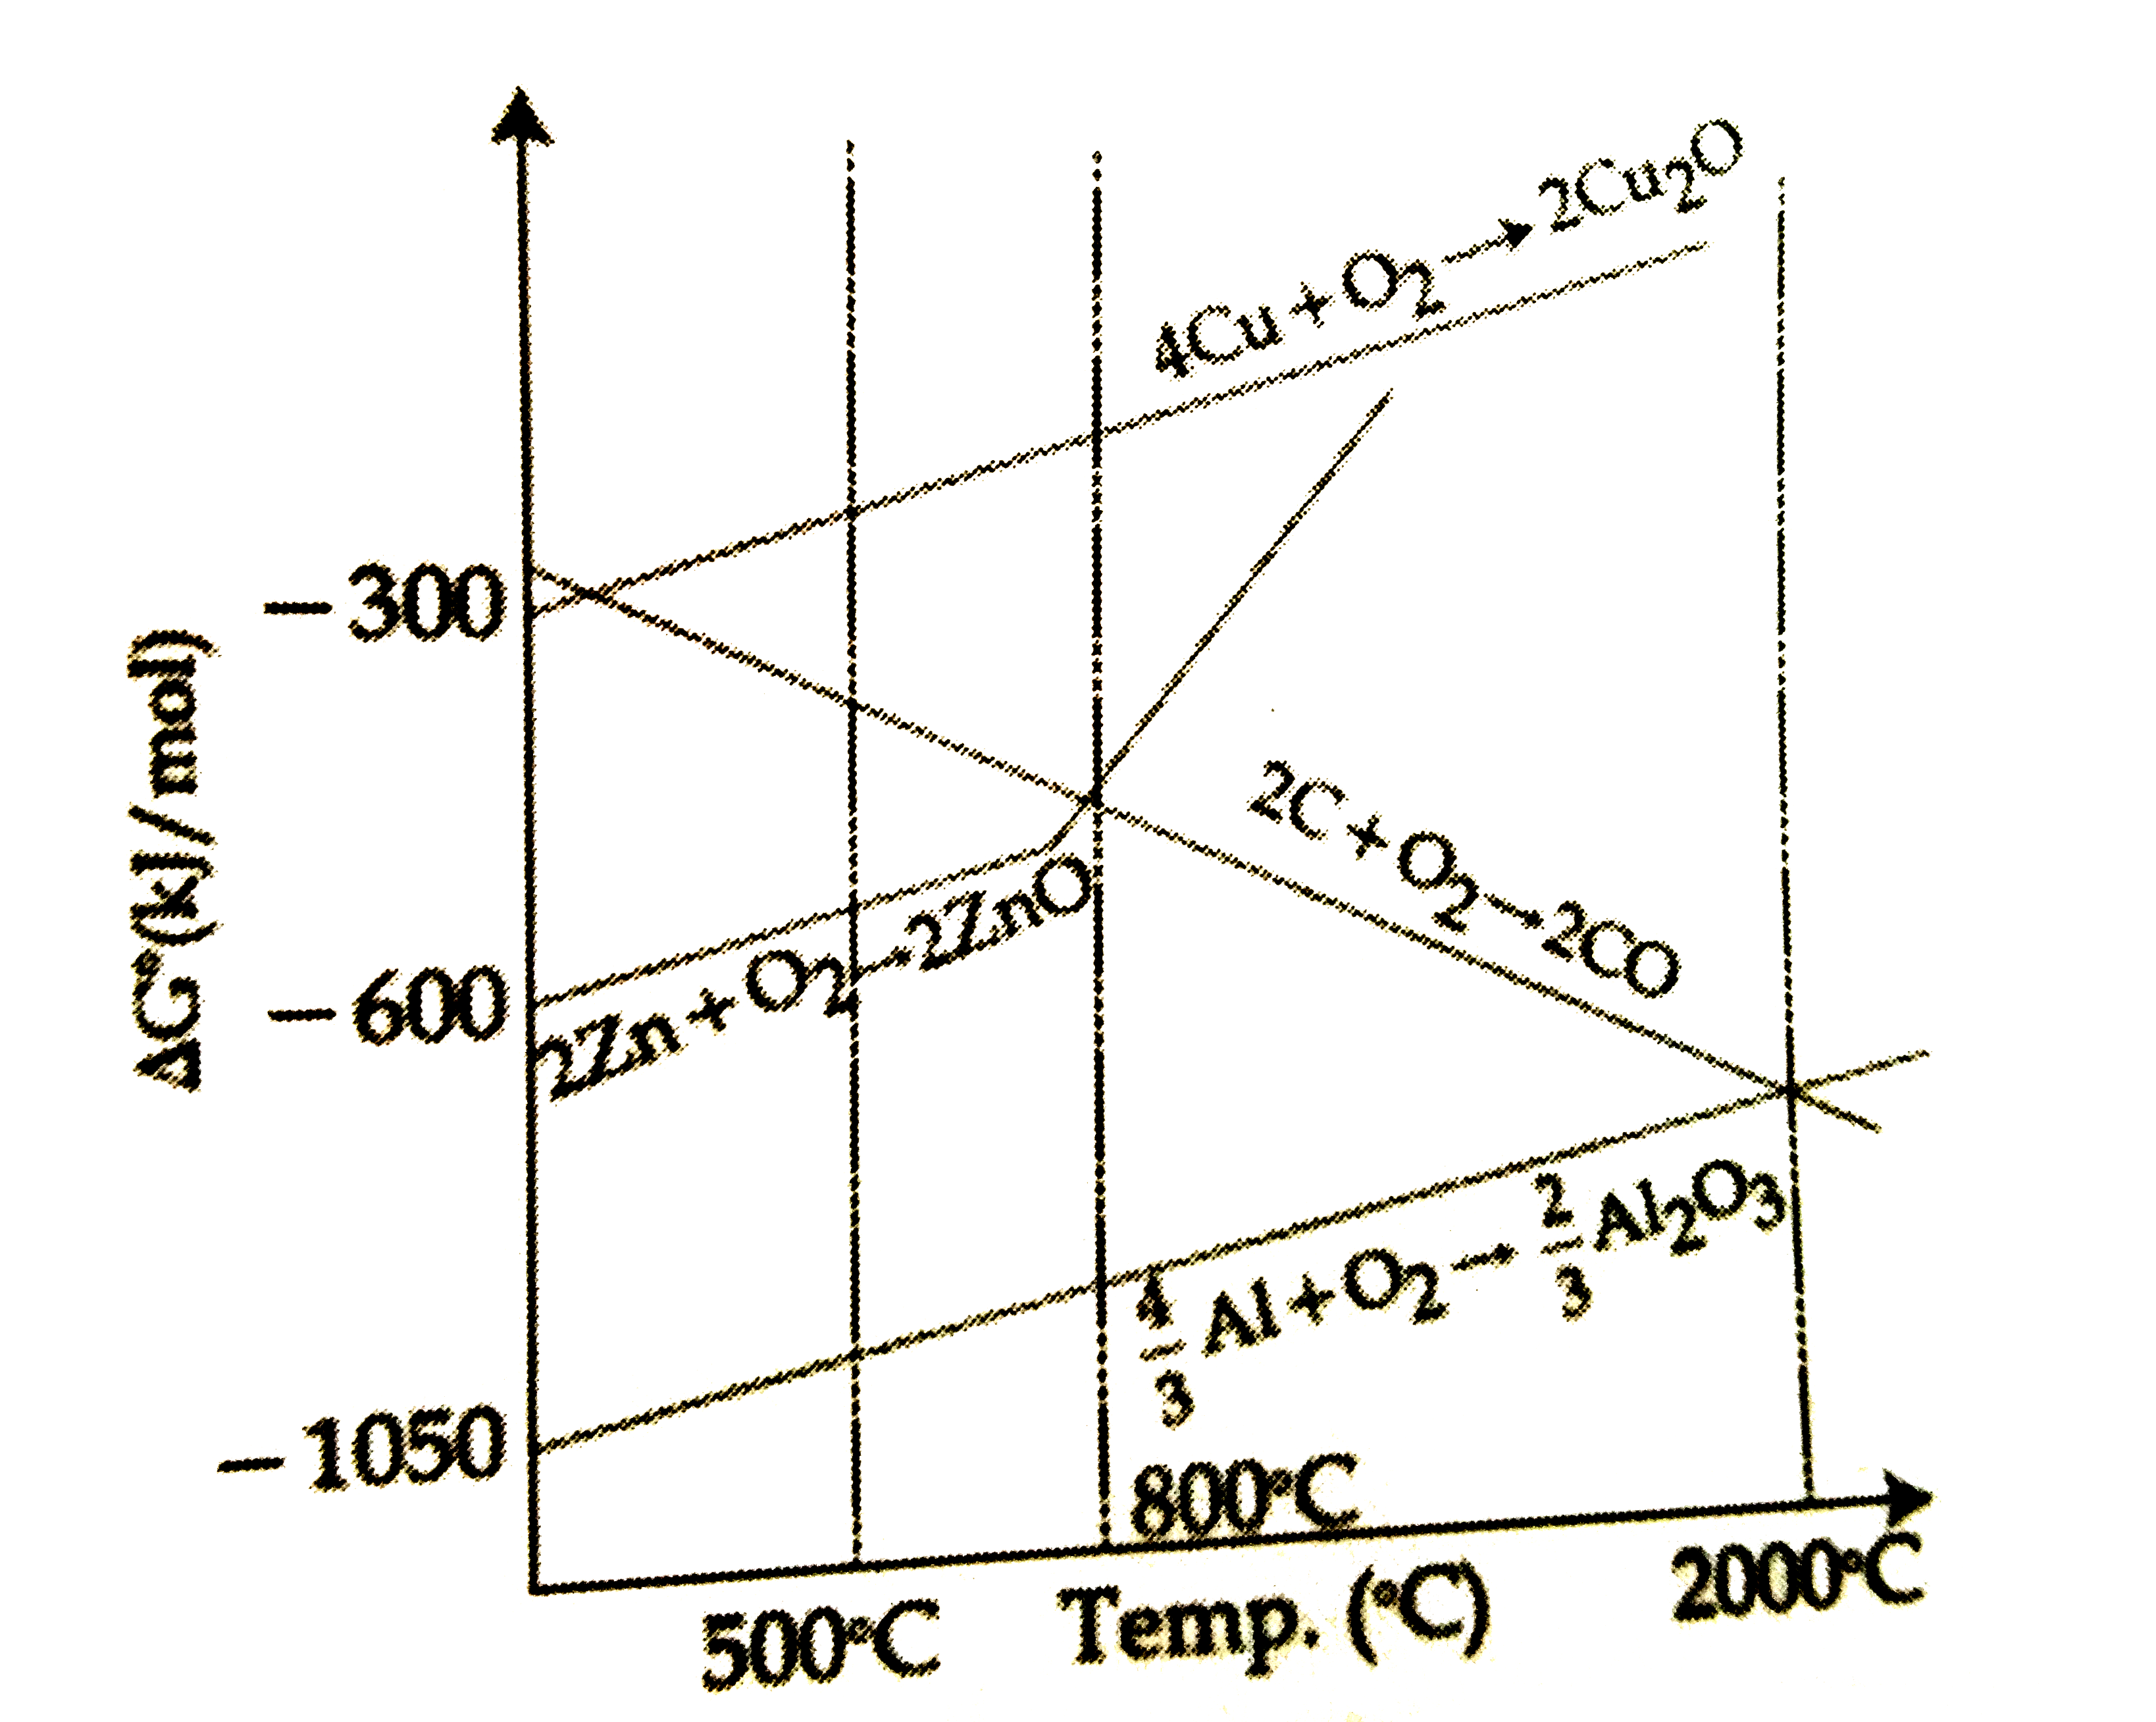
Ellingham diagram represents:
ΔG with temperature
ΔH with temperature
ΔH with pressure
(ΔG−TΔS) with temperature
The correct Answer is:A
Step-by-Step Solution:
1. Understanding the Ellingham Diagram: The Ellingham diagram is a graphical representation that illustrates how the stability of various compounds changes with temperature. It is particularly useful in metallurgy and thermodynamics.
2. Identifying the Axes: In the Ellingham diagram, the x-axis typically represents temperature (in degrees Celsius or Kelvin), while the y-axis represents the Gibbs free energy change (ΔG) for the formation of compounds.
3. Analyzing the Relationship: The diagram shows that as temperature increases, the Gibbs free energy change for different reactions can either increase or decrease, indicating whether a compound is stable or unstable at that temperature.
4. Conclusion: Therefore, the Ellingham diagram represents the relationship between the Gibbs free energy change (ΔG) of various compounds and temperature.
5. Final Answer: The correct representation of the Ellingham diagram is the plot of ΔG versus temperature.
Topper's Solved these Questions
- BOOK - NCERT FINGERTPS ENGLISHCHAPTER - GENERAL PRINCIPLES AND PROCESSES OF ISOLATION OF ELEMENTSEXERCISE - HOTS7videos
GENERAL PRINCIPLES AND PROCESSES OF ISOLATION OF ELEMENTS
- BOOK - NCERT FINGERTPS ENGLISHCHAPTER - GENERAL PRINCIPLES AND PROCESSES OF ISOLATION OF ELEMENTSEXERCISE - NCERT EXEMPLAR PROBLEMS13videos
GENERAL PRINCIPLES AND PROCESSES OF ISOLATION OF ELEMENTS
- BOOK - NCERT FINGERTPS ENGLISHCHAPTER - ELECTROCHEMISTRYEXERCISE - Assertion And Reason15videos
ELECTROCHEMISTRY
- BOOK - NCERT FINGERTPS ENGLISHCHAPTER - HALOALKANES AND HALOARENESEXERCISE - NCERT Exemplar27videos
HALOALKANES AND HALOARENES
Similar Questions
Knowledge Check
- Question 1 - Select One
Which of the following arrow diagrams represents a function from Xto Y?
A B
B C
C D
D
What does the following diagram represent ?
 View Solution
An Ellingham diagram provides information about :
View SolutionEllingham diagrams are plots of ΔG∘1 Vs T for the formation of
View SolutionThe incorrect statement for Ellingham diagram is
View SolutionThe correct statement regarding the given Ellingham diagram is :
 View Solution
With respect to an ore, Ellingham diagram helps to predict the feasiblity of its
View SolutionΔG∘vsT plot in the Ellingham diagram slopes down for the reaction.
View Solution
