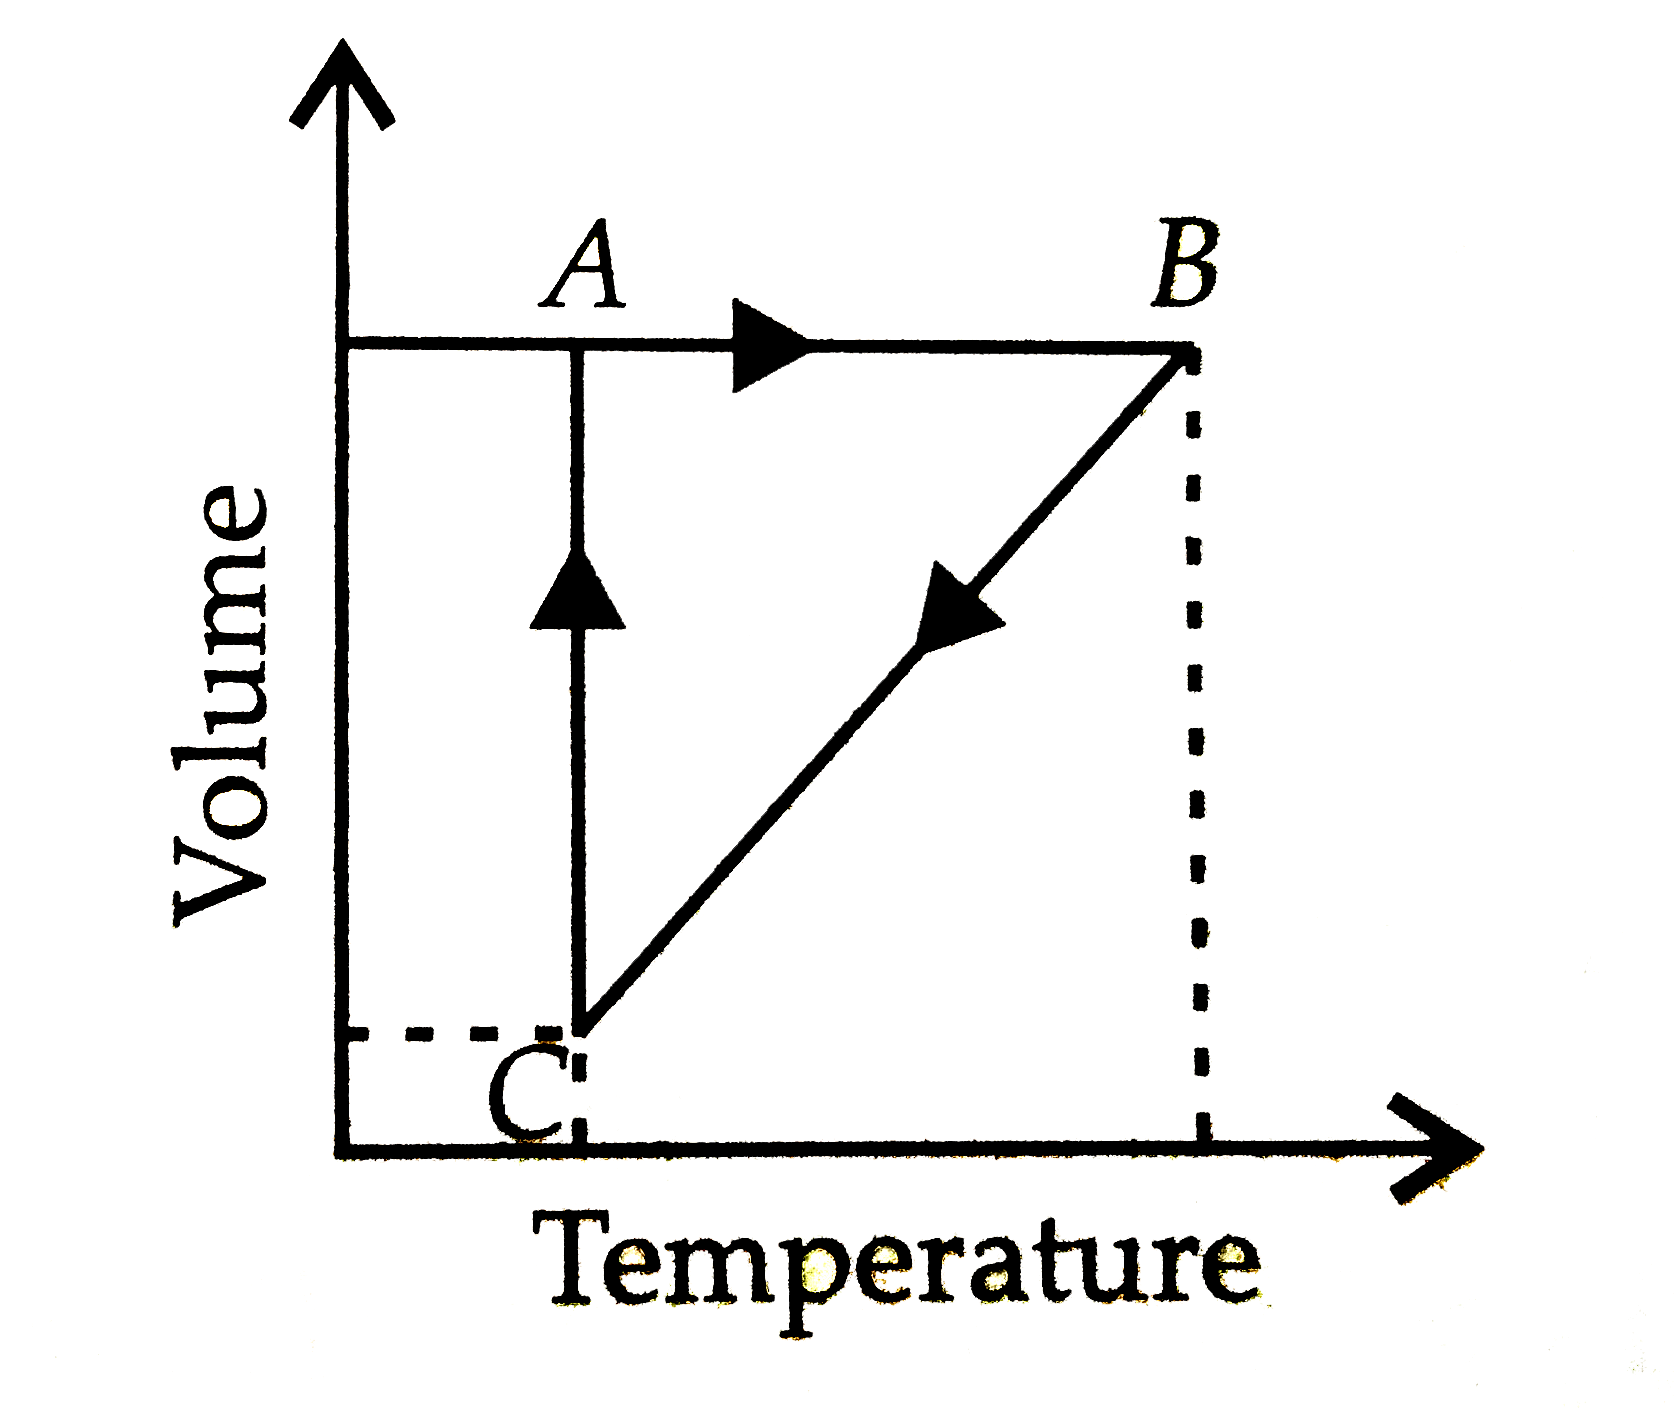
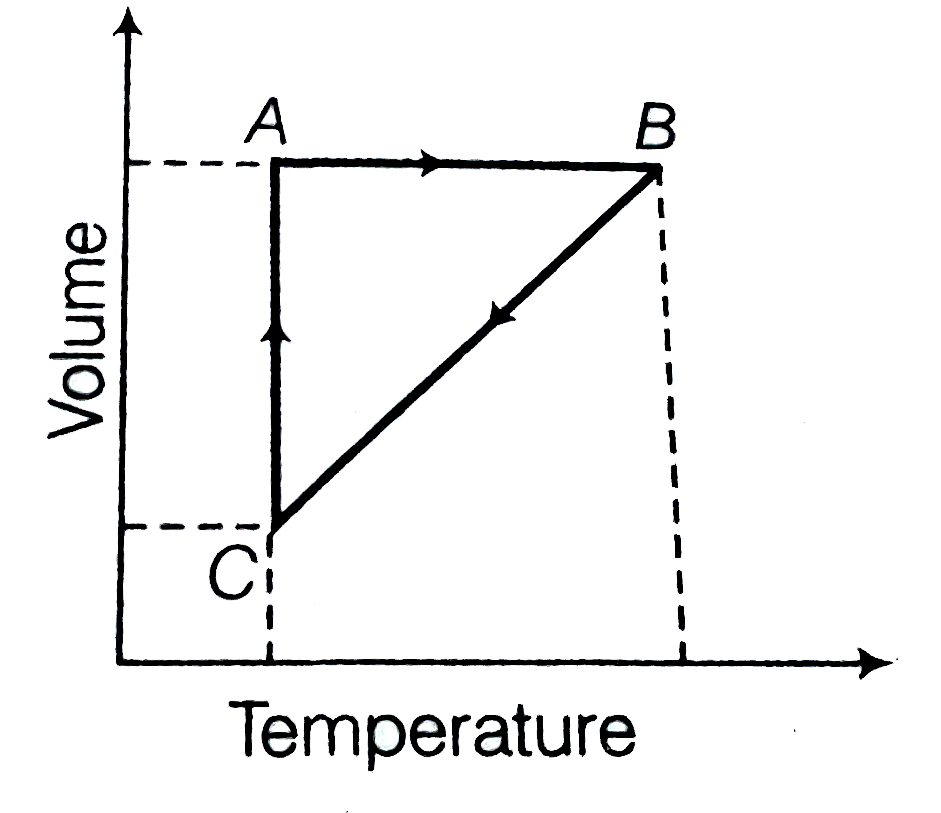
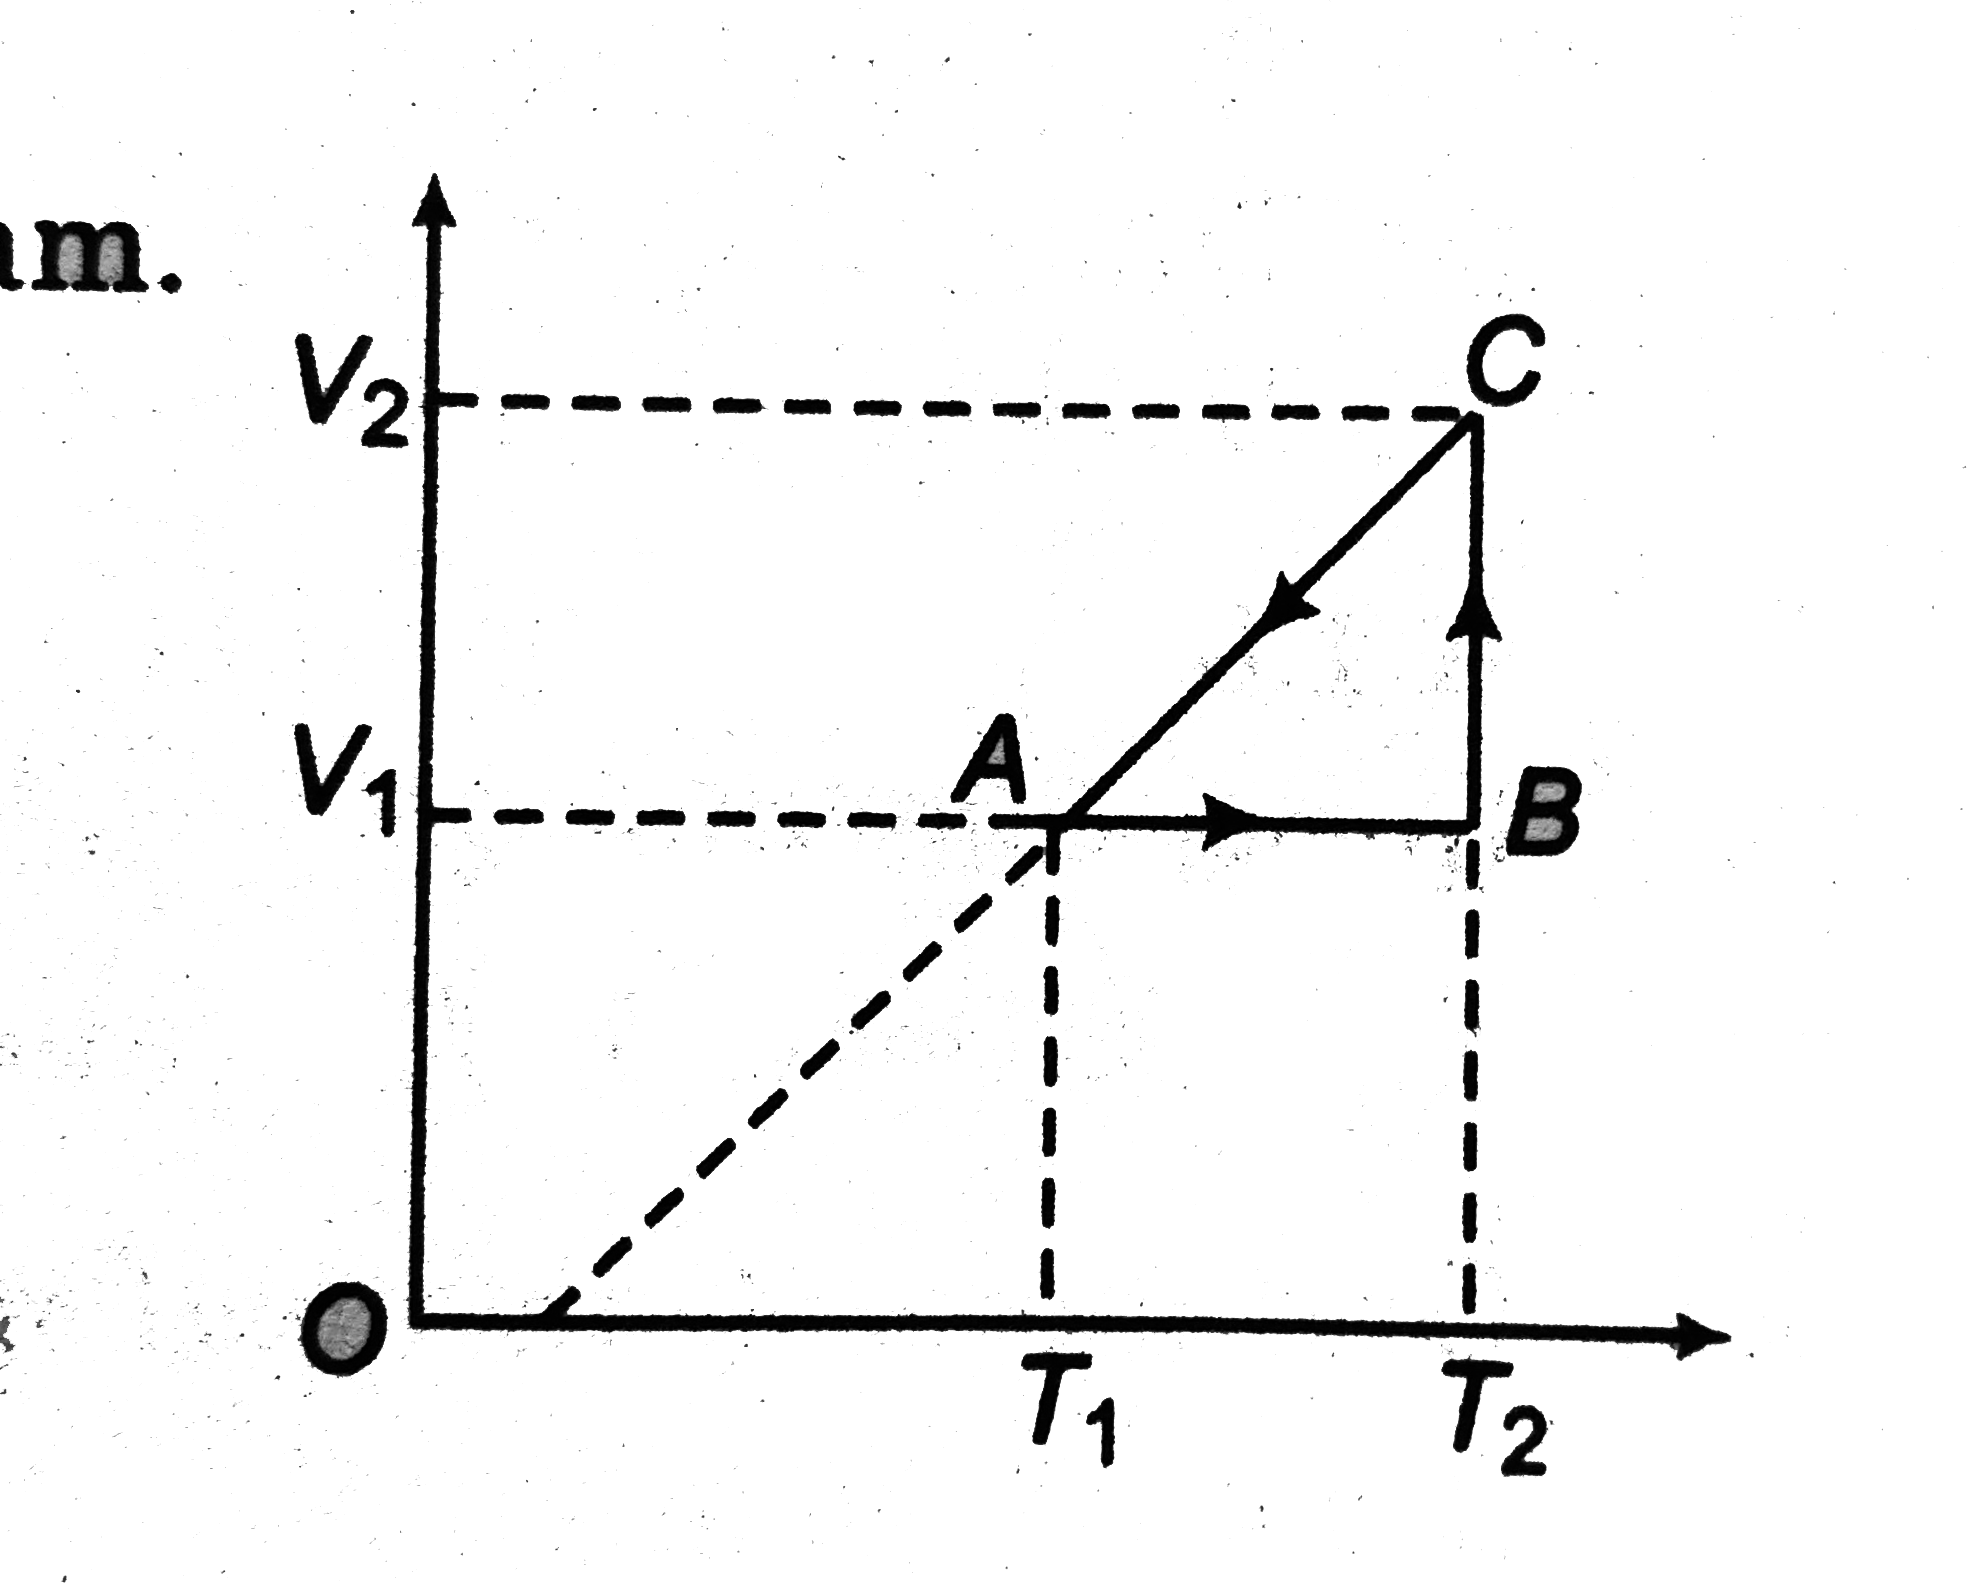
Five moles of a gas is put through a series of changes as shown graphically in a cyclic process. The process during A→B,B→CandC→A respectively are
A
isochoric, isobaric, isothermal
B
isobatic, isochoric,isothermal
C
isothermal, isobaric, isochoric
D
isochoric, isothermal, isobaric
Text Solution
The correct Answer is:A
The process which does not show any change in volume is isochoric. So, graph A→B is isochoric. The process which does not show any change in temperature is isothermal. So, graph C→A is isothermal. When there is a change in temperature as well as iin volume, then pressure remains constant, the process is isobaric. so, graph B→C is isobaric.
|
Topper's Solved these Questions
- CHEMICAL THERMODYNAMICS AND ENERGETICBOOK - MHTCET PREVIOUS YEAR PAPERS AND PRACTICE PAPERSCHAPTER - CHEMICAL THERMODYNAMICS AND ENERGETICEXERCISE - Exercise 2
83 Videos
- CHEMICAL THERMODYNAMICS AND ENERGETICBOOK - MHTCET PREVIOUS YEAR PAPERS AND PRACTICE PAPERSCHAPTER - CHEMICAL THERMODYNAMICS AND ENERGETICEXERCISE - MHT CET Corner
40 Videos
- CHEMICAL THERMODYNAMICS AND ENERGETICBOOK - MHTCET PREVIOUS YEAR PAPERS AND PRACTICE PAPERSCHAPTER - CHEMICAL THERMODYNAMICS AND ENERGETICEXERCISE - MHT CET Corner
40 Videos
- CHEMICAL KINETICS BOOK - MHTCET PREVIOUS YEAR PAPERS AND PRACTICE PAPERSCHAPTER - CHEMICAL KINETICS EXERCISE - MHT CET CORNER
20 Videos
- CHEMISTRY IN EVERYDAY LIFE BOOK - MHTCET PREVIOUS YEAR PAPERS AND PRACTICE PAPERSCHAPTER - CHEMISTRY IN EVERYDAY LIFE EXERCISE - MHT CET CORNER
11 Videos
Similar Questions
Knowledge Check
Five mole of a gas put through a series of change as shown below graphically in a cyclic process. The processes A→B,B→C and C→A, respectively, are
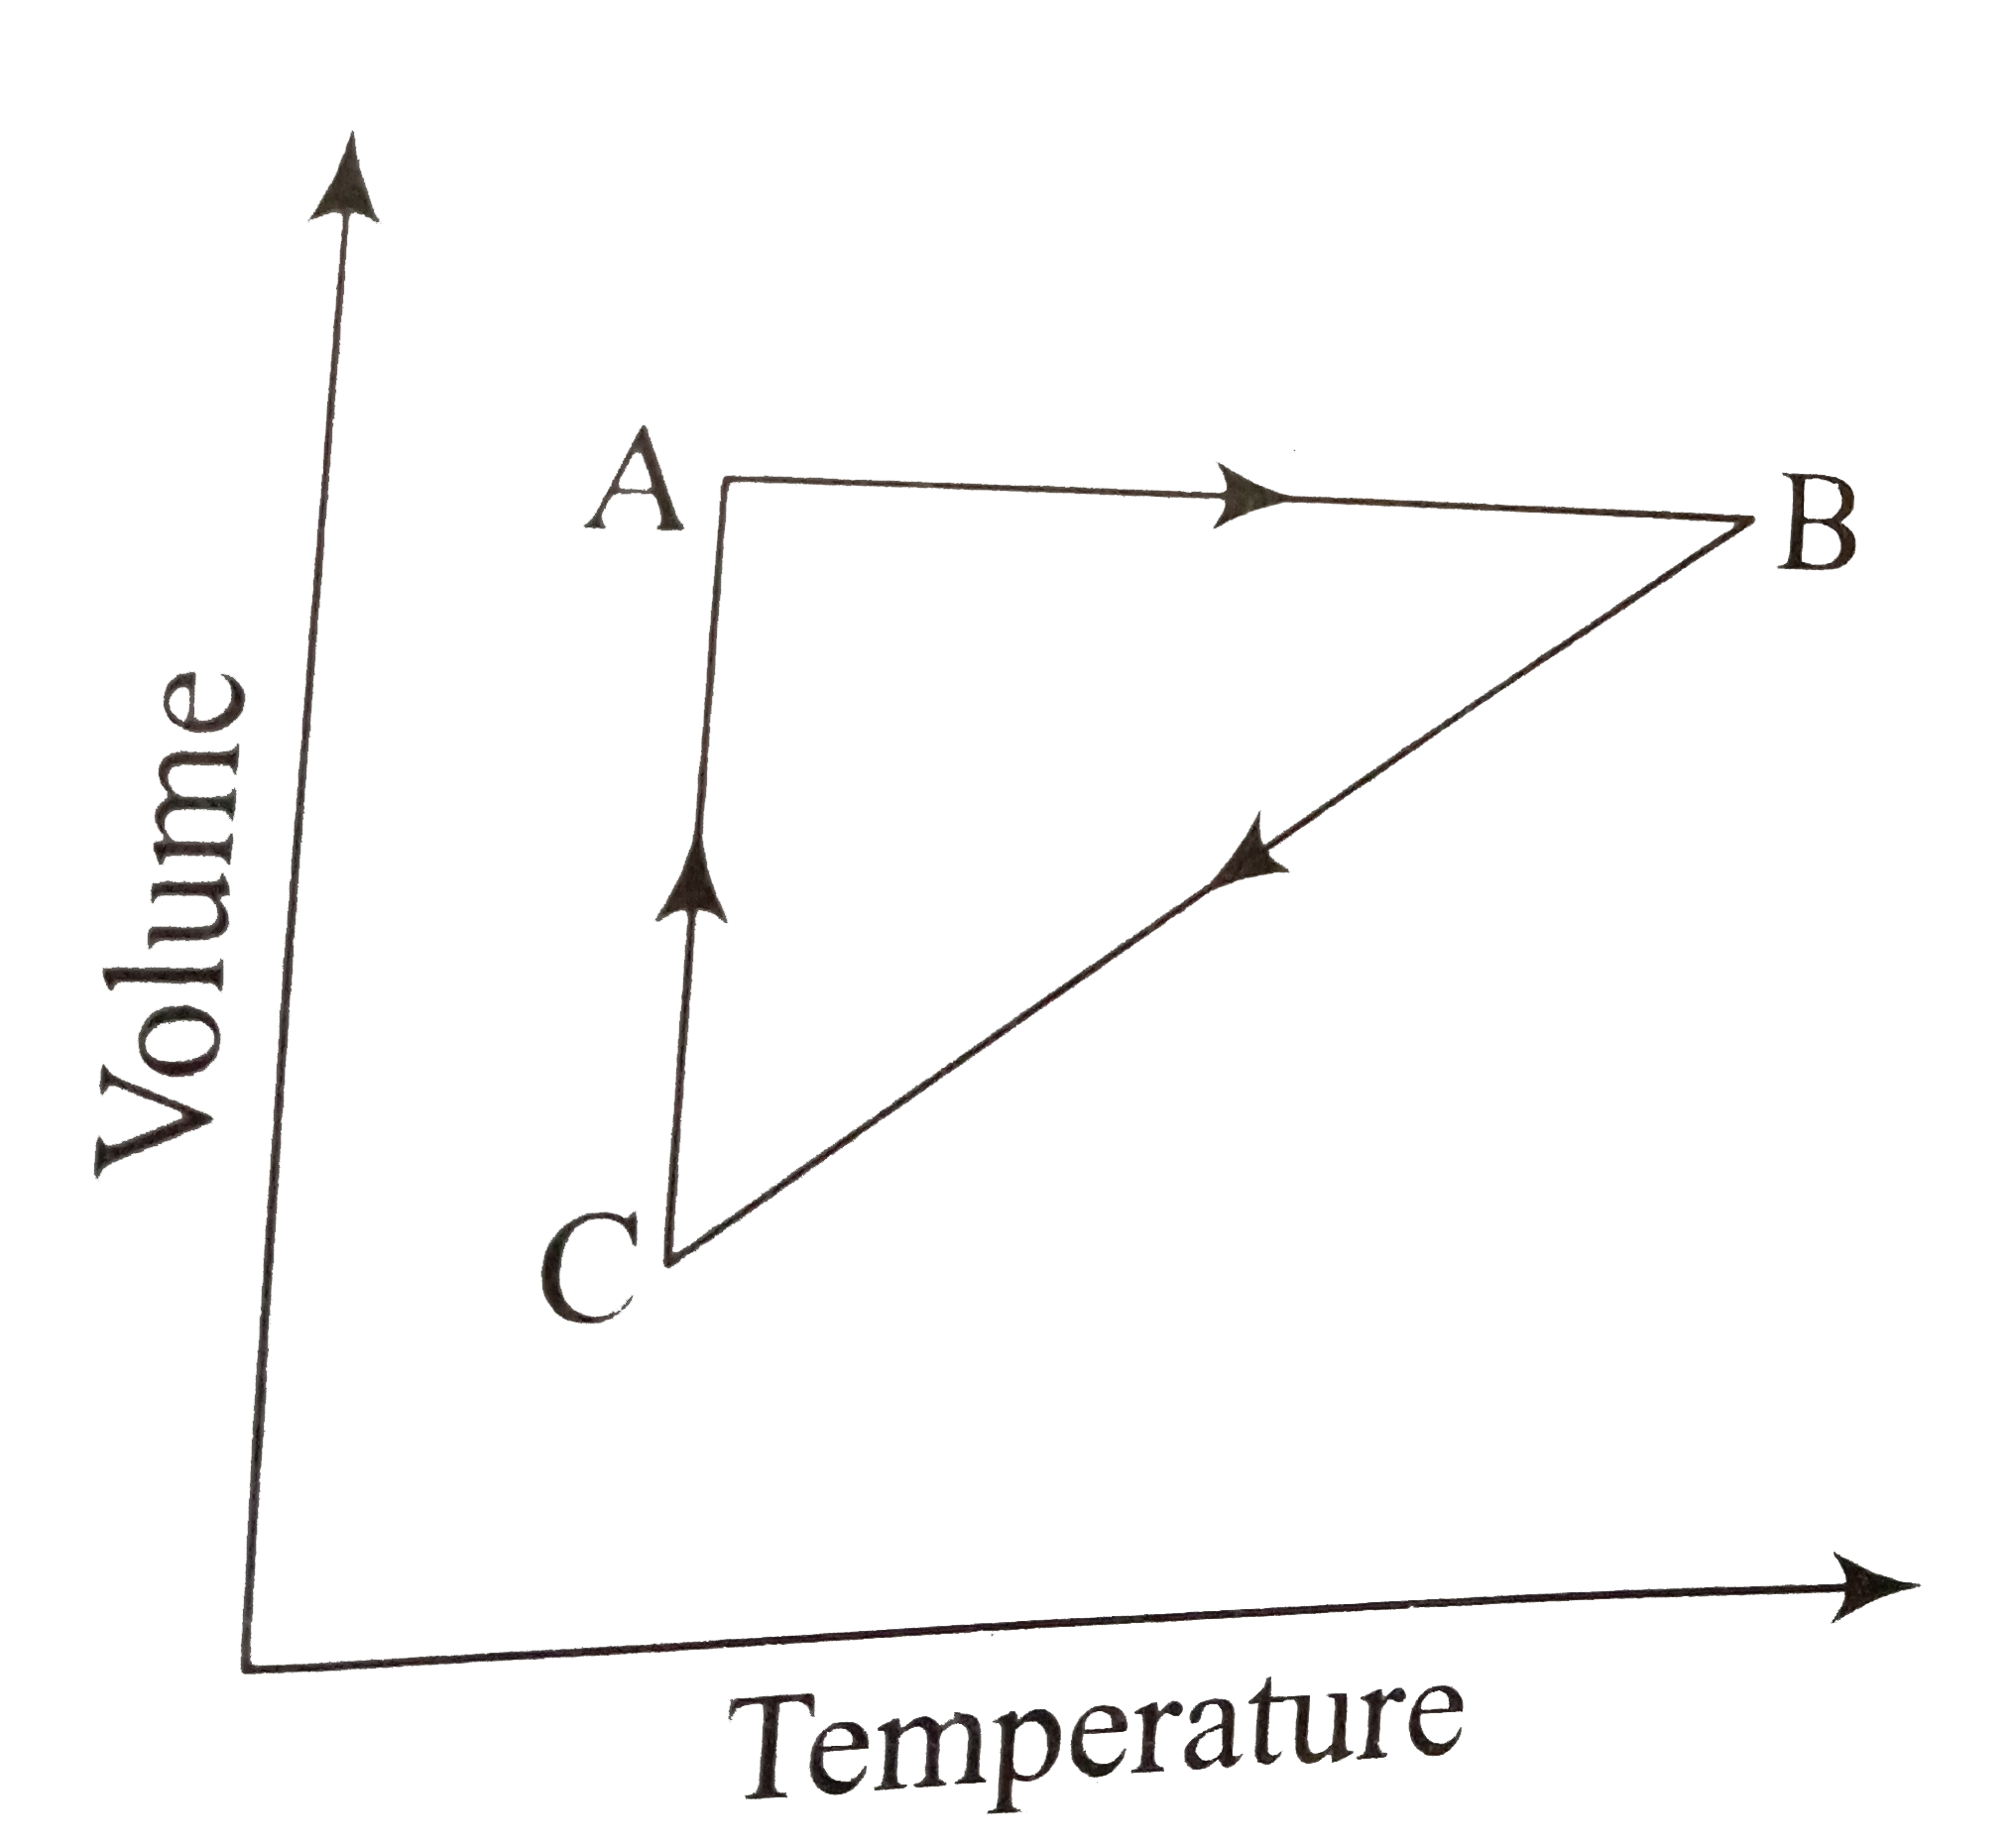 Aisochoric, isobaric, isothermalBisobaric, isochoric,isothermalCisothermal,isobaric,isochoricDisobaric, isothermal, isobaric
A cyclic process for 1 mole of an ideal gas is shown in the V-T diagram. The work done in AB, BC and CA respectively are
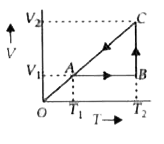 A0,RT1ln(V1V2),R(T1−T2)BR,R(T1−T2),RT1ln(V1V2)C0,RT2ln(V1V2),R(T1−T2)D0,RT2ln(V2V1),R(T1−T2)
The cyclic process for 1 mole of an ideal gas is shown in the V-T diagram. The work done in AB, BC and CA respectively is
 A(a) 0, RT2In∣∣∣V2V1∣∣∣,R(T1−T2)B(b) R(T1−T2),0,RT1In∣∣∣V1V2∣∣∣C(c) 0,RT1In∣∣∣V1V2∣∣∣,R(T1−T2)D(d) 0,RT_(2)In|V_2/V_1|,R(T_2-T_1)
The cyclic process for 1 mole of an ideal gas is shown in the V-T diagram. The work done in AB, BC and CA respectively is

View SolutionFind the work done by gas going through a cyclic process shown in figure?

View SolutionFind the work done by gas going through a cyclic process shown in figure?

View SolutionThe cyclic process for 1 mole of an ideal gas is shown in the V-T diagram. The work done in AB, BC and CA respectively is

View SolutionFind the work done by gas going through a cyclic process shown in figure?
View Solution

