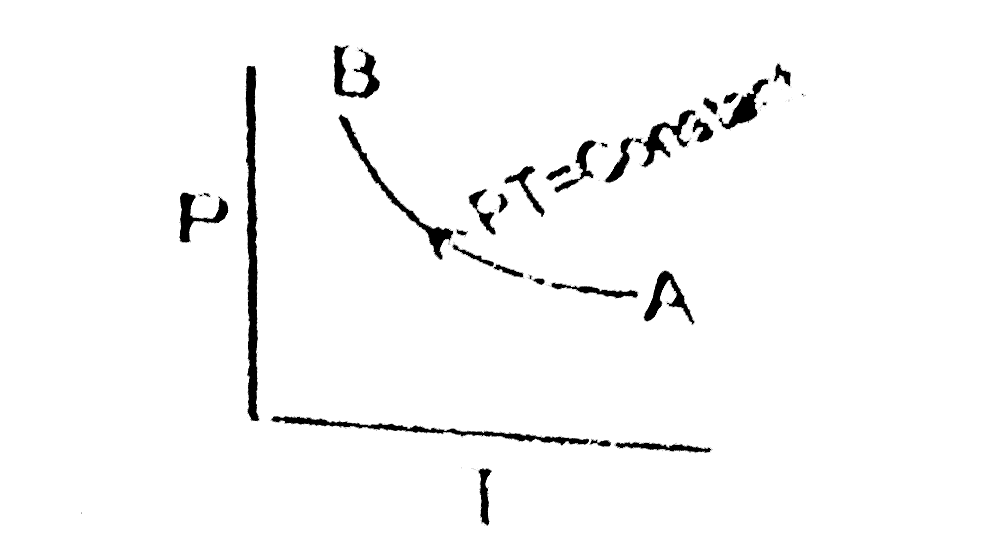
For a certain amount of an ideal gas at constant temperature, __________________.
volume always remains constant
pressure always remains constant
product of pressure and volume remains constant.
the ratio of pressure and volume always remains constant.
The correct Answer is:C
Step by step video, text & image solution for For a certain amount of an ideal gas at constant temperature, "__________________". by Chemistry experts to help you in doubts & scoring excellent marks in Class 11 exams.
Updated on:21/07/2023Topper's Solved these Questions
- STATES OF MATTER (GASES AND LIQUIDS) BOOK - TARGET PUBLICATIONCHAPTER - STATES OF MATTER (GASES AND LIQUIDS) EXERCISE - COMPETITIVE THINKING
50 Videos
- STATES OF MATTER (GASES AND LIQUIDS) BOOK - TARGET PUBLICATIONCHAPTER - STATES OF MATTER (GASES AND LIQUIDS) EXERCISE - EVALUATION TEST
20 Videos
- STATES OF MATTER (GASES AND LIQUIDS) BOOK - TARGET PUBLICATIONCHAPTER - STATES OF MATTER (GASES AND LIQUIDS) EXERCISE - EVALUATION TEST
20 Videos
- SOME BASIC CONCEPTS OF CHEMISTRYBOOK - TARGET PUBLICATIONCHAPTER - SOME BASIC CONCEPTS OF CHEMISTRYEXERCISE - EVALUATION TEST
20 Videos
- SURFACE CHEMISTRYBOOK - TARGET PUBLICATIONCHAPTER - SURFACE CHEMISTRYEXERCISE - Evaluation Test
10 Videos
Similar Questions
Knowledge Check
For given mass of an ideal gas at constant temperature
AP vs V graph is a straight line passing through originBP vs 1V graph is a rectangular hyperbolaCPV vs P graph is a straight line passing through originDPV vs V graph is a straight lineThe bulk modulus of an ideal gas at constant temperature
Ais equal to its volume VBis equal to p/2Cis equal to its pressure pDCannot be determinedThe bulk modulus of an ideal gas at constant temperature
AIs equal to its volume VBIs equal to p/2CIs equal to its pressure pDCan not be determined
Assertion : For a certain amount of an ideal gas, PV is always constant at constant temperature.
Reason : This is the statement of Boyle's Law.
View SolutionWhich of the following curve is incorrect for given amount of an ideal gas at constant temperature ?
View SolutionWhich of following graphs correctly represent variation of α=−(dV/dP)TV with P for fixed amount of an ideal gas at constant temperature ?
View SolutionWhen a sample of ideal gas is changed from an initial state to a final state, various curves can be plotted for the process like P-V curve, V-T curve,P-T curve etc.
For example, P-V curve for a fixed amount of an ideal gas at constant temperature is a rectangular hyperbola, V-T curve for a fixed amount of an ideal gas at constant volume is again a straight line. However, the shapes may vary if the constant parameters are also changed.
Now, answer the following questions :
Which of the following statements is correct regarding a fixed amount of ideal gas undergoing the following process :

View SolutionWhen a sample of ideal gas is changed from an initial state to a final state, various curves can be plotted for the process like P-V curve, V-T curve,P-T curve etc.
For example, P-V curve for a fixed amount of an ideal gas at constant temperature is a rectangular hyperbola, V-T curve for a fixed amount of an ideal gas at constant volume is again a straight line. However, the shapes may vary if the constant parameters are also changed.
Now, answer the following questions :
Which of the following graphs is not possible for a fixed amount of ideal gas upon moving from initial state A to final state B :
View Solution
