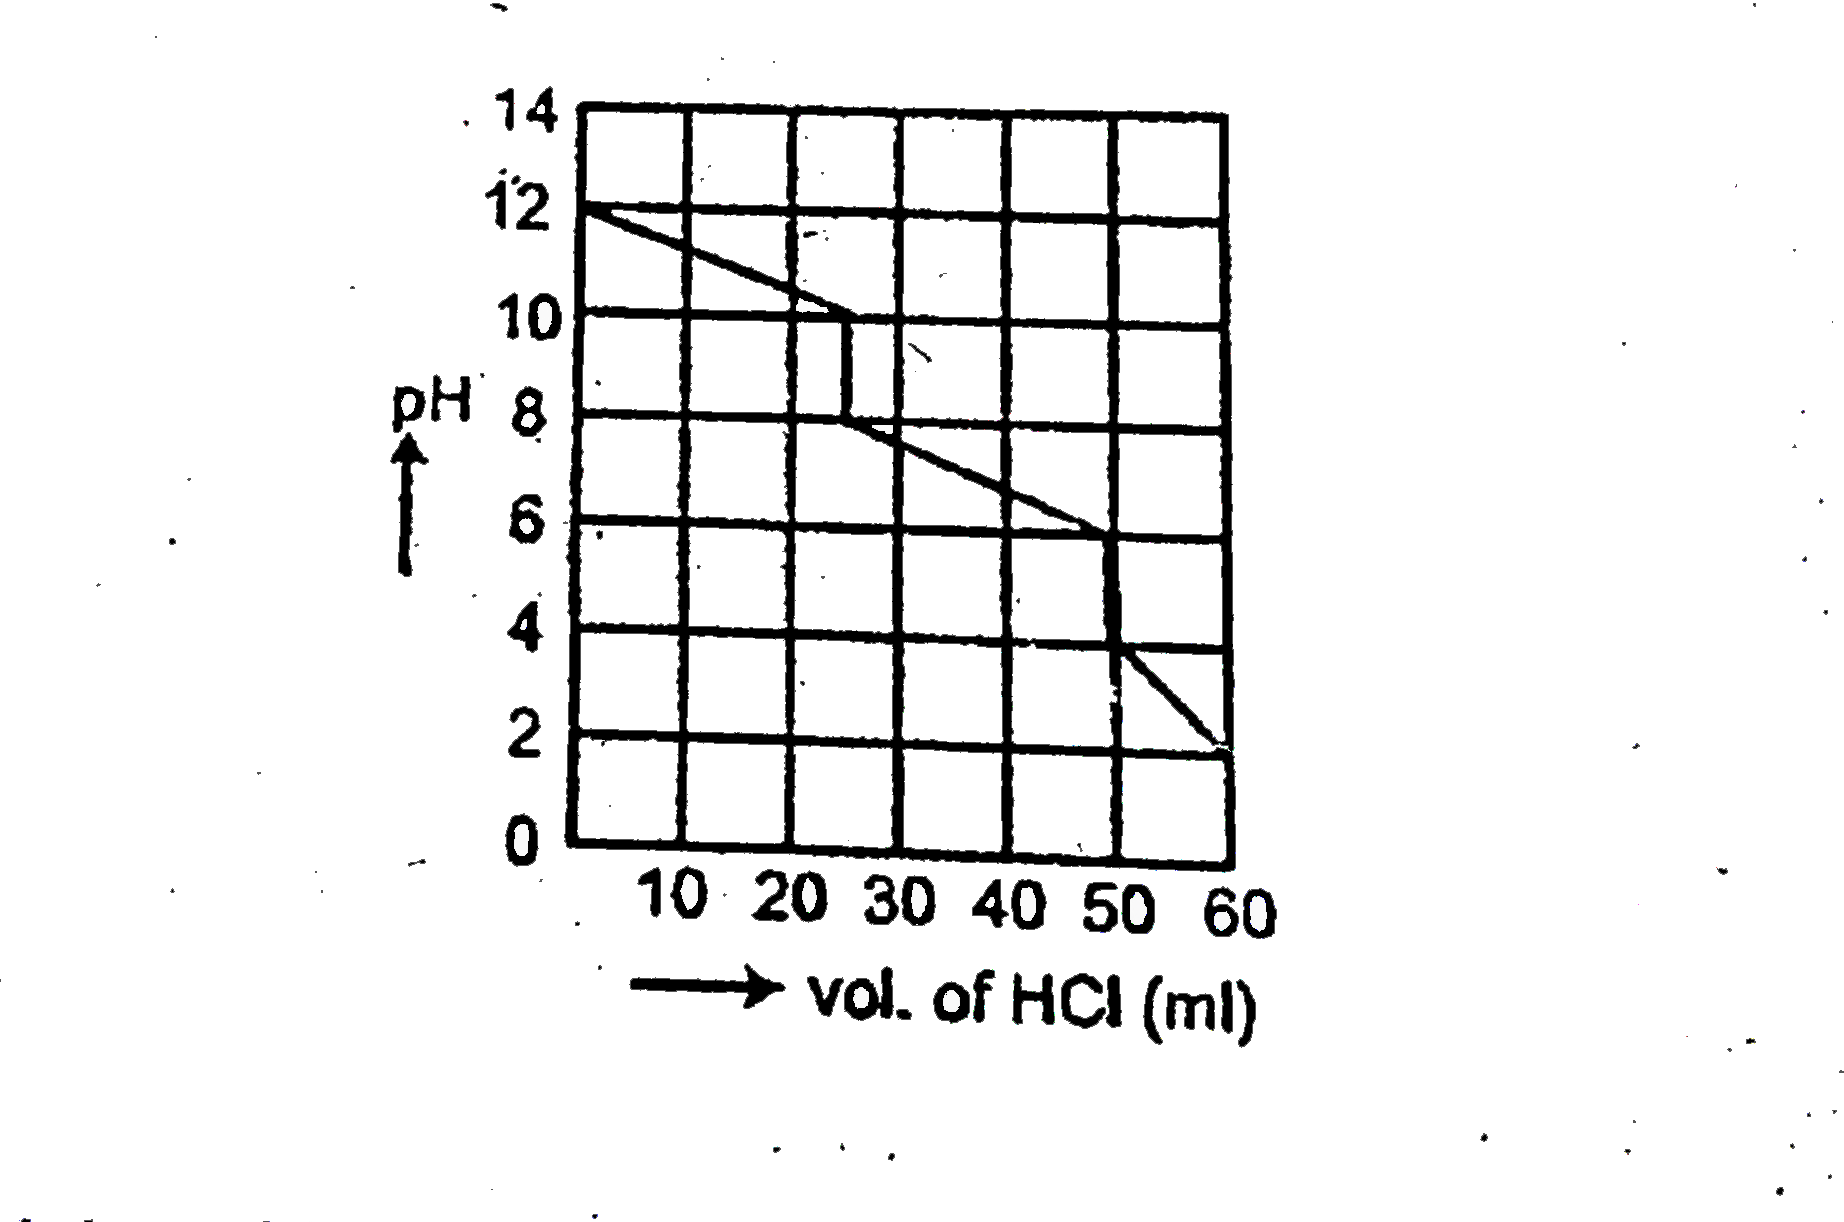
For a series of indicators, the colour and pH range over which colour change takes place are as follows:
IndicatorColour change over pH rangeUYellow to blue pH 0.0 to 1.6VRed to yellow pH 2.8 to 4.1WRed to yellow pH 4.2 to 5.8XYellow to blue pH 6.0 to 7.7YColourless to red pH 8.2 to 10.0
Which of the followinfg statements is correct ?
Indicator V could be used to find the equivalence point for 0.01M acetic and 0.1M ammonium hydroxide (ammonia solution) titration.
Indicator Y could be used to distinguish between 0.1MHCI and 0.01MNaOH solutions in water.
Indicator X could be used to distinguish between solution of ammonium chloride and sodium acetate.
Indicator W could be suitable for use in determining the concentration of acetic acid in vinegar by base titration.
The correct Answer is:C
a. For the titration of WA and WB, there is no sharp change in the pH value near the end point.
(pH varies between 6.0 and 8.0)
So indicator V can not be used. But indicator X can be used.
CH3COOH+NH4OH⇒pH=7
b. 0.01MNaOH⇔pH=130.001MNaOh⇔pH=11]
Y cannot be used. Choose an indicator which has different colour for pH=13 and 11.
c. X can be used since it will given different colout in both the solutions. NH4CI (Salt of SA/SApH<7) and CH3COONa (salt of WA/SBpH>7).
d. Y will be suitable indicator not W.
CH3COOH+Base⇒pH>7.
Topper's Solved these Questions
- BOOK - CENGAGE CHEMISTRYCHAPTER - IONIC EQUILIBRIUMEXERCISE - Exercises Single Correct121videos
IONIC EQUILIBRIUM
- BOOK - CENGAGE CHEMISTRYCHAPTER - IONIC EQUILIBRIUMEXERCISE - Exercises Assertion-Reasoning36videos
IONIC EQUILIBRIUM
- BOOK - CENGAGE CHEMISTRYCHAPTER - IONIC EQUILIBRIUMEXERCISE - Exercises Linked Comprehension45videos
IONIC EQUILIBRIUM
- BOOK - CENGAGE CHEMISTRYCHAPTER - HYDROGEN, WATER AND HYDROGEN PEROXIDEEXERCISE - Subjective Archive (Subjective)3videos
HYDROGEN, WATER AND HYDROGEN PEROXIDE
- BOOK - CENGAGE CHEMISTRYCHAPTER - ISOMERISMEXERCISE - Assertion-Reasoning Type1videos
ISOMERISM
Similar Questions
For a series of indicators the following colours and pH range over which colour change takes place are as follows :

Indicator U could be used to distinguish between 0.1 M and 0.01 M solution of sulphuric acid :
(a) True
(b) FalseView SolutionFor a series of indicators the following colours and pH range over which colour change takes place are as follows :

Indicator X could be used to distinguish between the solution of ammonium chloride and sodium acetate solution :
(a) True
(b) FalseView Solution
Knowledge Check
- Question 1 - Select One
Which acid -base indicator will give the best results for the titration of an aqueous ammonia solution with 0.10 M HCI ?
IndicatorColour ChangepH rangeMethyl violet red→blue0→2Methyl redred→yellow4→6Cresol redyellow→purple7→9Phenolphthaleincolourless−−−−−−−−−−−−−−→pink8→10AMethyl violetBMethyl redCCresol redDPhenolphthalein - Question 2 - Select One
The variation of pH during the titration of 0.5 N Na2CO3 with 0.5 N HCl is shown in the given graph.The following table indicates the colour and pH ranges of different indicators :
IndicatorRange of colour changeColour in acidColour in baseThymol blue1.2to2.8RedYellowBromocresol red4.2to6.3RedYellowBromothymol blue6.0to7.6YellowBlueCresolphethalein8.2to9.8ColourlessRed

Based on the graph and the table which of the following statements are true ?AThe first equivalence point can be detected by cresolphthaleinBThe complete neutralisation can be detected by bromothymol blueCThe second equivalence point can be detected by bromocresol red.DThe volume of HCl required for the first equivalence point is half the volume of HCl required for the second equivalence point. - Question 3 - Select One
Payal has to arrange the following in DECREASING order of hydroxide ion concentration. wine (pH 4.0), milk of magnesia (pH 10.5), blood (pH 7.4) Which of the following arrangements is correct?
Awine -> milk of magnesia -> bloodBblood -> milk of magnesia -> wineCmilk of magnesia -> blood -> wineDwine -> blood -> milk of magnesia
For a series of indicators the following colours and pH range over which colour change takes place are as follows :

Indicator Y could be used to distinguish between the solutions of ammonium chloride and sodium acetate solution :
(a) True
(b) FalseView SolutionFor a series of indicators the following colours and pH range over which colour change takes place are as follows :

Indicator V could be used to find the equivalence point for 0.1 M acetic acid and 0.1 M ammonium hydroxide solution :
(a) True
(b) FalseView SolutionFor a series of indicators the following colours and pH range over which colour change takes place are as follows :

Indicator W would be suitable for use in the determination of the concentration of acetic acid in white vinegar by base titration :
(a) True
(b) FalseView SolutionMost of the indicators have a useful colour change over a pH range of .............. units.
View SolutionCalcualte the pH at which an indicator with pKb=4 changes colour.
View Solution

