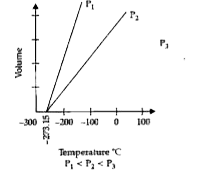
How charle's law can be represented graphically?
To represent Charles' Law graphically, we can follow these steps:
1. Understand Charles' Law:
- Charles' Law states that the volume (V) of a given mass of gas is directly proportional to its absolute temperature (T) when the pressure is held constant. Mathematically, this can be expressed as:
V∝TorV=kT
where k is a constant.
2. Set Up the Axes:
- On a graph, we will plot the volume of the gas on the y-axis and the absolute temperature (in Kelvin) on the x-axis. While the transcript mentions using degrees Celsius, it is more accurate to use Kelvin for scientific representation.
3. Plotting Points:
- Choose different constant pressures (P1, P2, P3, P4) and calculate the corresponding volumes at various temperatures. For example, you might choose temperatures like 0 K, 100 K, 200 K, etc., and find the volumes for each pressure.
4. Drawing the Graph:
- For each pressure, plot the points on the graph. Each set of points will form a straight line starting from the origin (0,0) because at 0 K, the volume is theoretically zero.
- The lines for different pressures will diverge from each other, indicating that as pressure increases, the volume at a given temperature also increases.
5. Labeling the Graph:
- Clearly label the axes (Volume on the y-axis and Temperature on the x-axis).
- Indicate the lines for different pressures (P1, P2, P3, P4) with different colors or styles.
6. Interpreting the Graph:
- The graph will show that as the temperature increases, the volume also increases, confirming Charles' Law. The steeper the line, the greater the volume change with temperature at that specific pressure.
- Charles' Law states that the volume (V) of a given mass of gas is directly proportional to its absolute temperature (T) when the pressure is held constant. Mathematically, this can be expressed as:
V∝TorV=kT
where k is a constant.
- On a graph, we will plot the volume of the gas on the y-axis and the absolute temperature (in Kelvin) on the x-axis. While the transcript mentions using degrees Celsius, it is more accurate to use Kelvin for scientific representation.
- Choose different constant pressures (P1, P2, P3, P4) and calculate the corresponding volumes at various temperatures. For example, you might choose temperatures like 0 K, 100 K, 200 K, etc., and find the volumes for each pressure.
- For each pressure, plot the points on the graph. Each set of points will form a straight line starting from the origin (0,0) because at 0 K, the volume is theoretically zero.
- The lines for different pressures will diverge from each other, indicating that as pressure increases, the volume at a given temperature also increases.
- Clearly label the axes (Volume on the y-axis and Temperature on the x-axis).
- Indicate the lines for different pressures (P1, P2, P3, P4) with different colors or styles.
- The graph will show that as the temperature increases, the volume also increases, confirming Charles' Law. The steeper the line, the greater the volume change with temperature at that specific pressure.
Topper's Solved these Questions
- STATES OF MATTER : GASES AND LIQUIDSBOOK - ICSECHAPTER - STATES OF MATTER : GASES AND LIQUIDSEXERCISE - OBJECTIVE (MULTIPLE CHOICE) TYPE QUESTIONS
49 Videos
- STATES OF MATTER : GASES AND LIQUIDSBOOK - ICSECHAPTER - STATES OF MATTER : GASES AND LIQUIDSEXERCISE - TRUE OR FALSE TYPE QUESTION
15 Videos
- STATES OF MATTER : GASES AND LIQUIDSBOOK - ICSECHAPTER - STATES OF MATTER : GASES AND LIQUIDSEXERCISE - SHORT ANSWER TYPE QUESTION
23 Videos
- SOME P-BLOCK ELEMENTS BOOK - ICSECHAPTER - SOME P-BLOCK ELEMENTS EXERCISE - NCERT TEXTBOOK EXERCISES (With Hints and Solutions)
63 Videos
- STRUCTURE OF ATOMBOOK - ICSECHAPTER - STRUCTURE OF ATOMEXERCISE - NCERT Textbook Exercises
67 Videos
Similar Questions
Charle's law may be expressed as
View SolutionState and explain Boyle's law. Represent the law graphically.
View SolutionWhich measure of central tendency can be determined graphically
View SolutionSolve the inequalities and represent the solution graphically on number line. 5x+1>24,5x−1<24.
View SolutionThe frequency distributions been represented graphically as follows.

Do you think representation is correct? Why?
View SolutionHow can the activation enrgy for a reaction be determined graphically?
View SolutionFaraday law represents :
View SolutionA gas that follos Boyle's law, charle's law and Avogadro's law is called an ideal gas. Under what conditions a real gas would behave ideally ?
View SolutionExplain why CO2−3 ion cannot be represented by a single Lewis structure. How can it be best represented ?
View SolutionState the law which are represented by the following graphs.

View Solution
