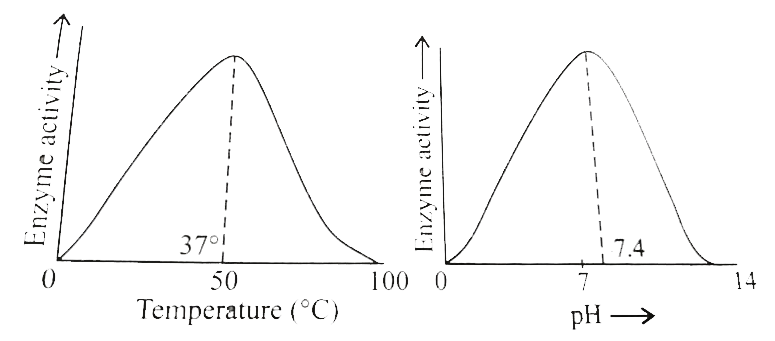
How does the rate of an enzyme-catalyzed reactions vary with (a) temprature and (b) pH? Represent diagrammatically.
Video Solution
Text Solution
As the temperature or pH is increased, the rate rise till it is maximum at 37∘C (physiological temperature) or pH=7.4 and then falls off (as shows in the figure).

|
Updated on:21/07/2023
Topper's Solved these Questions
- BOOK - CENGAGE CHEMISTRY ENGLISHCHAPTER - SURFACE CHEMISTRYEXERCISE - Illustration 5.361videos
SURFACE CHEMISTRY
- BOOK - CENGAGE CHEMISTRY ENGLISHCHAPTER - SURFACE CHEMISTRYEXERCISE - Solved Examples20videos
SURFACE CHEMISTRY
- BOOK - CENGAGE CHEMISTRY ENGLISHCHAPTER - SOLUTIONSEXERCISE - Ex 2.3 (Objective)9videos
SOLUTIONS
- BOOK - CENGAGE CHEMISTRY ENGLISHCHAPTER - SYNTHETIC AND NATURAL POLYMERSEXERCISE - Exercises Assertion Reasoning10videos
SYNTHETIC AND NATURAL POLYMERS
Similar Questions
Knowledge Check
- Question 1 - Select One
The rate of enzyme catalysed reaction becomes stable after some time due to
Aaccumulation of productBincreased pHCincreased temperatureDsaturation of enzyme - Question 2 - Select One
How does the surface tension of a liquid vary with increase in temperature ?
ARemains sameBDecreasesCIncreasesDNo regular pattern is followed .
Which enzyme catalyzes the link reaction ?
View SolutionHow does the surface tension of a liquid vary with increase in temperature ?
View SolutionHow does the electrical conductivity of super- conductors vary with temperature ?
View SolutionEnzymes increase rate of chemical reaction by
View SolutionHow does the value of rate constant vary with reactant concentration?
View SolutionHow does the value of rate constant vary with reactant concentration?
View Solution
