In plot of mass of the gas adsorbed per gram of the adsorbent versus temperature at constant pressure is called ………..
To solve the question, we need to understand the terms used in the context of adsorption and how they relate to the given scenario.
1. Understanding the Terms:
- The question asks about a specific type of plot related to adsorption, which is the process where gas molecules adhere to the surface of a solid (adsorbent).
2. Identifying the Variables:
- The plot described involves the mass of gas adsorbed per gram of adsorbent on the y-axis and temperature on the x-axis, with the pressure held constant.
3. Recognizing the Constant Condition:
- Since the pressure is constant during this process, we refer to this condition as "isobaric." The term "isobar" means constant pressure.
4. Defining the Plot:
- When we plot the mass of gas adsorbed per gram of adsorbent against temperature at constant pressure, this specific type of plot is referred to as an "adsorption isobar."
5. Conclusion:
- Therefore, the answer to the question is: The plot of mass of the gas adsorbed per gram of the adsorbent versus temperature at constant pressure is called an adsorption isobar.
Final Answer:
The plot is called an adsorption isobar.
- The question asks about a specific type of plot related to adsorption, which is the process where gas molecules adhere to the surface of a solid (adsorbent).
- The plot described involves the mass of gas adsorbed per gram of adsorbent on the y-axis and temperature on the x-axis, with the pressure held constant.
- Since the pressure is constant during this process, we refer to this condition as "isobaric." The term "isobar" means constant pressure.
- When we plot the mass of gas adsorbed per gram of adsorbent against temperature at constant pressure, this specific type of plot is referred to as an "adsorption isobar."
- Therefore, the answer to the question is: The plot of mass of the gas adsorbed per gram of the adsorbent versus temperature at constant pressure is called an adsorption isobar.
The plot is called an adsorption isobar.
Topper's Solved these Questions
- BOOK - PRADEEPCHAPTER - SURFACE CHEMISTRY EXERCISE - CONCEPTUAL QUESTIONS39videos
SURFACE CHEMISTRY
- BOOK - PRADEEPCHAPTER - SURFACE CHEMISTRY EXERCISE - NCERT (QUESTIONS AND EXERCISE) (WITH ANSWERS)8videos
SURFACE CHEMISTRY
- BOOK - PRADEEPCHAPTER - SURFACE CHEMISTRY EXERCISE - TEST YOUR GRIP (MULTIPLE CHOICE QUESTIONS)14videos
SURFACE CHEMISTRY
- BOOK - PRADEEPCHAPTER - SOME BASIC CONCEPTS OF CHEMISTRYEXERCISE - Competition (FOCUS) JEE (Main and Advanced)/Medical Entrance SPECIAL (VIII. Assertion-Reason Type Questions)(Type II)13videos
SOME BASIC CONCEPTS OF CHEMISTRY
Similar Questions
A plot of mass of the gas adsorbed per gram of the adsorbent varsus pressure at constant temperature is called…………
View SolutionA graph between the amount of gas adsorbed per gram of the absorbent and equilibrium pressure of the adsorbate at constant temperature is called ................. .
View Solution
Knowledge Check
- Question 1 - Select One
The relationship between equilibrium pressure of a gas and its amount adsorbed per unit mass of the solid adsorbent in constant temperature is called _______.
Achemisorption isochoreBadsorption isobarCadsorption isothermDphysical adsorption isobar - Question 2 - Select One
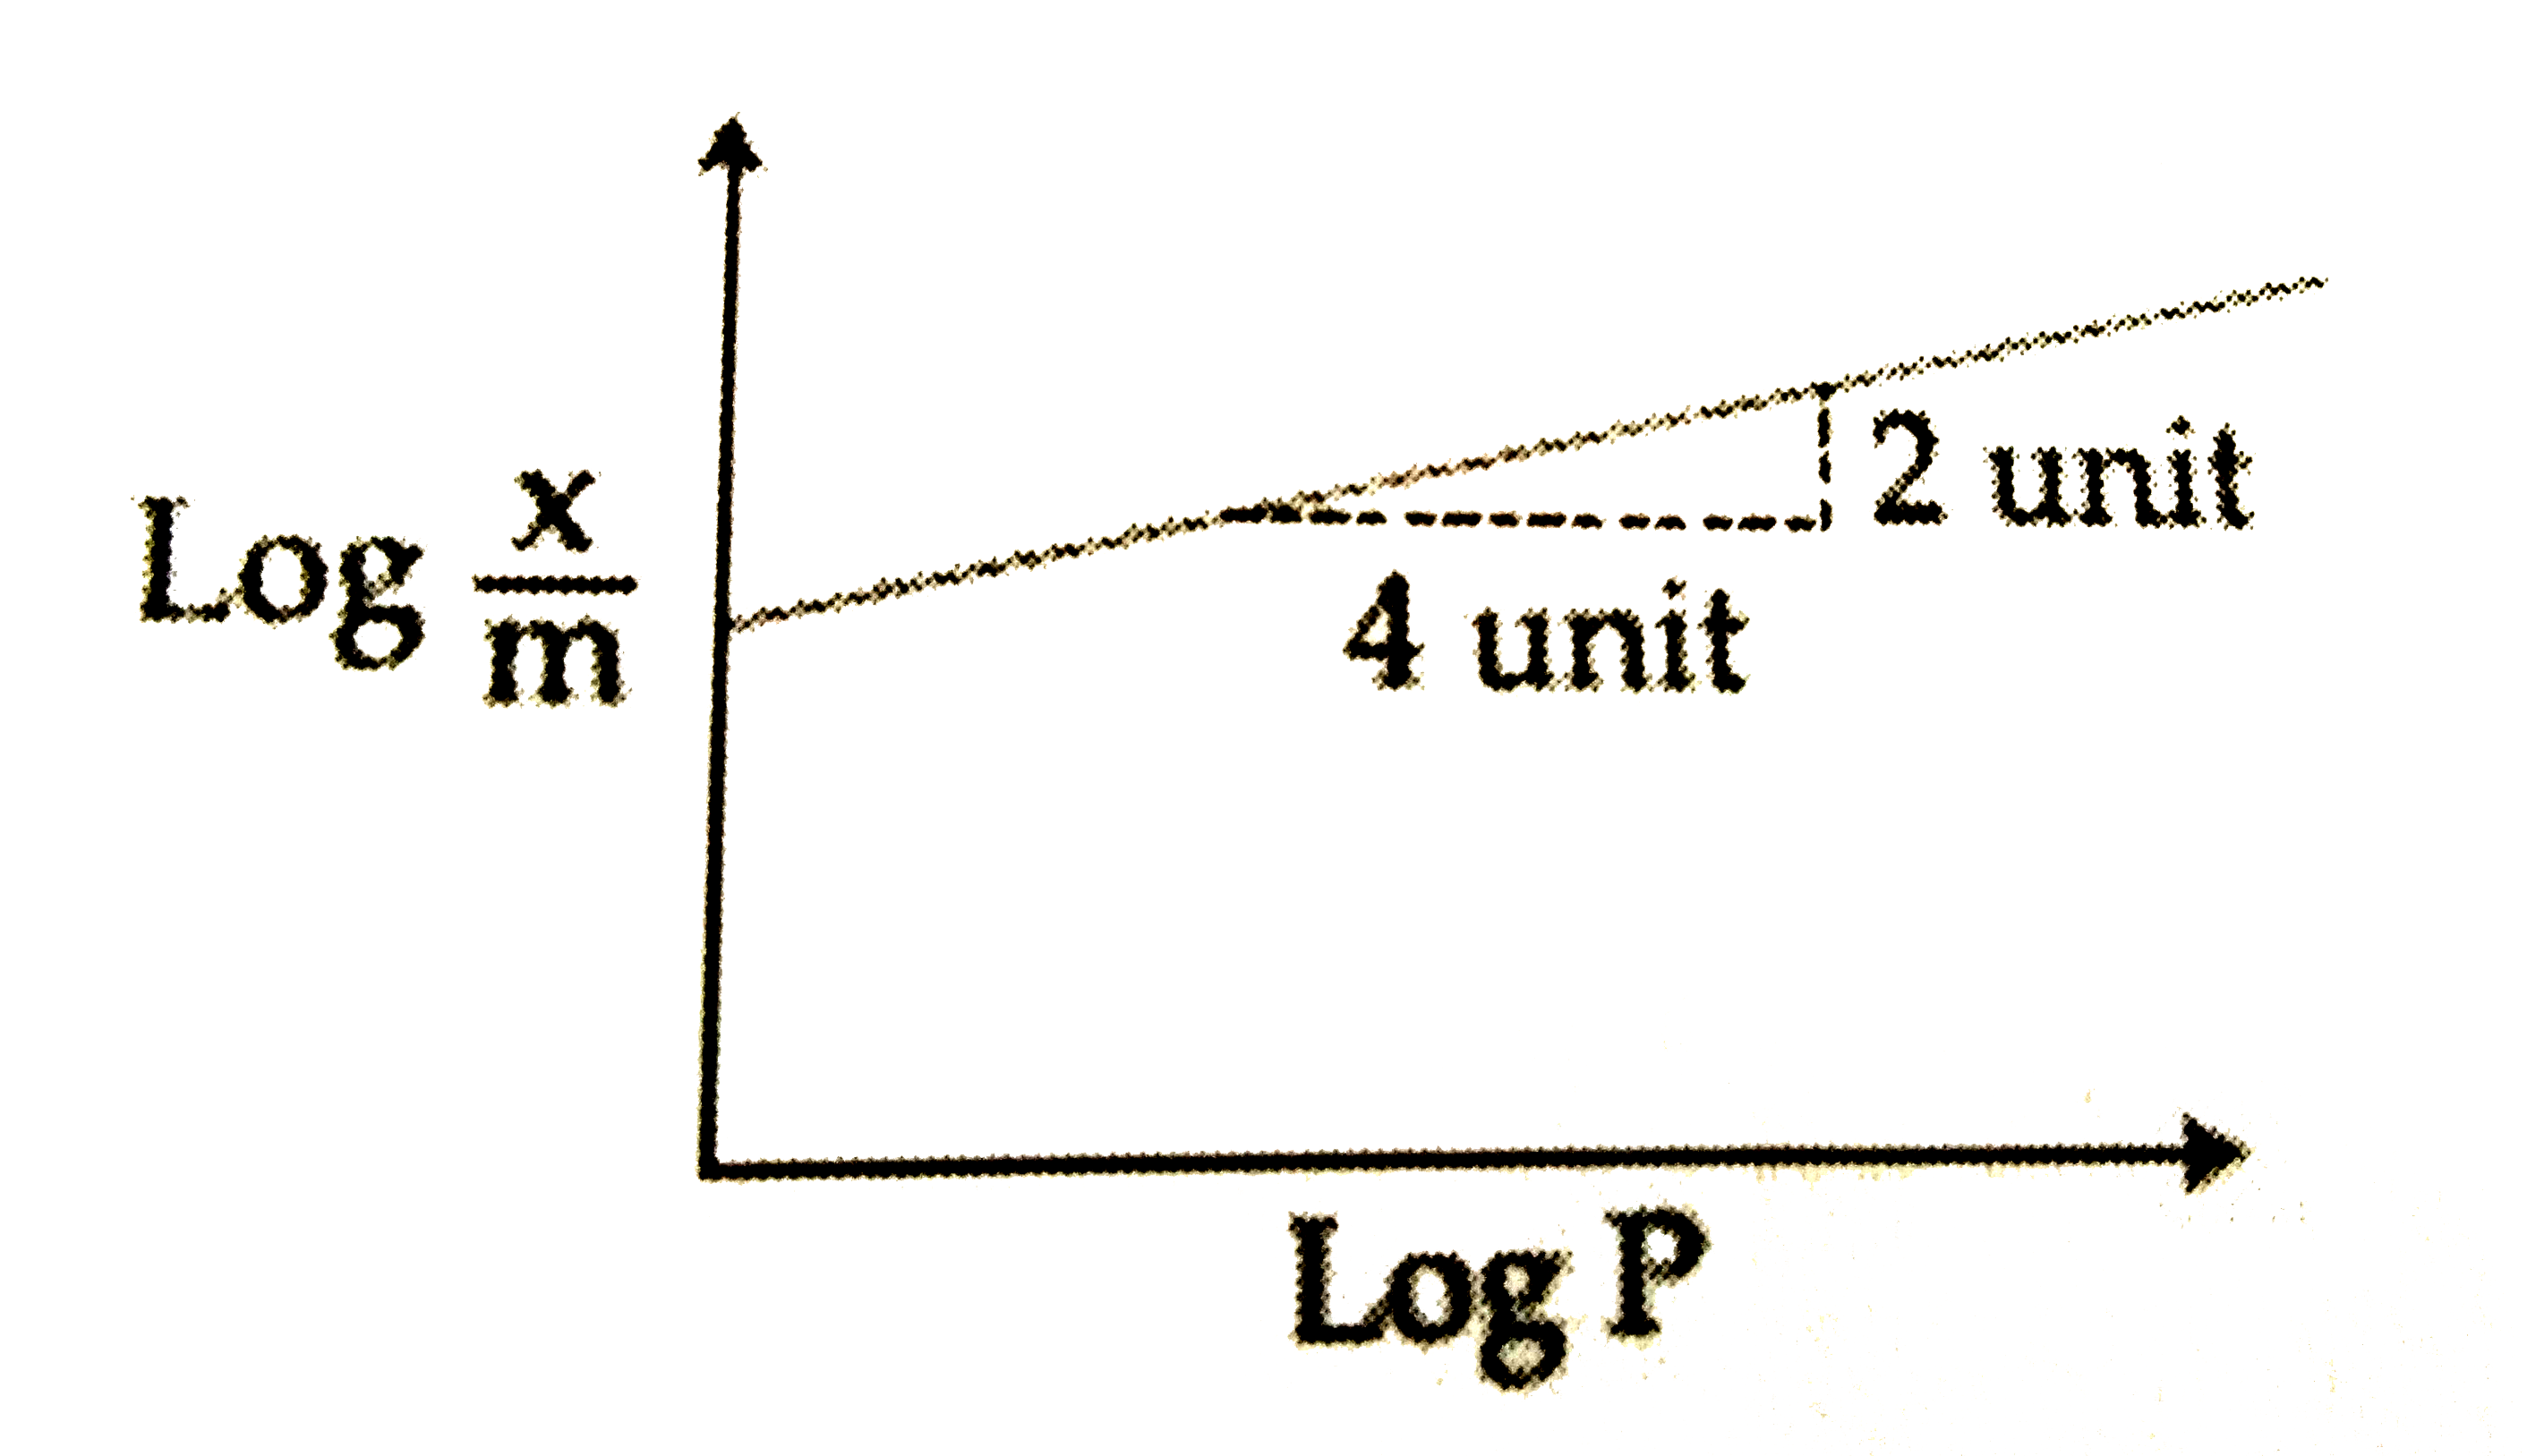
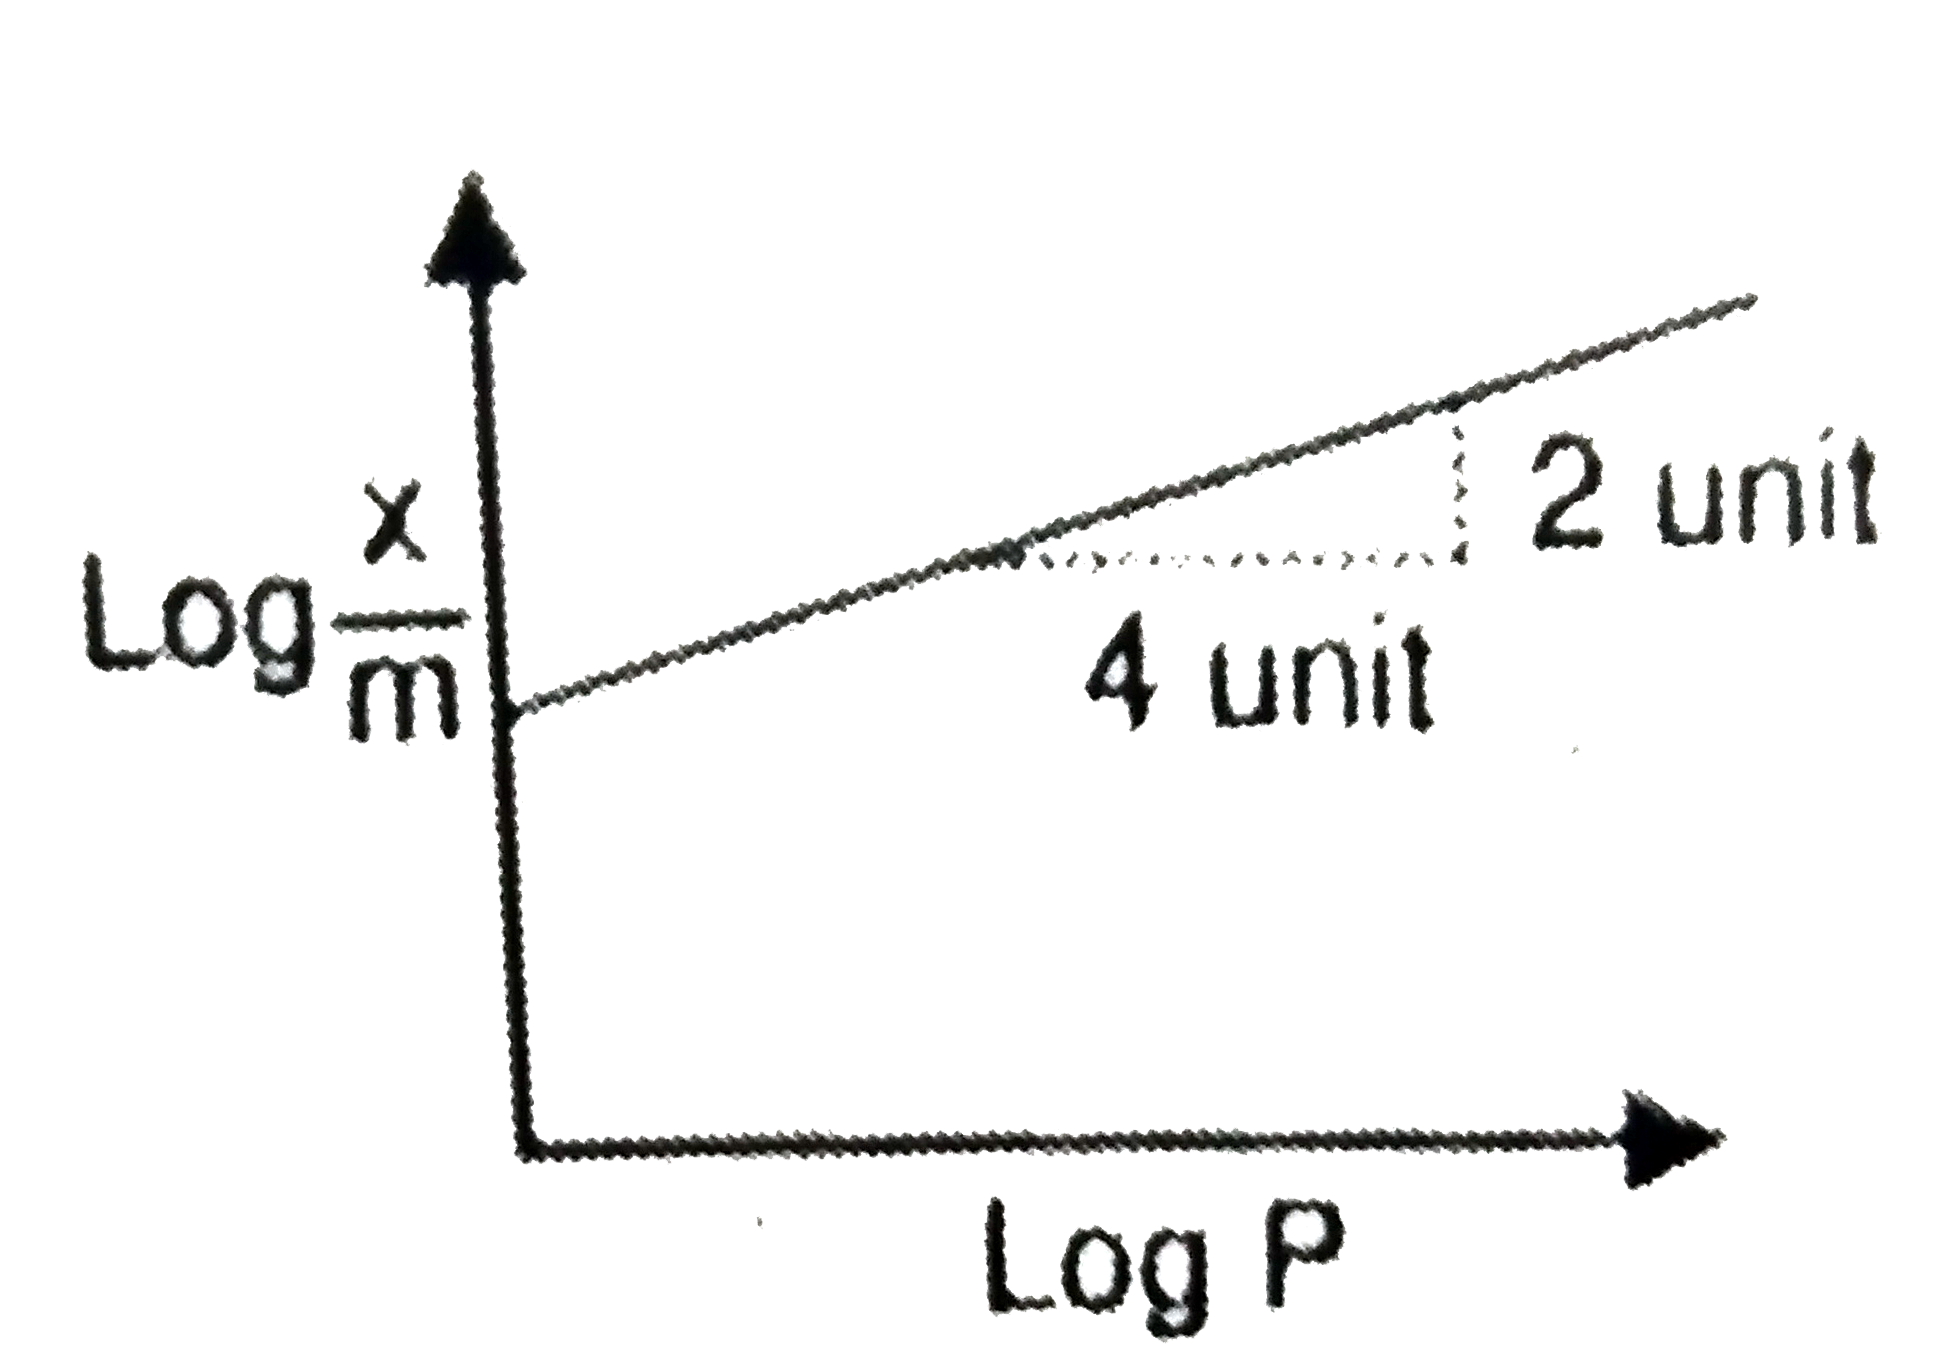
Adsorption of a gas follows Freundlich adsorption isotherm. In the given plot,x is the mass of the gas adsorbed on mass m of the adsorbent at pressure P. xm is proportional to:
 AP14BP2CPDP12
 - Question 3 - Select One
Adsorption of a gas follows Freundlich adsorption isotherm. In the given plot, x is the mass of the gas adsorbed on mass m of the adsorbent at pressure p. xm is proportional to :
 Ap2BpCp1/2Dp1/4
Adsorption of a gas follows Freundlich adsorption isotherm. In the given plot,x is the mass of the gas adsorbed on mass m of the adsorbent at pressure P. xm is proportional to:
 View Solution
Assertion: The plot of volume (V) versus pressure (P) at constant temperature is a hyperbola in the first quadrant.
Reason: V∝1/P at constant temperature.View SolutionFor freundlich adsorption isotherm, a plot of log ( x/m) ( y - axis ) and log p (x-axis) gives a straight line . The intercept and slope for the line is 0.4771 and 2, respectively . The mass of gas , adsorbed per gram of adsorbent if the intital pressure is 0.04 atm , is ________ ×10−4 g.
(log 3=0.4771).View SolutionThe adsorption isotherm for a gas is given by the relation x=ap/(1+bp) where x is mole of gas adsorbed per gram of the adsorbent, p is the pressure of the gas, and a and b are constants. Then x
View SolutionAdsorption of gas follows Freundlich adsorption isotherm. If x is the mass of the gas adsorbed on mass m of the adsrobent , the correct plot of xm versus p is :
View Solution

