In the given figure,
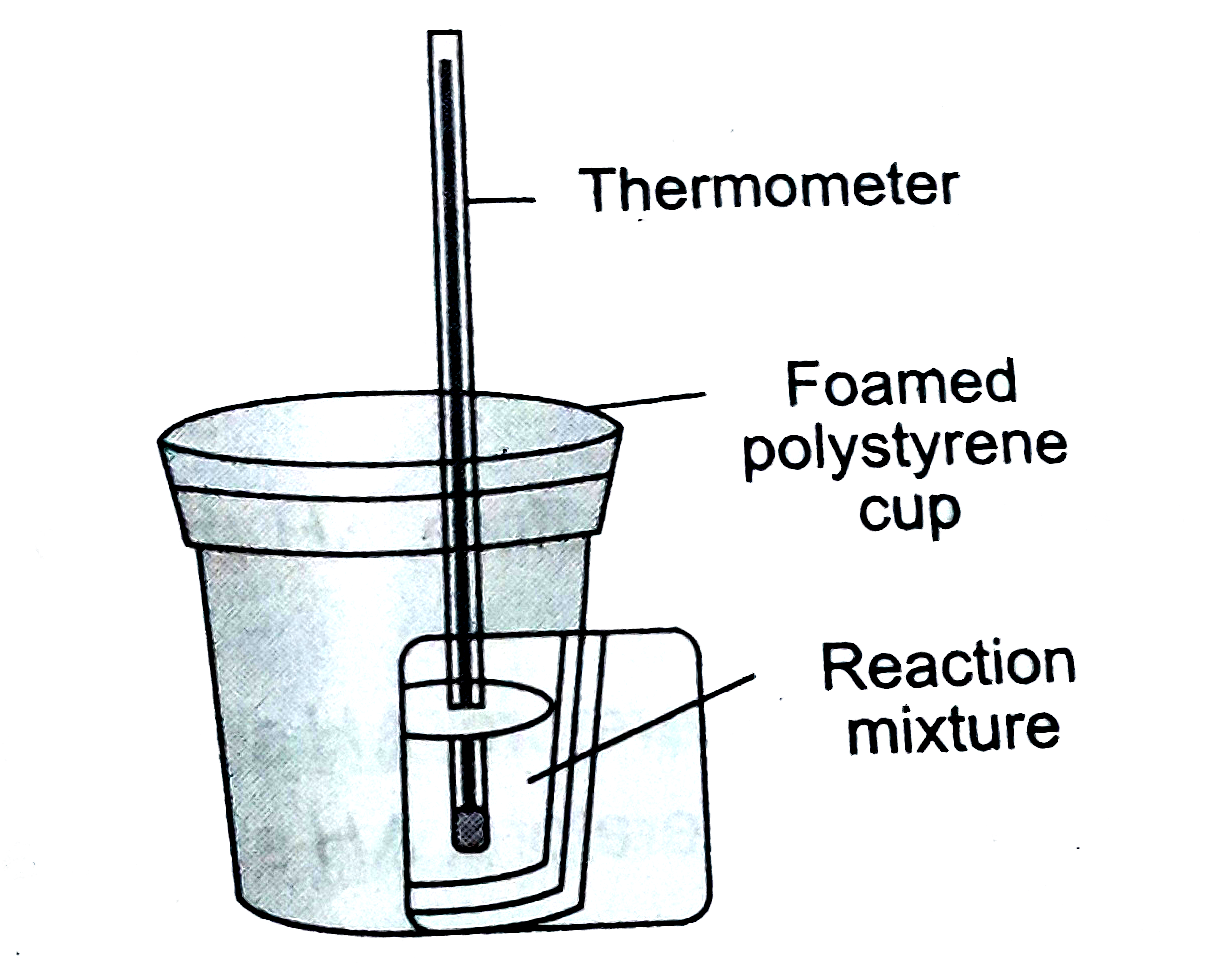
What does the above figure represent?
A
Calorimeter for measuring heat changes at constant volume
B
Bom calorimeter for measuring heat changes at constant volume
C
Calorimeter for measuring heat changes at constant pressure
D
none of these
Text Solution
The correct Answer is:C
The given figure represents the measurement of heat change at constant pressure (generally under atmospheric pressure). This can be done in calorimeter.
|
Topper's Solved these Questions
- CHEMICAL THERMODYNAMICS AND ENERGETICBOOK - MHTCET PREVIOUS YEAR PAPERS AND PRACTICE PAPERSCHAPTER - CHEMICAL THERMODYNAMICS AND ENERGETICEXERCISE - MHT CET Corner
40 Videos
- CHEMICAL THERMODYNAMICS AND ENERGETICBOOK - MHTCET PREVIOUS YEAR PAPERS AND PRACTICE PAPERSCHAPTER - CHEMICAL THERMODYNAMICS AND ENERGETICEXERCISE - Exercise 1
88 Videos
- CHEMICAL KINETICS BOOK - MHTCET PREVIOUS YEAR PAPERS AND PRACTICE PAPERSCHAPTER - CHEMICAL KINETICS EXERCISE - MHT CET CORNER
20 Videos
- CHEMISTRY IN EVERYDAY LIFE BOOK - MHTCET PREVIOUS YEAR PAPERS AND PRACTICE PAPERSCHAPTER - CHEMISTRY IN EVERYDAY LIFE EXERCISE - MHT CET CORNER
11 Videos
Similar Questions
Knowledge Check
What does the given figure represent?
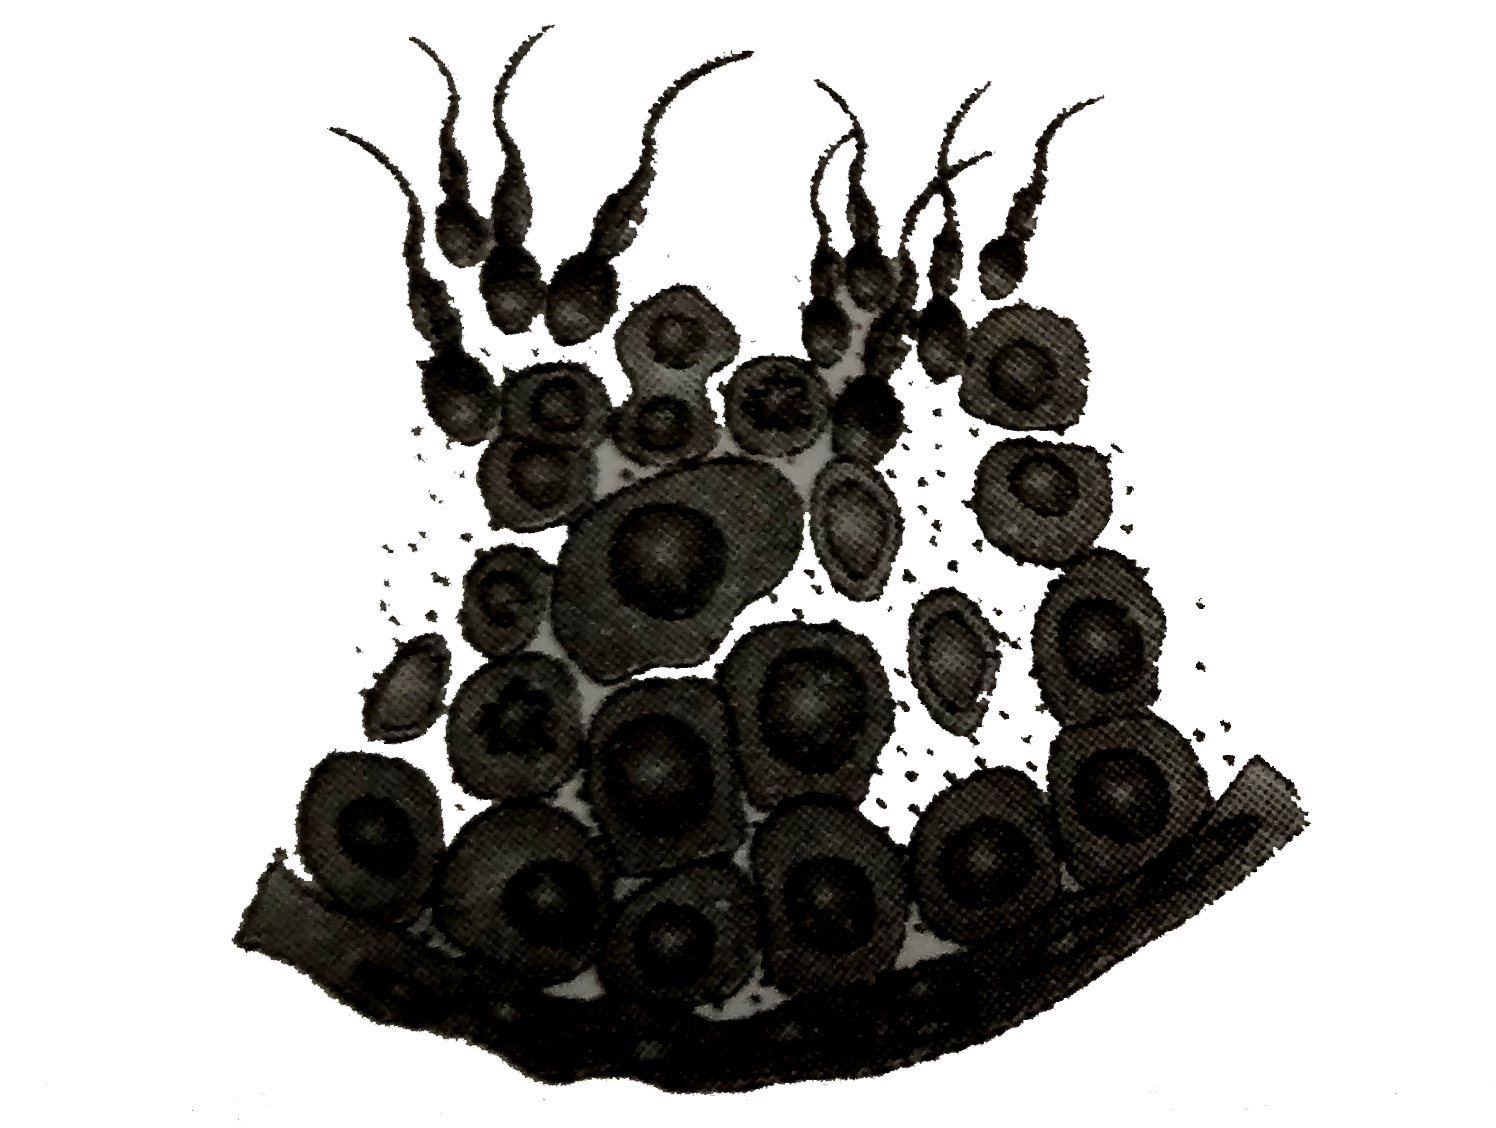 ASectional view of ovaryBSectional view of seminiferous tubuleCL.S. of testisDMature Graadian follicle
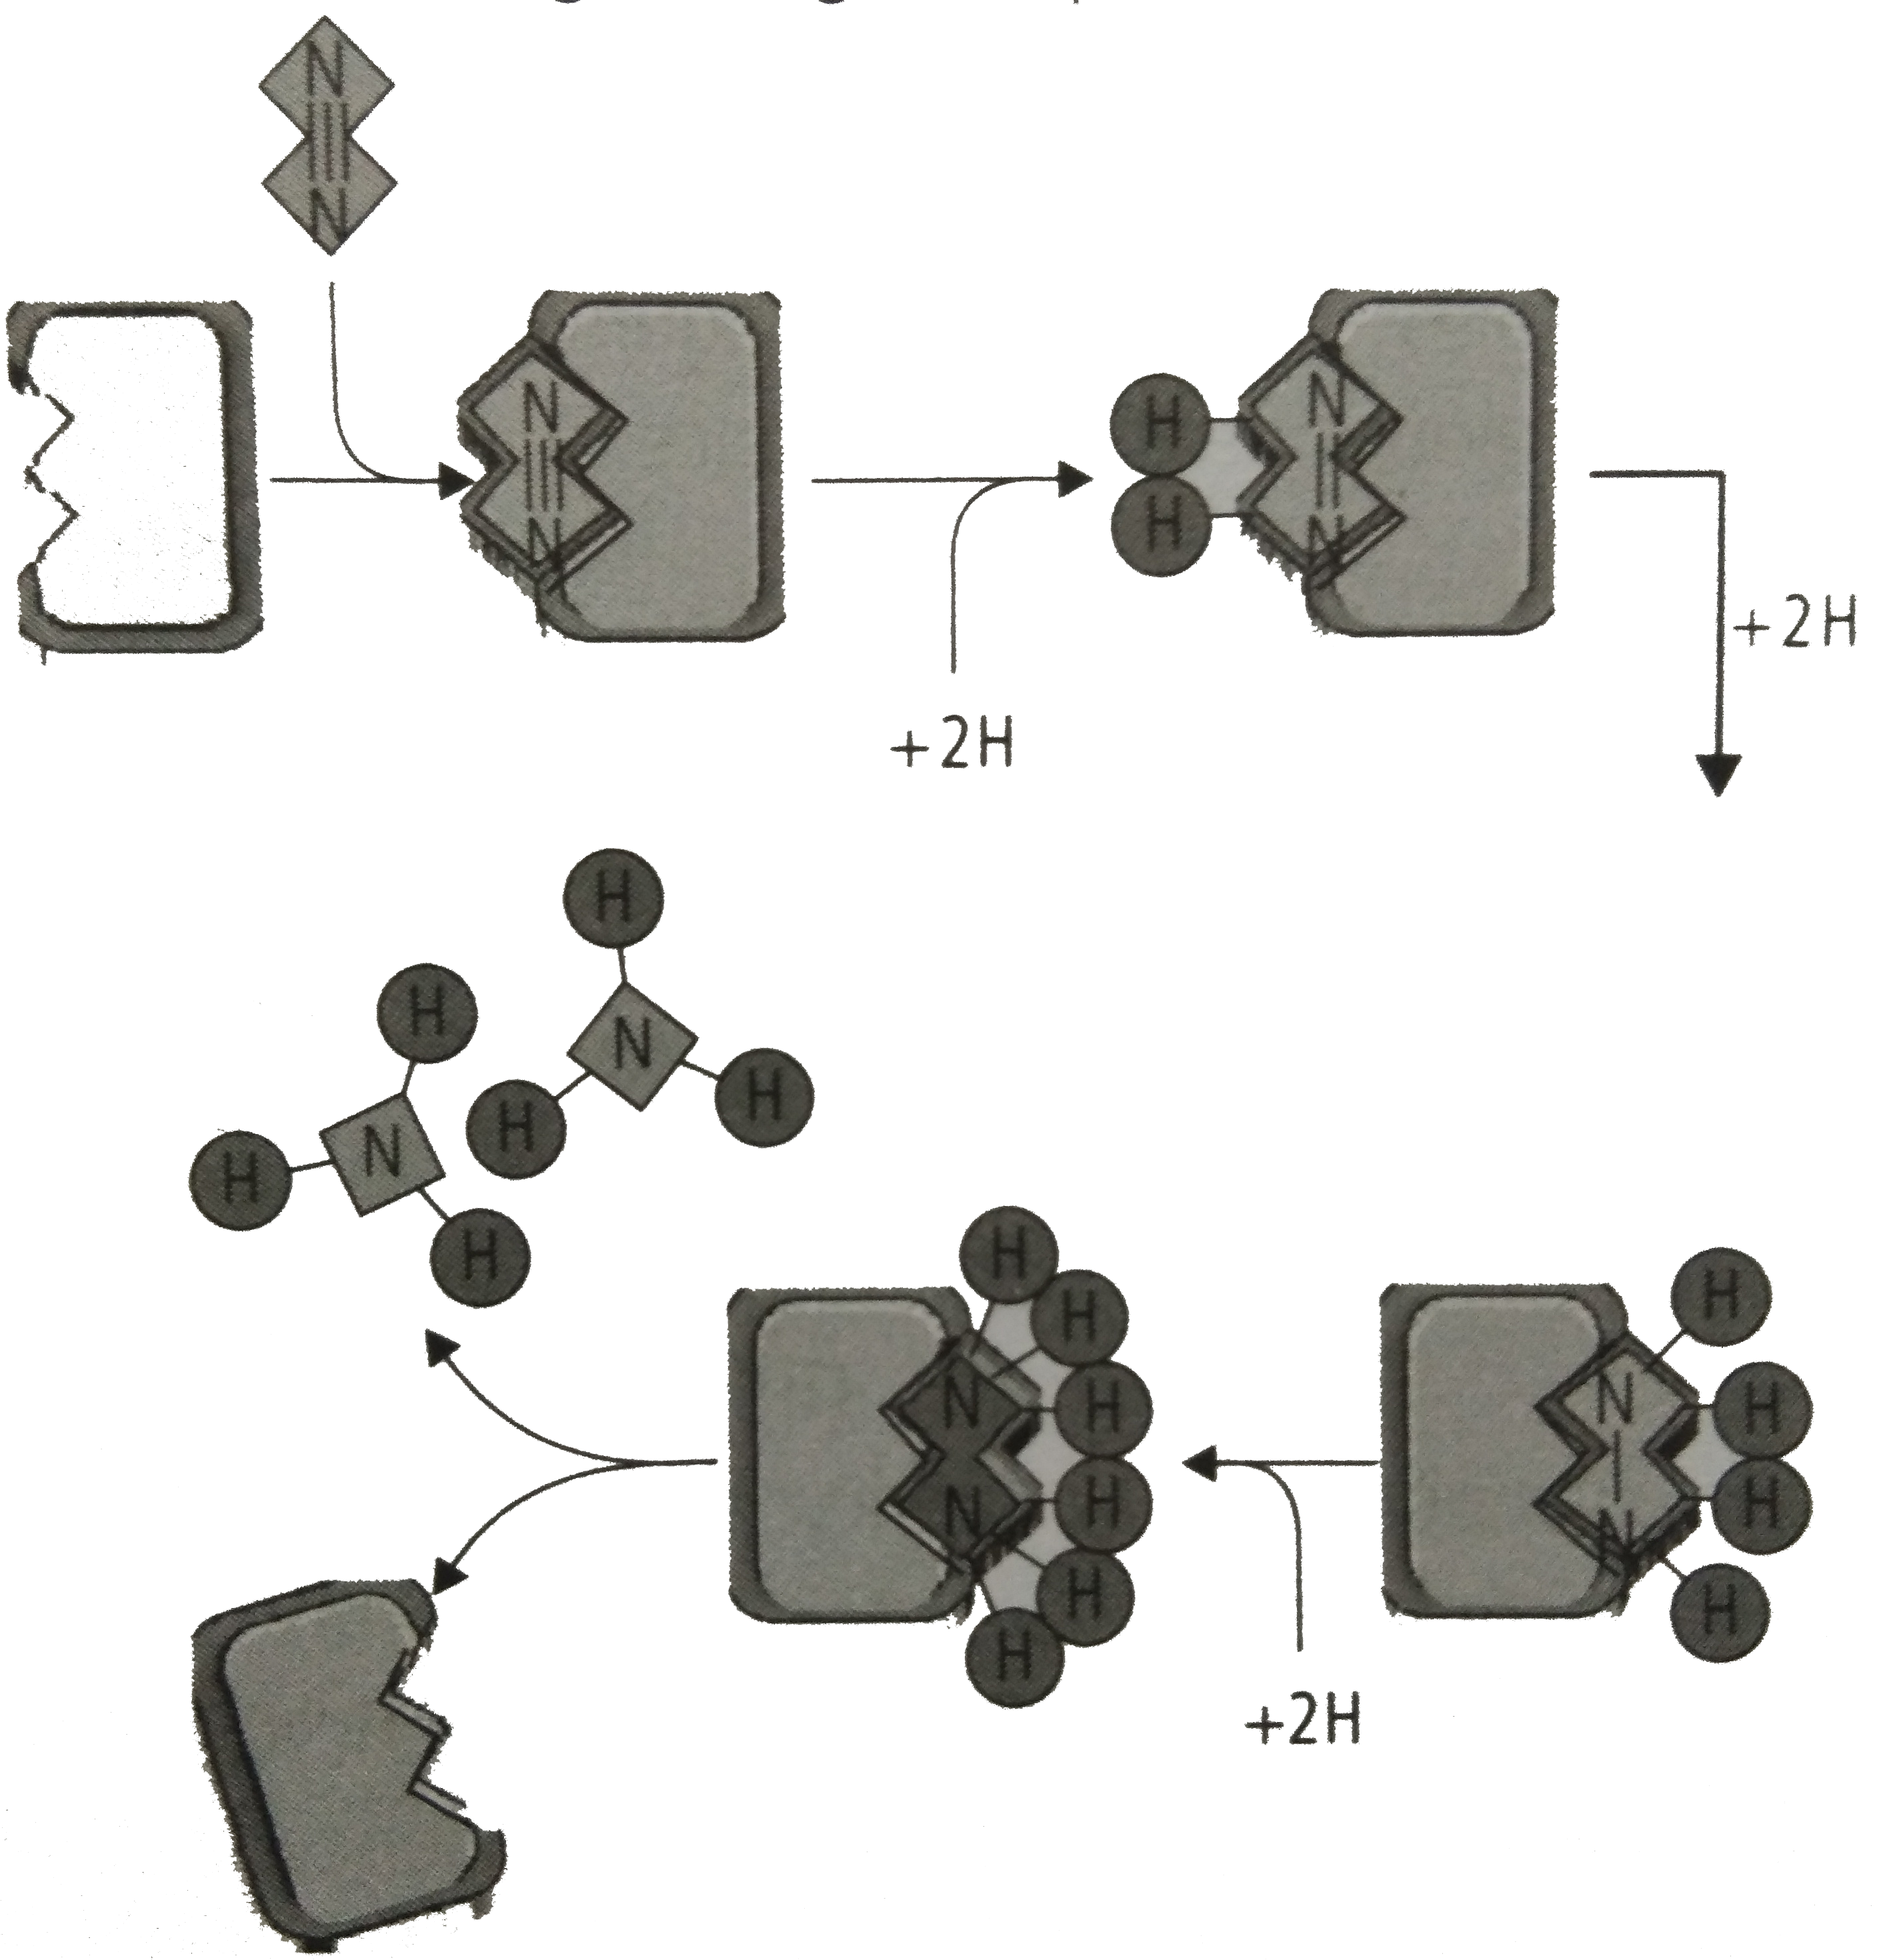
What does the given figure represent?ANitrogen fixationBDenitrificationCAmmonificationDNitrificationWhat does the given figure represent?
 ASectional view of ovaryBSectional view of seminiferous tubuleCL.S. of testisDMature Graafian follicle

