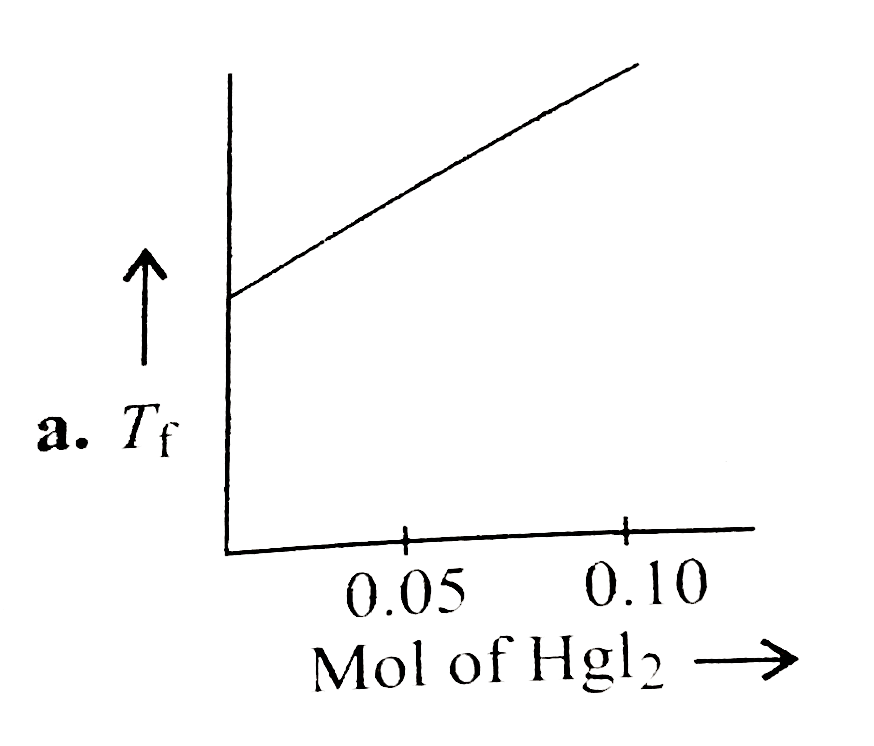
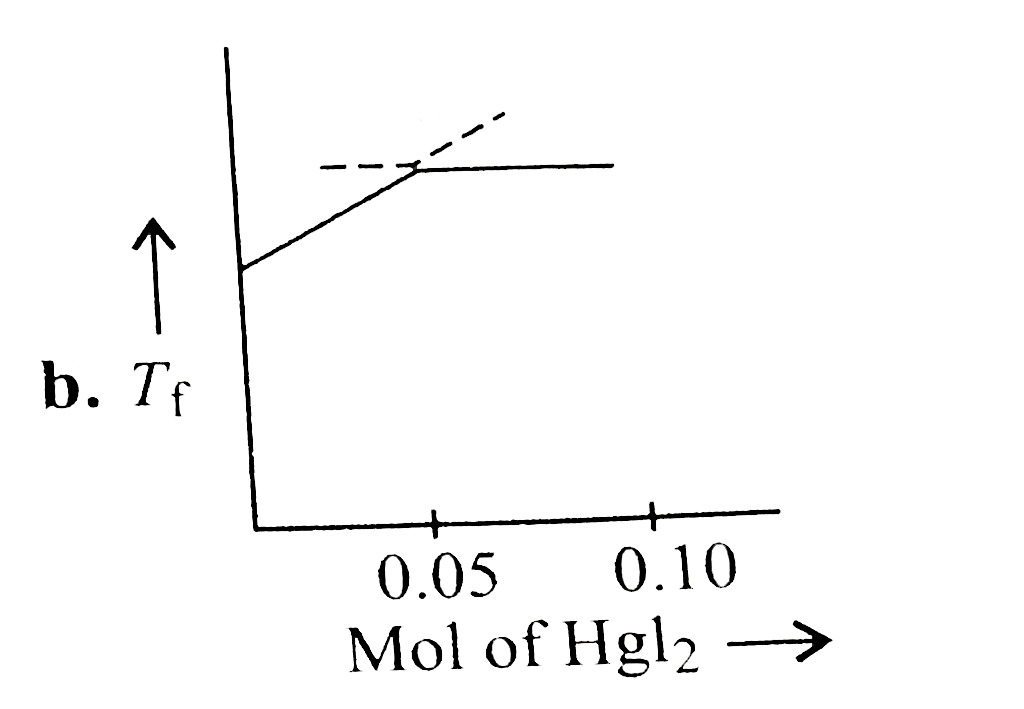
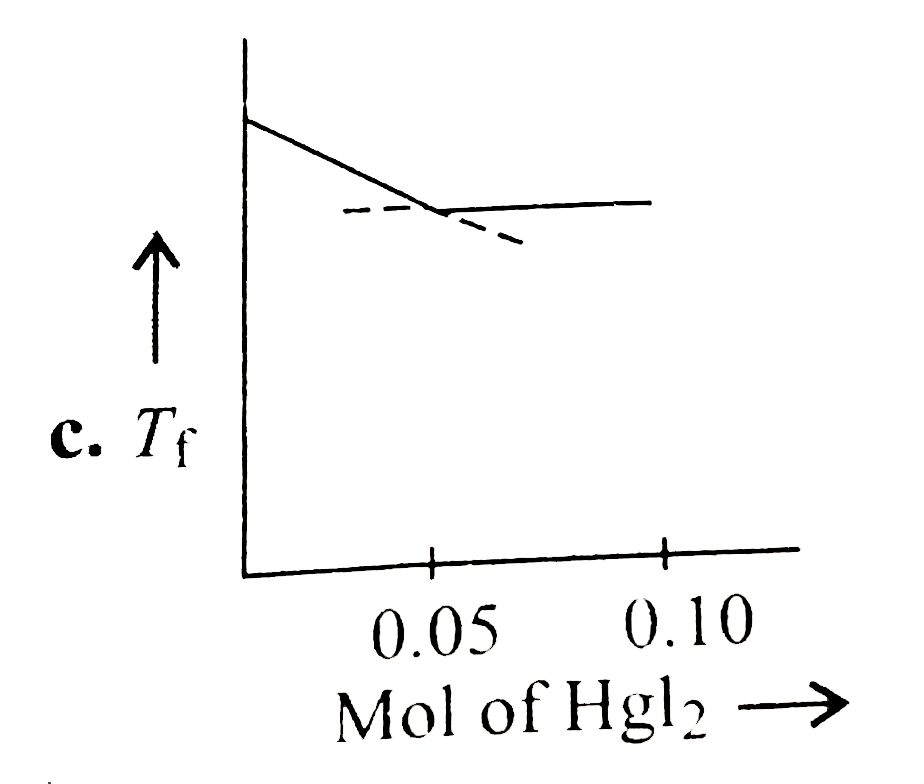
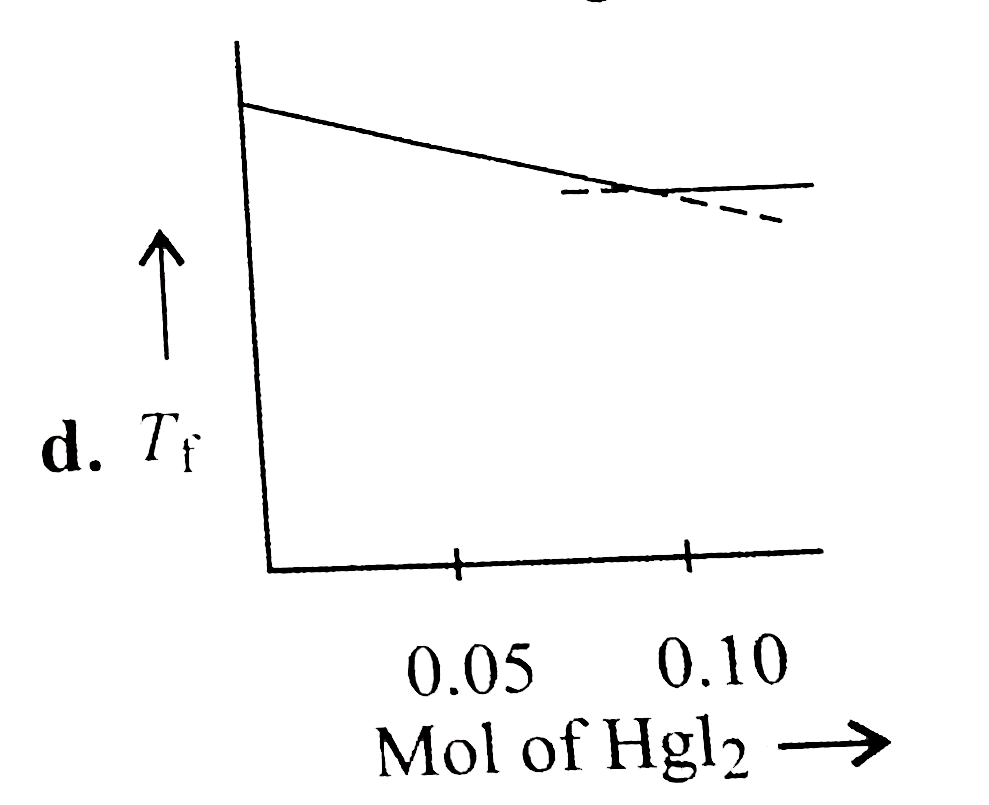
Increasing amount of solid Hgl2 is added to 1L of an aqueous solution containing 0.1molKI. Which fo the following graphs do represent the variation of freezing point of the resulting with the amount of Hgi2 added?


The correct Answer is:B
To solve the problem, we need to analyze how the freezing point of the solution changes as we add increasing amounts of solid HgI2 to a solution of KI. Here’s a step-by-step breakdown of the solution:
Step 1: Understand the Initial Solution
We start with a 1 L aqueous solution containing 0.1 mol of KI. KI is a strong electrolyte that dissociates completely in solution:
KI→K++I−
This means that for 0.1 mol of KI, we have 0.1 mol of K⁺ ions and 0.1 mol of I⁻ ions.
Step 2: Determine the Effect of Adding HgI2
When we add solid HgI2 to the solution, it reacts with the iodide ions (I⁻) from KI to form the complex ion:
HgI2+2I−→HgI2−4
This reaction consumes iodide ions and forms a complex, which effectively reduces the number of free I⁻ ions in the solution.
Step 3: Calculate the Van't Hoff Factor (i)
The Van't Hoff factor (i) is a measure of the degree of dissociation of a solute in solution. For KI, since it dissociates into two ions, i = 2. However, as HgI2 is added and reacts with I⁻, the effective concentration of I⁻ decreases, which means that the effective i will be less than 2.
Step 4: Freezing Point Depression
The freezing point depression (ΔTf) is given by the formula:
ΔTf=i⋅Kf⋅m
where:
- Kf is the freezing point depression constant,
- m is the molality of the solution.
As we add HgI2, initially, the freezing point will decrease because the effective concentration of ions increases due to the dissociation of KI. However, once all the I⁻ ions are consumed (when the reaction with HgI2 is complete), the addition of more HgI2 will not change the freezing point anymore since HgI2 does not dissociate further in the solution (it behaves as a non-electrolyte).
Step 5: Graphical Representation
- Initially, as we add HgI2, the freezing point decreases.
- After all the I⁻ ions are consumed, the freezing point will stabilize and remain constant despite the addition of more HgI2.
Conclusion
The graph that represents this behavior will show a decrease in freezing point initially, followed by a plateau where the freezing point remains constant as more HgI2 is added. The correct answer is option C.
We start with a 1 L aqueous solution containing 0.1 mol of KI. KI is a strong electrolyte that dissociates completely in solution:
KI→K++I−
This means that for 0.1 mol of KI, we have 0.1 mol of K⁺ ions and 0.1 mol of I⁻ ions.
When we add solid HgI2 to the solution, it reacts with the iodide ions (I⁻) from KI to form the complex ion:
HgI2+2I−→HgI2−4
This reaction consumes iodide ions and forms a complex, which effectively reduces the number of free I⁻ ions in the solution.
The Van't Hoff factor (i) is a measure of the degree of dissociation of a solute in solution. For KI, since it dissociates into two ions, i = 2. However, as HgI2 is added and reacts with I⁻, the effective concentration of I⁻ decreases, which means that the effective i will be less than 2.
The freezing point depression (ΔTf) is given by the formula:
ΔTf=i⋅Kf⋅m
where:
- Kf is the freezing point depression constant,
- m is the molality of the solution.
- Initially, as we add HgI2, the freezing point decreases.
- After all the I⁻ ions are consumed, the freezing point will stabilize and remain constant despite the addition of more HgI2.
The graph that represents this behavior will show a decrease in freezing point initially, followed by a plateau where the freezing point remains constant as more HgI2 is added. The correct answer is option C.
Topper's Solved these Questions
- BOOK - CENGAGE CHEMISTRY ENGLISHCHAPTER - SOLUTIONSEXERCISE - Ex 2.2 (Objective)9videos
SOLUTIONS
- BOOK - CENGAGE CHEMISTRY ENGLISHCHAPTER - SOLID STATEEXERCISE - Ex 1.2 (Objective)9videos
SOLID STATE
- BOOK - CENGAGE CHEMISTRY ENGLISHCHAPTER - SURFACE CHEMISTRYEXERCISE - Archives Subjective2videos
SURFACE CHEMISTRY
Similar Questions
Which of the following graph represents the variation of amount of chemisorption of a gas by a solid with temperature under constant pressure?
View SolutionWhich one of the following aqueous solution has the highest freezing point at 1 atm:
View SolutionWhich of the following 0.1M aqueous solutions will have the lowest freezing point?
View SolutionWhich of the following 0.2m aqueous solutions will show minimum freezing point :-
View SolutionAqueous solution containing 1 mol of borax raects with 2 mol of acids. This is because of:
View SolutionThe amount of suga (C12H22O11) required to prepare 2L of its 0.1 M aqueous solution is
View Solution0.5 molal aqueous solution of a weak acid (HX) is 20% ionised. If Kf for water is 1.86Kkgmol−1, the lowering in freezing point of the solution is
View SolutionTo aqueous solution of Nal increasing amounts of solid HgI2 is added. The vapor pressure of the solution
View SolutionThe amount of urea required to prepare 1L of its 0.1 M aqueous solution is _______ g.
View SolutionAdding powdered Pb and Fe to a solution containing 1.0M each of Pb+2andFe+2 ions would result in the formation of :
View Solution

