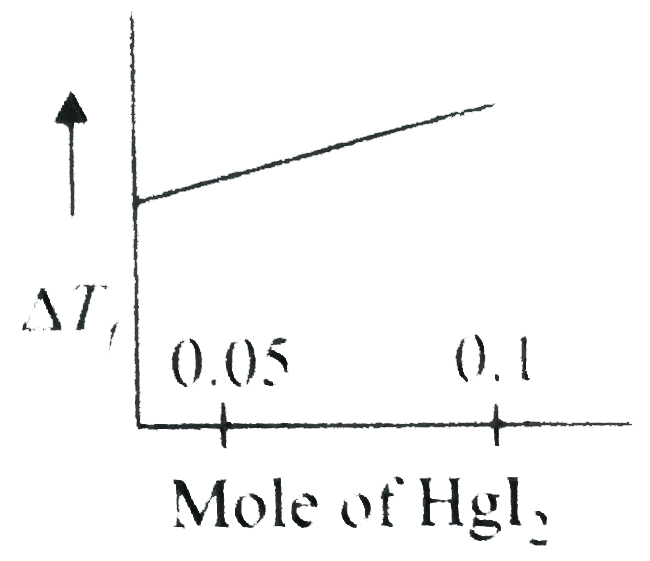
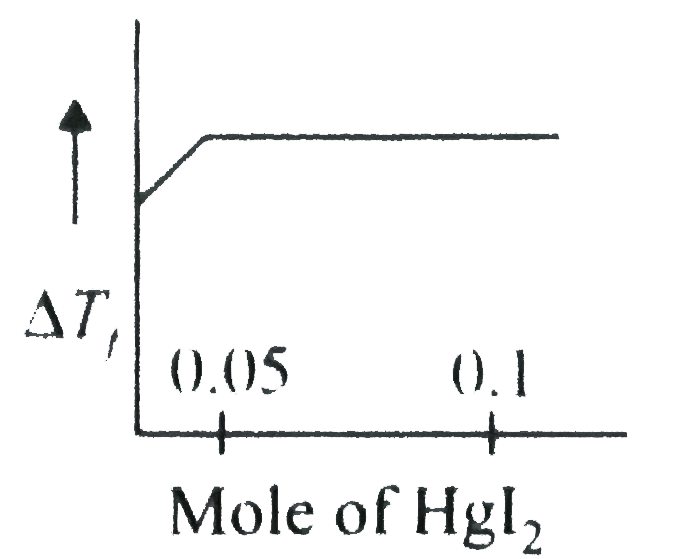
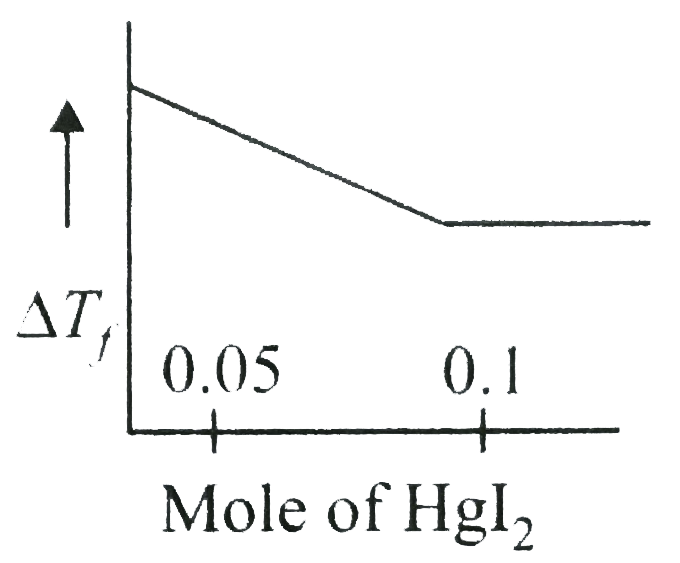
Increasing amoutn of HgI2is added to 1 litre of an aqueous solution containing0.1mole of KI.Which of the following graphs does represent the variation of depression in freezing point of the resulting solution with the amount of HgI2added?
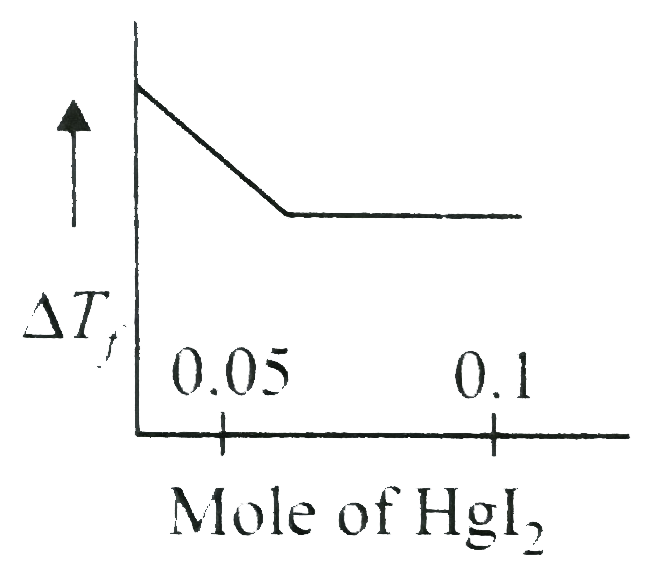
The correct Answer is:C
2KIaq+HgI2(s)→K2HgI4(aq)or2K++2I−+HgI2(s)→2K++[HgI4]2− As a result of complex ion formation, theno. Of mole particles in the solution decreases in the ratio 4:3SoΔTfdecreases until all the I− ions are consumed with0.05 moles of HgI2. The excess of HgI2remain insoluble .Hence after 0.05moles of HgI2, the F.P. of solution remains constant.
Topper's Solved these Questions
- SOLUTIONSBOOK - A2ZCHAPTER - SOLUTIONSEXERCISE - Osmotic Pressure
40 Videos
- SOLUTIONSBOOK - A2ZCHAPTER - SOLUTIONSEXERCISE - Van'T Hoff Factor
37 Videos
- SOLUTIONSBOOK - A2ZCHAPTER - SOLUTIONSEXERCISE - Elevation Of Boiling Point
21 Videos
- SOLID STATEBOOK - A2ZCHAPTER - SOLID STATEEXERCISE - Section D - Chapter End Test
30 Videos
- SURFACE CHEMISTRYBOOK - A2ZCHAPTER - SURFACE CHEMISTRYEXERCISE - Section D - Chapter End Test
30 Videos
Similar Questions
Increasing amount of solid Hgl2 is added to 1L of an aqueous solution containing 0.1molKI. Which fo the following graphs do represent the variation of freezing point of the resulting with the amount of Hgi2 added?
View SolutionWhich of the following aqueous solution will have highest depression in freezing point?
View Solution
Knowledge Check
Increasing amount of solid Hgl2 is added to 1L of an aqueous solution containing 0.1molKI. Which fo the following graphs do represent the variation of freezing point of the resulting with the amount of Hgi2 added?
A B
B C
C D
D
Increasing amount of solid Hgl2 is added to 1L of an aqueous solution containing 0.1molKI. Which fo the following graphs do represent the variation of freezing point of the resulting with the amount of Hgi2 added?
A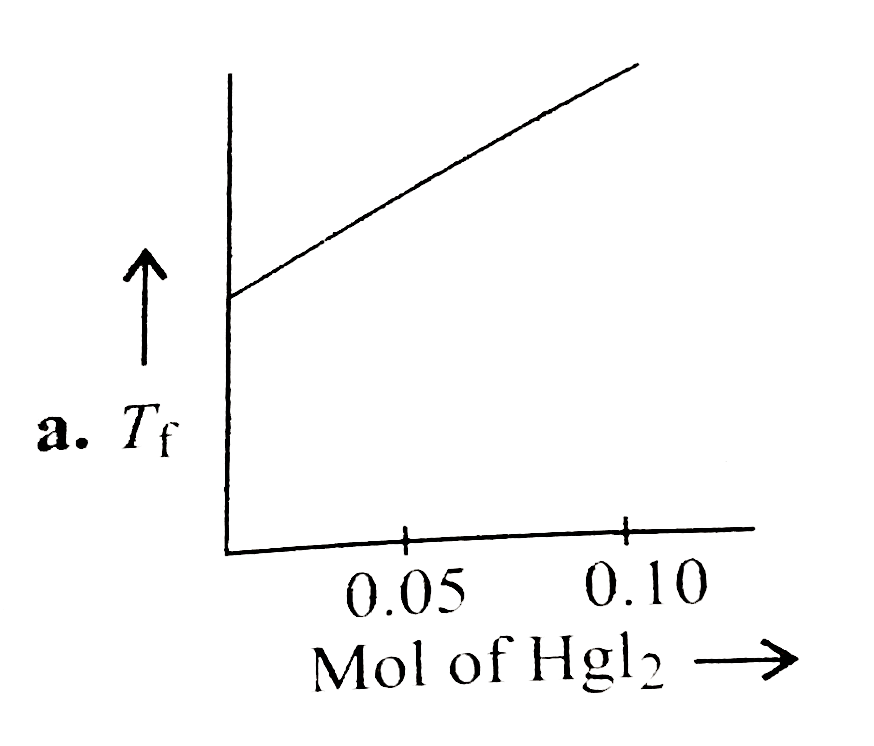 B
B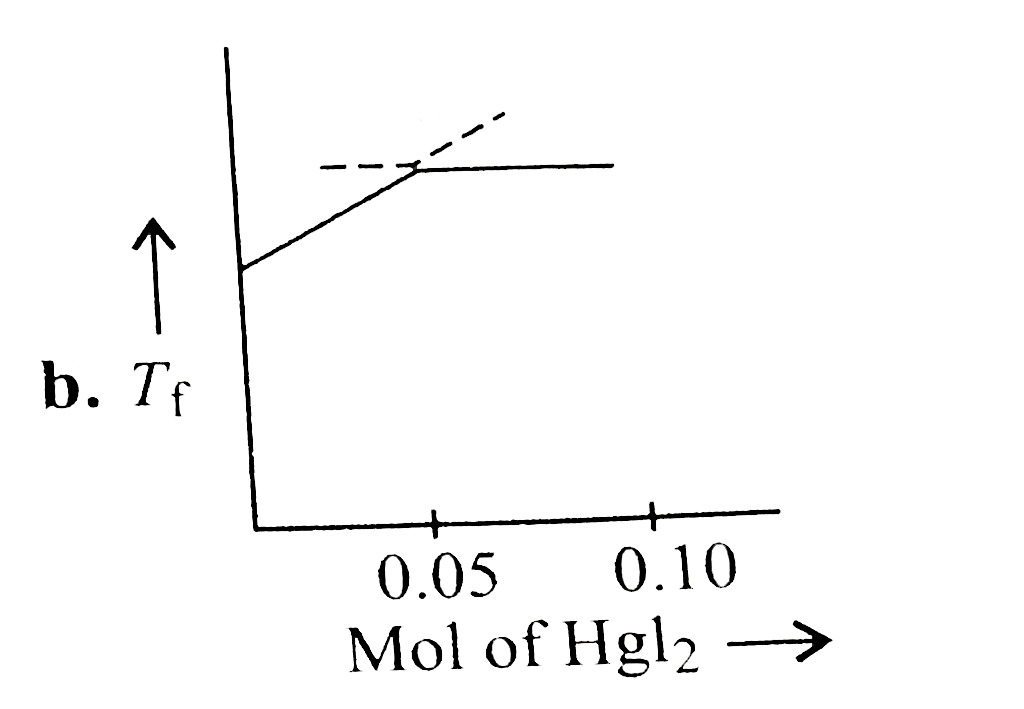 C
C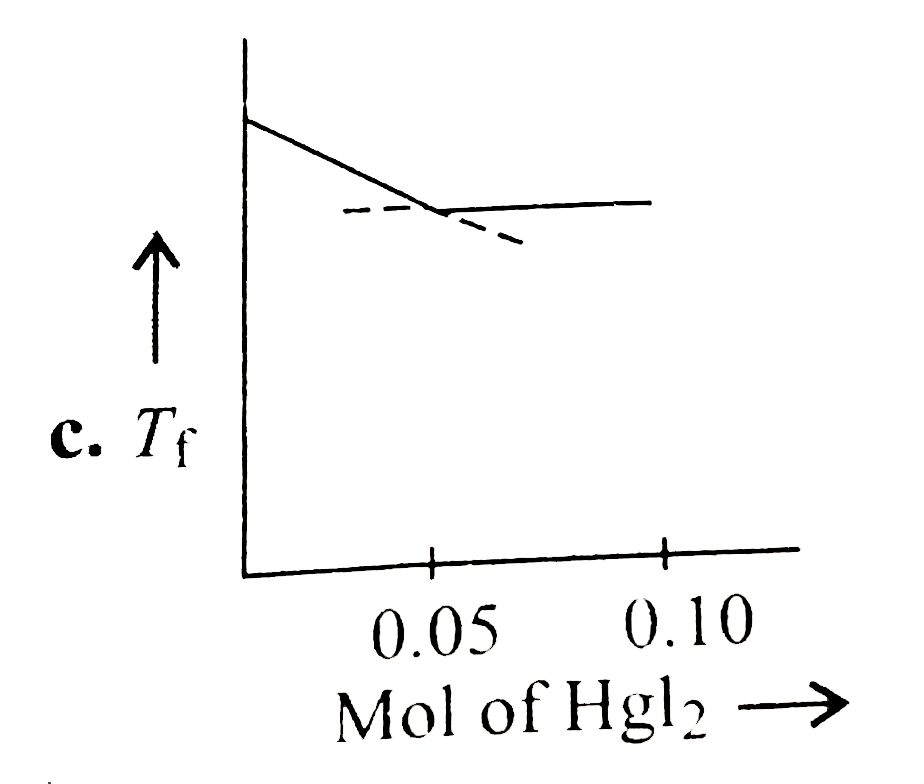 D
D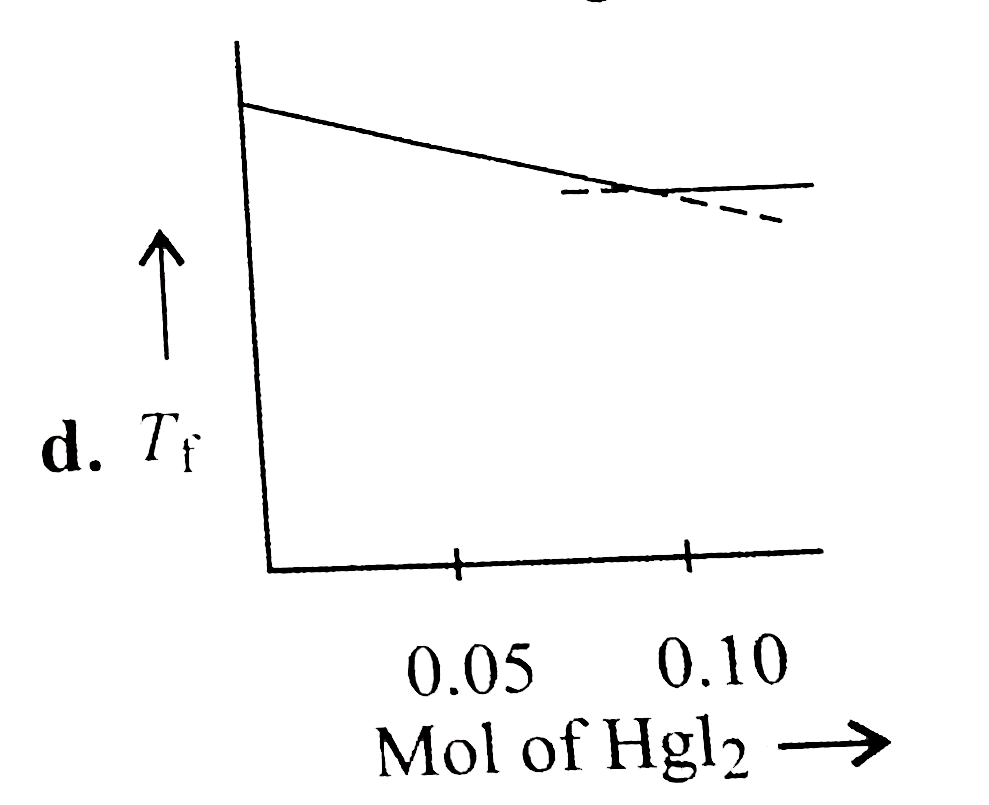
Which of the following aqueous solution will have highest depression in freezing point ?
A0.1 M ureaB0.1 M SucroseC0.1MAlCl3D0.1MK4[Fe(CN)6]
Depression of freezing point of which of the following solutions does represent the cryoscopic constant of water ?
View SolutionDepression of freezing point of which of the following solutions does represent the cryoscopic constant of water ?
View SolutionDepression of freezing point of which of the following solutions does represent the cryoscopic constant of water?
View SolutionWhen HgI2 is added to aqueous solution of KI, which of the following are not correct statements
View SolutionK2HgI4 is 50% ionised in aqueous solution. Which of the following are correct ?
View Solution
