Lather Meyer drew a graph showing the relation between atomic _____ and atomic ____ .
The correct Answer is:Mass, volume
To answer the question regarding Lothar Meyer’s graph, we need to identify the two parameters that he plotted against each other.
1. Identify the Parameters: Lothar Meyer drew a graph to show the relationship between two specific properties of elements. These properties are:
- Atomic Volume
- Atomic Mass
2. Understanding Atomic Volume: Atomic volume is defined as the volume occupied by one mole of an element. It can be calculated using the formula:
Atomic Volume=Atomic MassDensity
This means that atomic volume is dependent on both the atomic mass of the element and its density.
3. Graph Characteristics: In the graph, atomic mass is typically plotted on the x-axis, while atomic volume is plotted on the y-axis. This allows for the visualization of how atomic volume changes with increasing atomic mass.
4. Observations from the Graph:
- The peaks of the graph correspond to alkali metals (like lithium, sodium, potassium).
- The descending positions are occupied by alkaline earth metals.
- The minima of the graph correspond to transition elements.
- The ascending positions are occupied by halogens.
5. Final Answer: Therefore, the blanks in the question can be filled as follows:
- Lothar Meyer drew a graph showing the relation between atomic volume and atomic mass.
- Atomic Volume
- Atomic Mass
Atomic Volume=Atomic MassDensity
This means that atomic volume is dependent on both the atomic mass of the element and its density.
- The peaks of the graph correspond to alkali metals (like lithium, sodium, potassium).
- The descending positions are occupied by alkaline earth metals.
- The minima of the graph correspond to transition elements.
- The ascending positions are occupied by halogens.
- Lothar Meyer drew a graph showing the relation between atomic volume and atomic mass.
Topper's Solved these Questions
- PERIODIC CLASSIFICATION OF ELEMENTS AND GENERAL INORGANIC CHEMISTRYBook:CENGAGE CHEMISTRY ENGLISHChapter:PERIODIC CLASSIFICATION OF ELEMENTS AND GENERAL INORGANIC CHEMISTRYExercise:Exercises (True/False)
Explore 10 Videos
- PERIODIC CLASSIFICATION OF ELEMENTS AND GENERAL INORGANIC CHEMISTRYBook:CENGAGE CHEMISTRY ENGLISHChapter:PERIODIC CLASSIFICATION OF ELEMENTS AND GENERAL INORGANIC CHEMISTRYExercise:Exercises (Archives ) Multiple Correct
Explore 3 Videos
- PERIODIC CLASSIFICATION OF ELEMENTS AND GENERAL INORGANIC CHEMISTRYBook:CENGAGE CHEMISTRY ENGLISHChapter:PERIODIC CLASSIFICATION OF ELEMENTS AND GENERAL INORGANIC CHEMISTRYExercise:Exercises (Integer)
Explore 13 Videos
- P-BLOCK GROUP 14 - CARBON FAMILYBook:CENGAGE CHEMISTRY ENGLISHChapter:P-BLOCK GROUP 14 - CARBON FAMILYExercise:Exercises Archives (Subjective)
Explore 9 Videos
- PURIFICATION OF ORGANIC COMPOUNDS AND QUALITATIVE AND QUANTITATIVE ANALYSISBook:CENGAGE CHEMISTRY ENGLISHChapter:PURIFICATION OF ORGANIC COMPOUNDS AND QUALITATIVE AND QUANTITATIVE ANALYSISExercise:Assertion Reasoning Type
Explore 5 Videos
Similar Questions
Write the relation between atomic mass and equivalent weight?
View SolutionWhat is the relation between acid strength and atomic number of central atom?
View SolutionState three differences between an atom and an ion.
View SolutionExpress the relation between atomic radius (r) and edge length (a) in b.c.c. unit cell.
View SolutionA chemical bond between two atoms is:
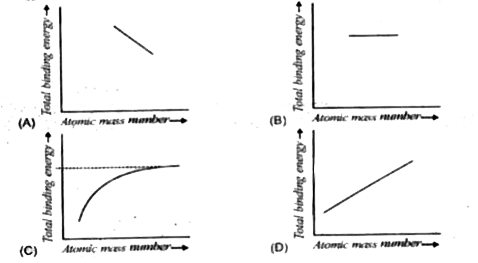
View SolutionWhich of the following graphs might represent the relationship between atomic mass number (i.e "atomic weight”) and the total binding energy of the nudeus, for nuclii heavier than Sr?

View SolutionDifferentiate between an atom and a molecule.
View SolutionThe bond between carbon atoms in graphite
View SolutionA body falls freely from a certain height. Show graphically the relation between the distance fallen and square of time. How will you determine g from this graph ?
View SolutionIf P to T are second period p-block elements then which of the following graph show corrrect relation between valence electrons in P2→T2
View Solution