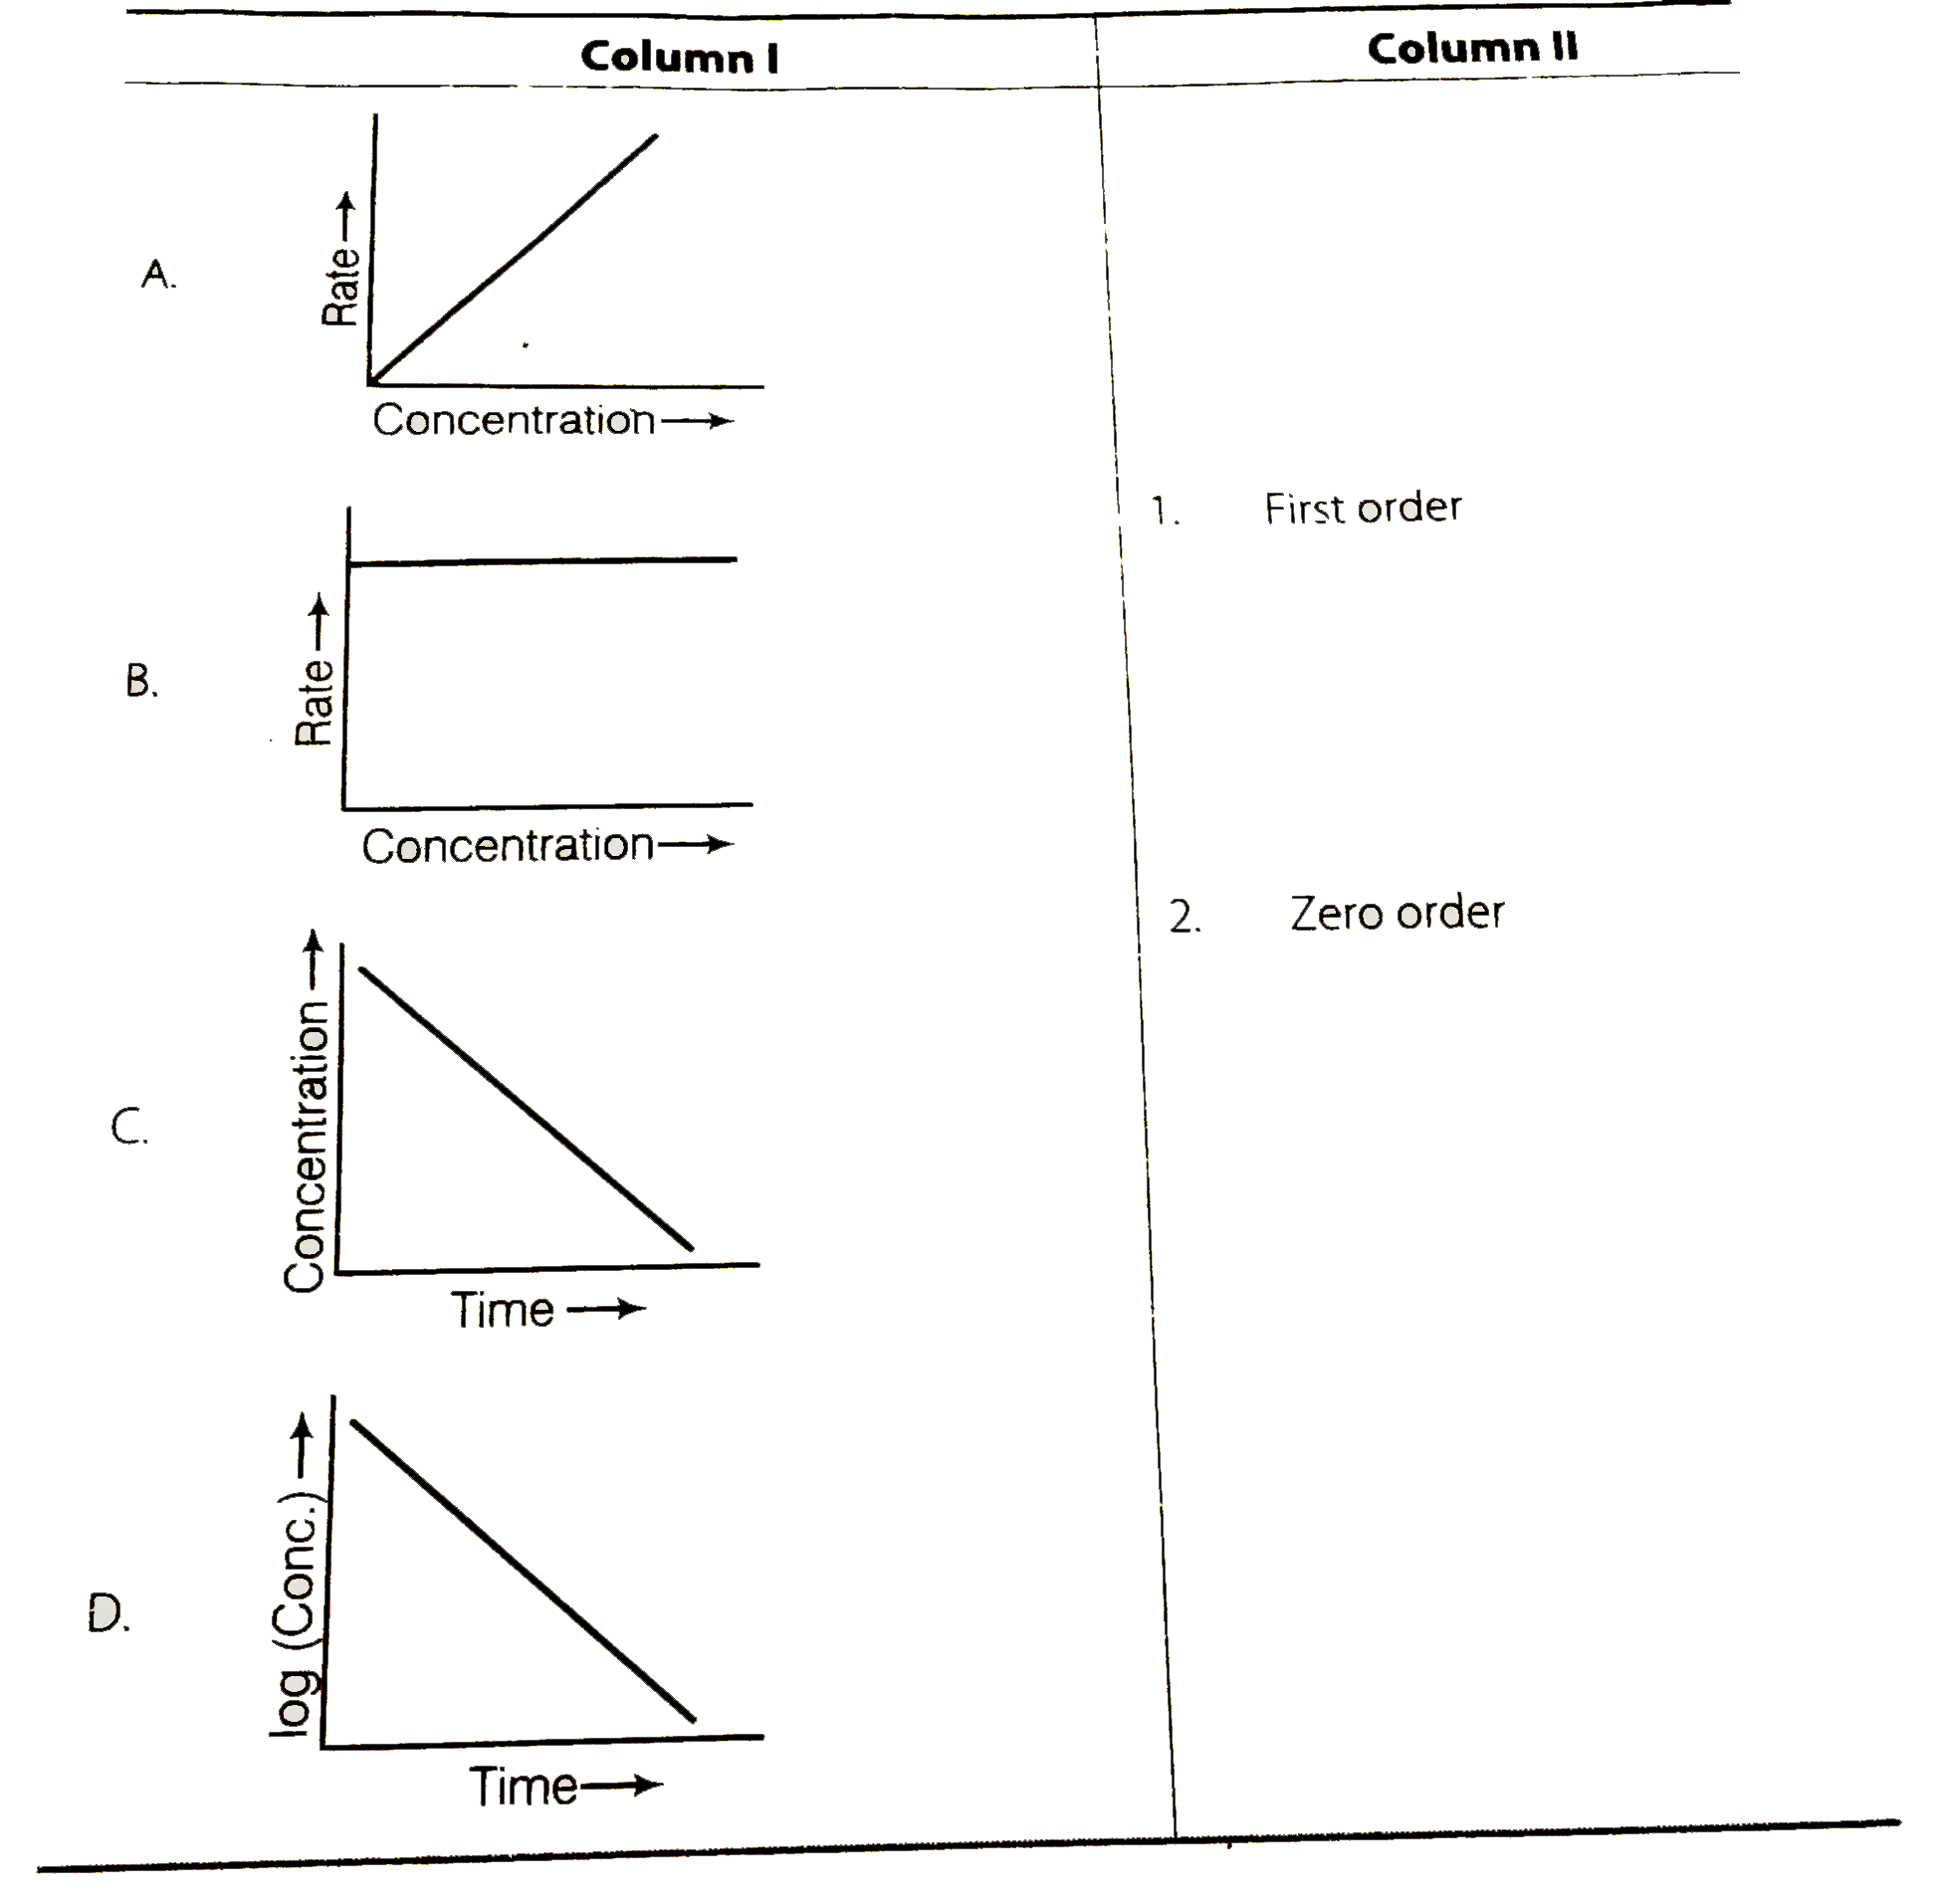
Match the graph given in column -I with the order of reaction given in column-II .More than one item in column - may link to the same item of column -II.

(A→ 1),(B→ 2),(C → 2),(D→ 1)
If the order of reaction =zero than its equation will be as follows :
[R]↑y==k↑m(t)↑x++[R]0↑c
It is the straight line equation .So [R]→ t graph is straight line.
So. [R]-[R]=-kt∴ΔR=-k (t)
So the graph of concentration → time is like (C )and slope =-t
For zero order reaction:
R → product rate=-d[R]dt=k[R]0=k
So rate → concentration graph is like (B),rate does not depend on concetration
For first order reaction:
R→ product rate=-d[R]dt=k[R]1
So graph of rate → concentration is (A) the equation of first order is follows.
k=2.303t log [R]0[R]
∴kt2.303=log[R]0-log[R]
∴log [R]↑y=−k2.303↑m(t)↑x+log↑c[R]0
So, the graph of log [R]→ time is seen the figure (D) of the negative slope and the intersection (R).
Topper's Solved these Questions
- CHEMICAL KINETICSBOOK - KUMAR PRAKASHANCHAPTER - CHEMICAL KINETICSEXERCISE - Section-D (Assertion and Reason type)
5 Videos
- CHEMICAL KINETICSBOOK - KUMAR PRAKASHANCHAPTER - CHEMICAL KINETICSEXERCISE - Section-D (Long answer type Questions)
4 Videos
- CHEMICAL KINETICSBOOK - KUMAR PRAKASHANCHAPTER - CHEMICAL KINETICSEXERCISE - Section-D (Short Answer Type Question)
20 Videos
- BOARD EXAM QUESTION PAPER MARCH - 2020 BOOK - KUMAR PRAKASHANCHAPTER - BOARD EXAM QUESTION PAPER MARCH - 2020 EXERCISE - PART -B
23 Videos
- CHEMISTRY IN EVERYDAY LIFEBOOK - KUMAR PRAKASHANCHAPTER - CHEMISTRY IN EVERYDAY LIFEEXERCISE - SECTION - E (MCQs ASKED IN GUJCET/BOARD EXAM)
37 Videos
Similar Questions
Match the grap given in column I with the order of reacting given in column II . More than one item in column I may link to the same item of Column.
View SolutionMatch the graph given in Column I with the order of reaction given in Column II. More than one item in column I may link to the same item of Column II.


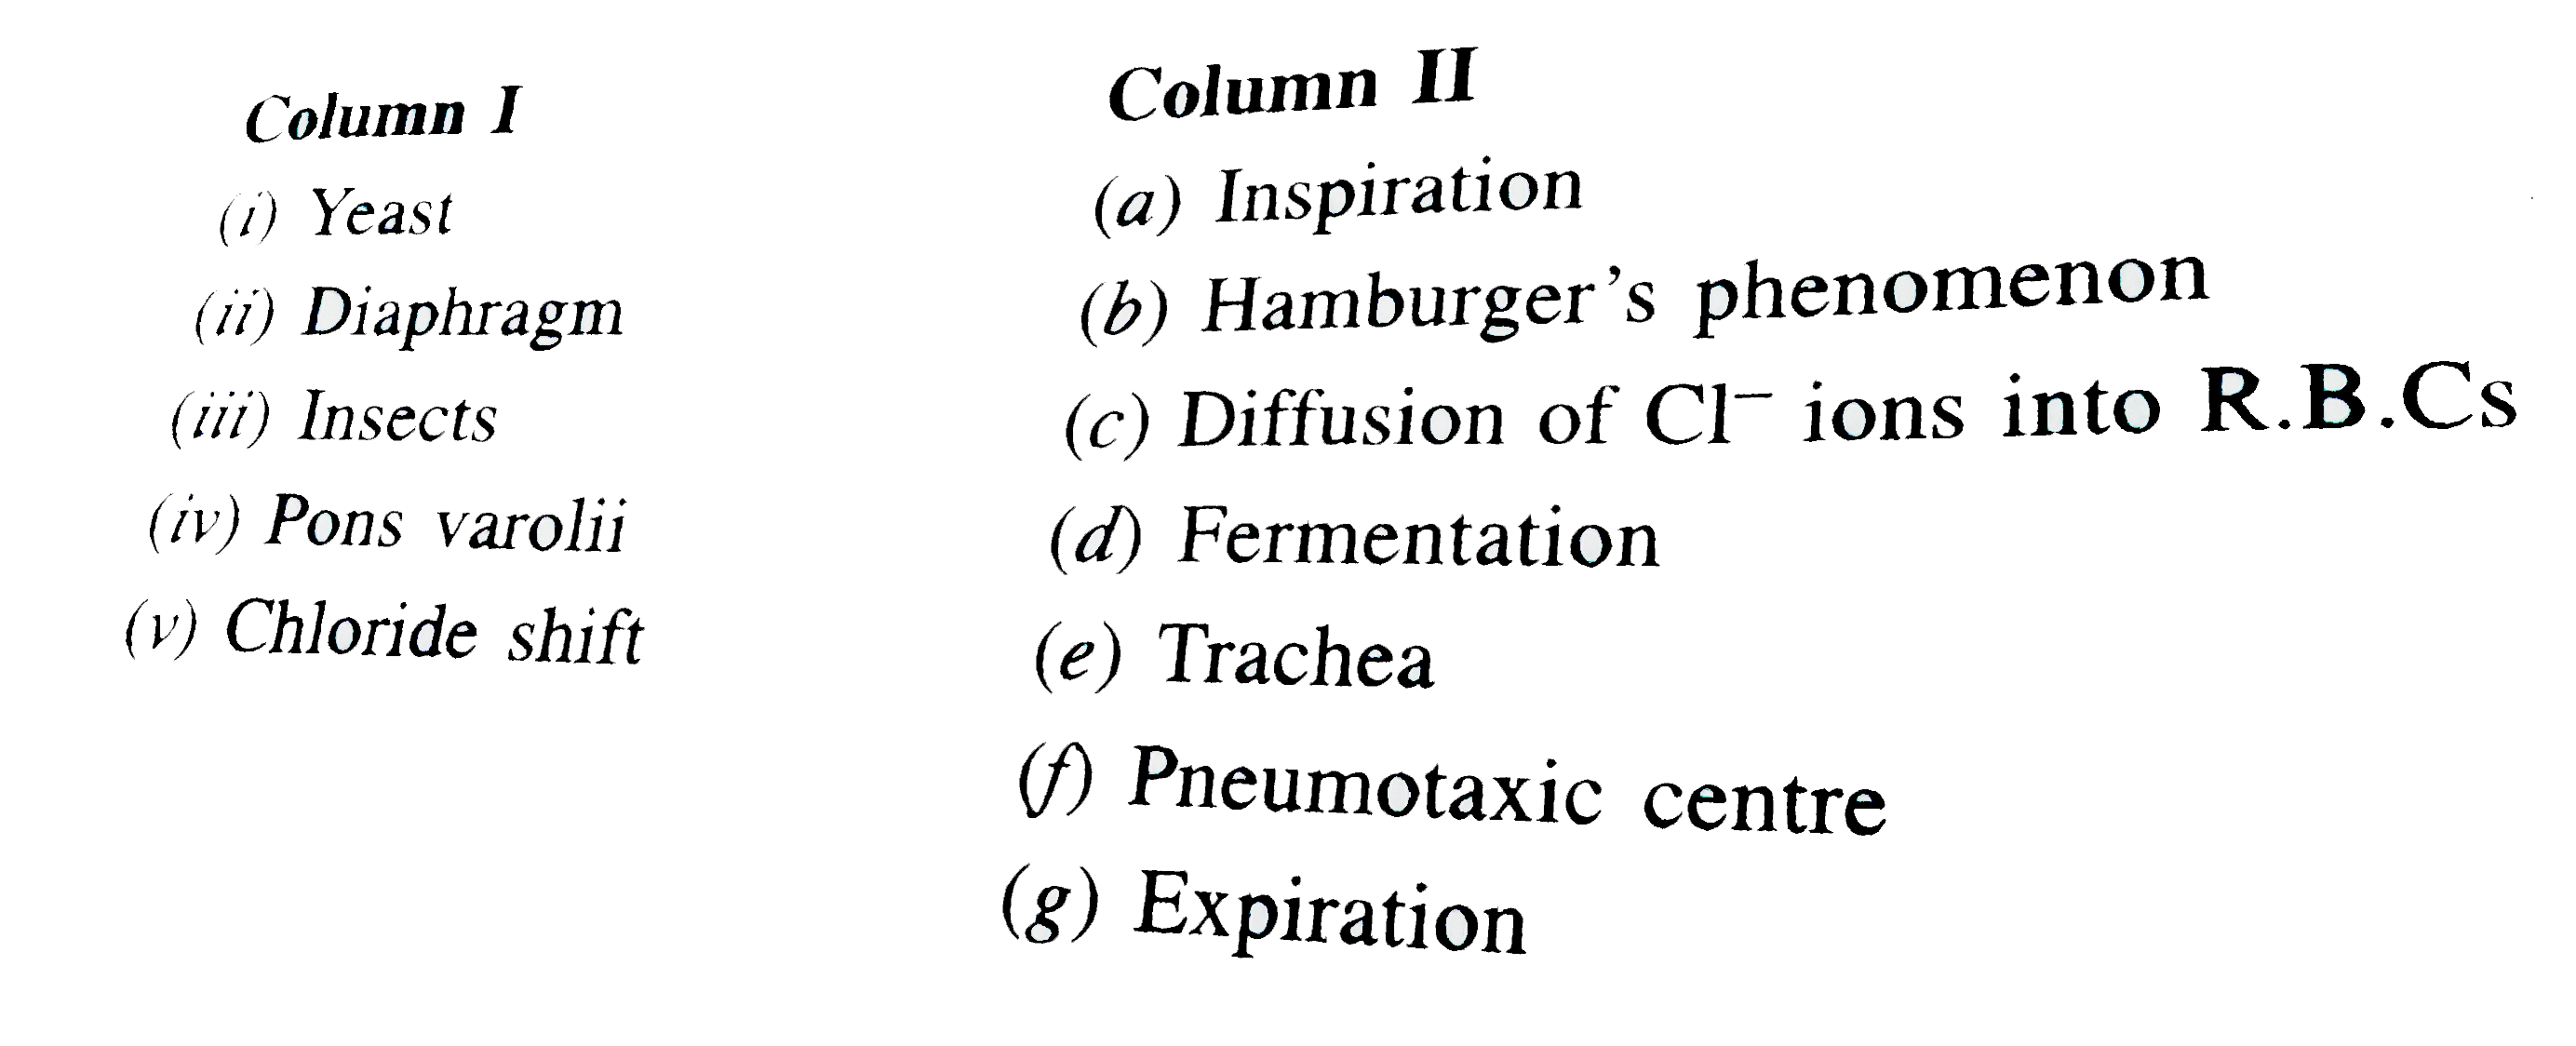
View SolutionMatch the items in column I with those (one or more ) given in column II .
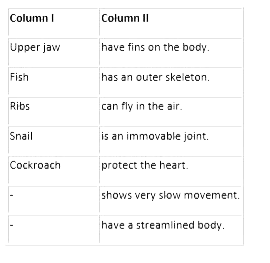
View SolutionMatch the items in Column I with one or more items of Column II.
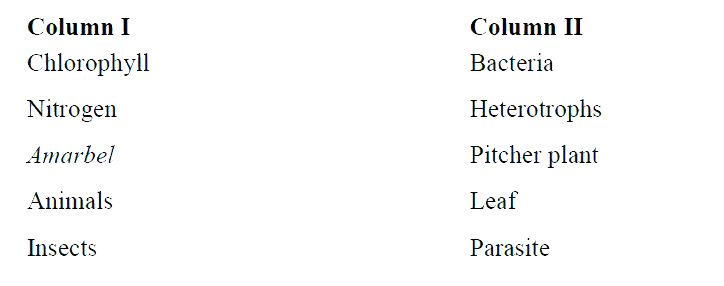
View Solutionmatch the items given in column I with the items given in column II.

View Solutionmatch the items given in column I with the items given in column II.

View Solutionmatch the items given in column I with the items given in column II.

View SolutionMatch the item given in Column I with those in Column II
View SolutionMatch the soaps given in Column I with items given in column II.
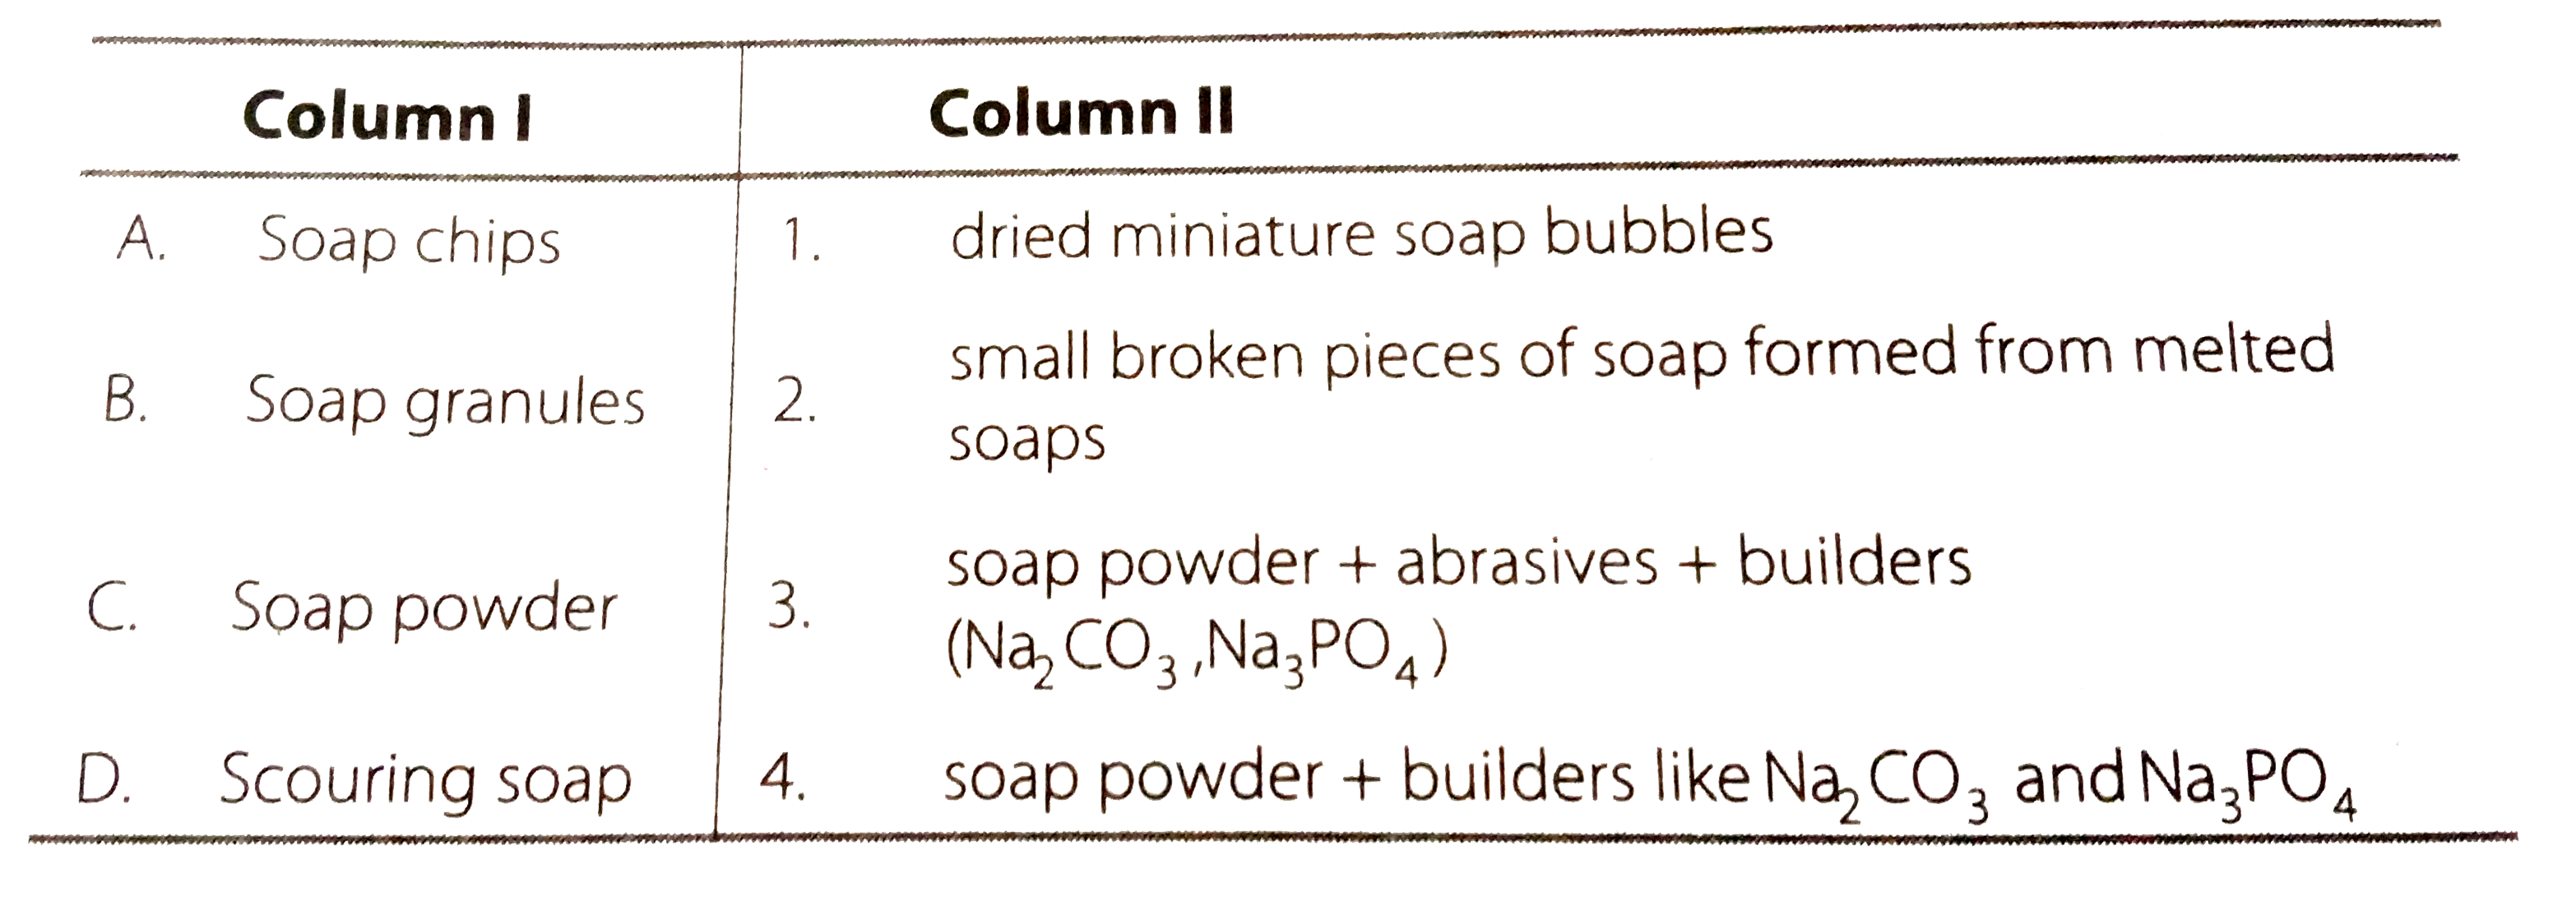
View SolutionMatch the soaps given in Column I with items given in column II.

View Solution
