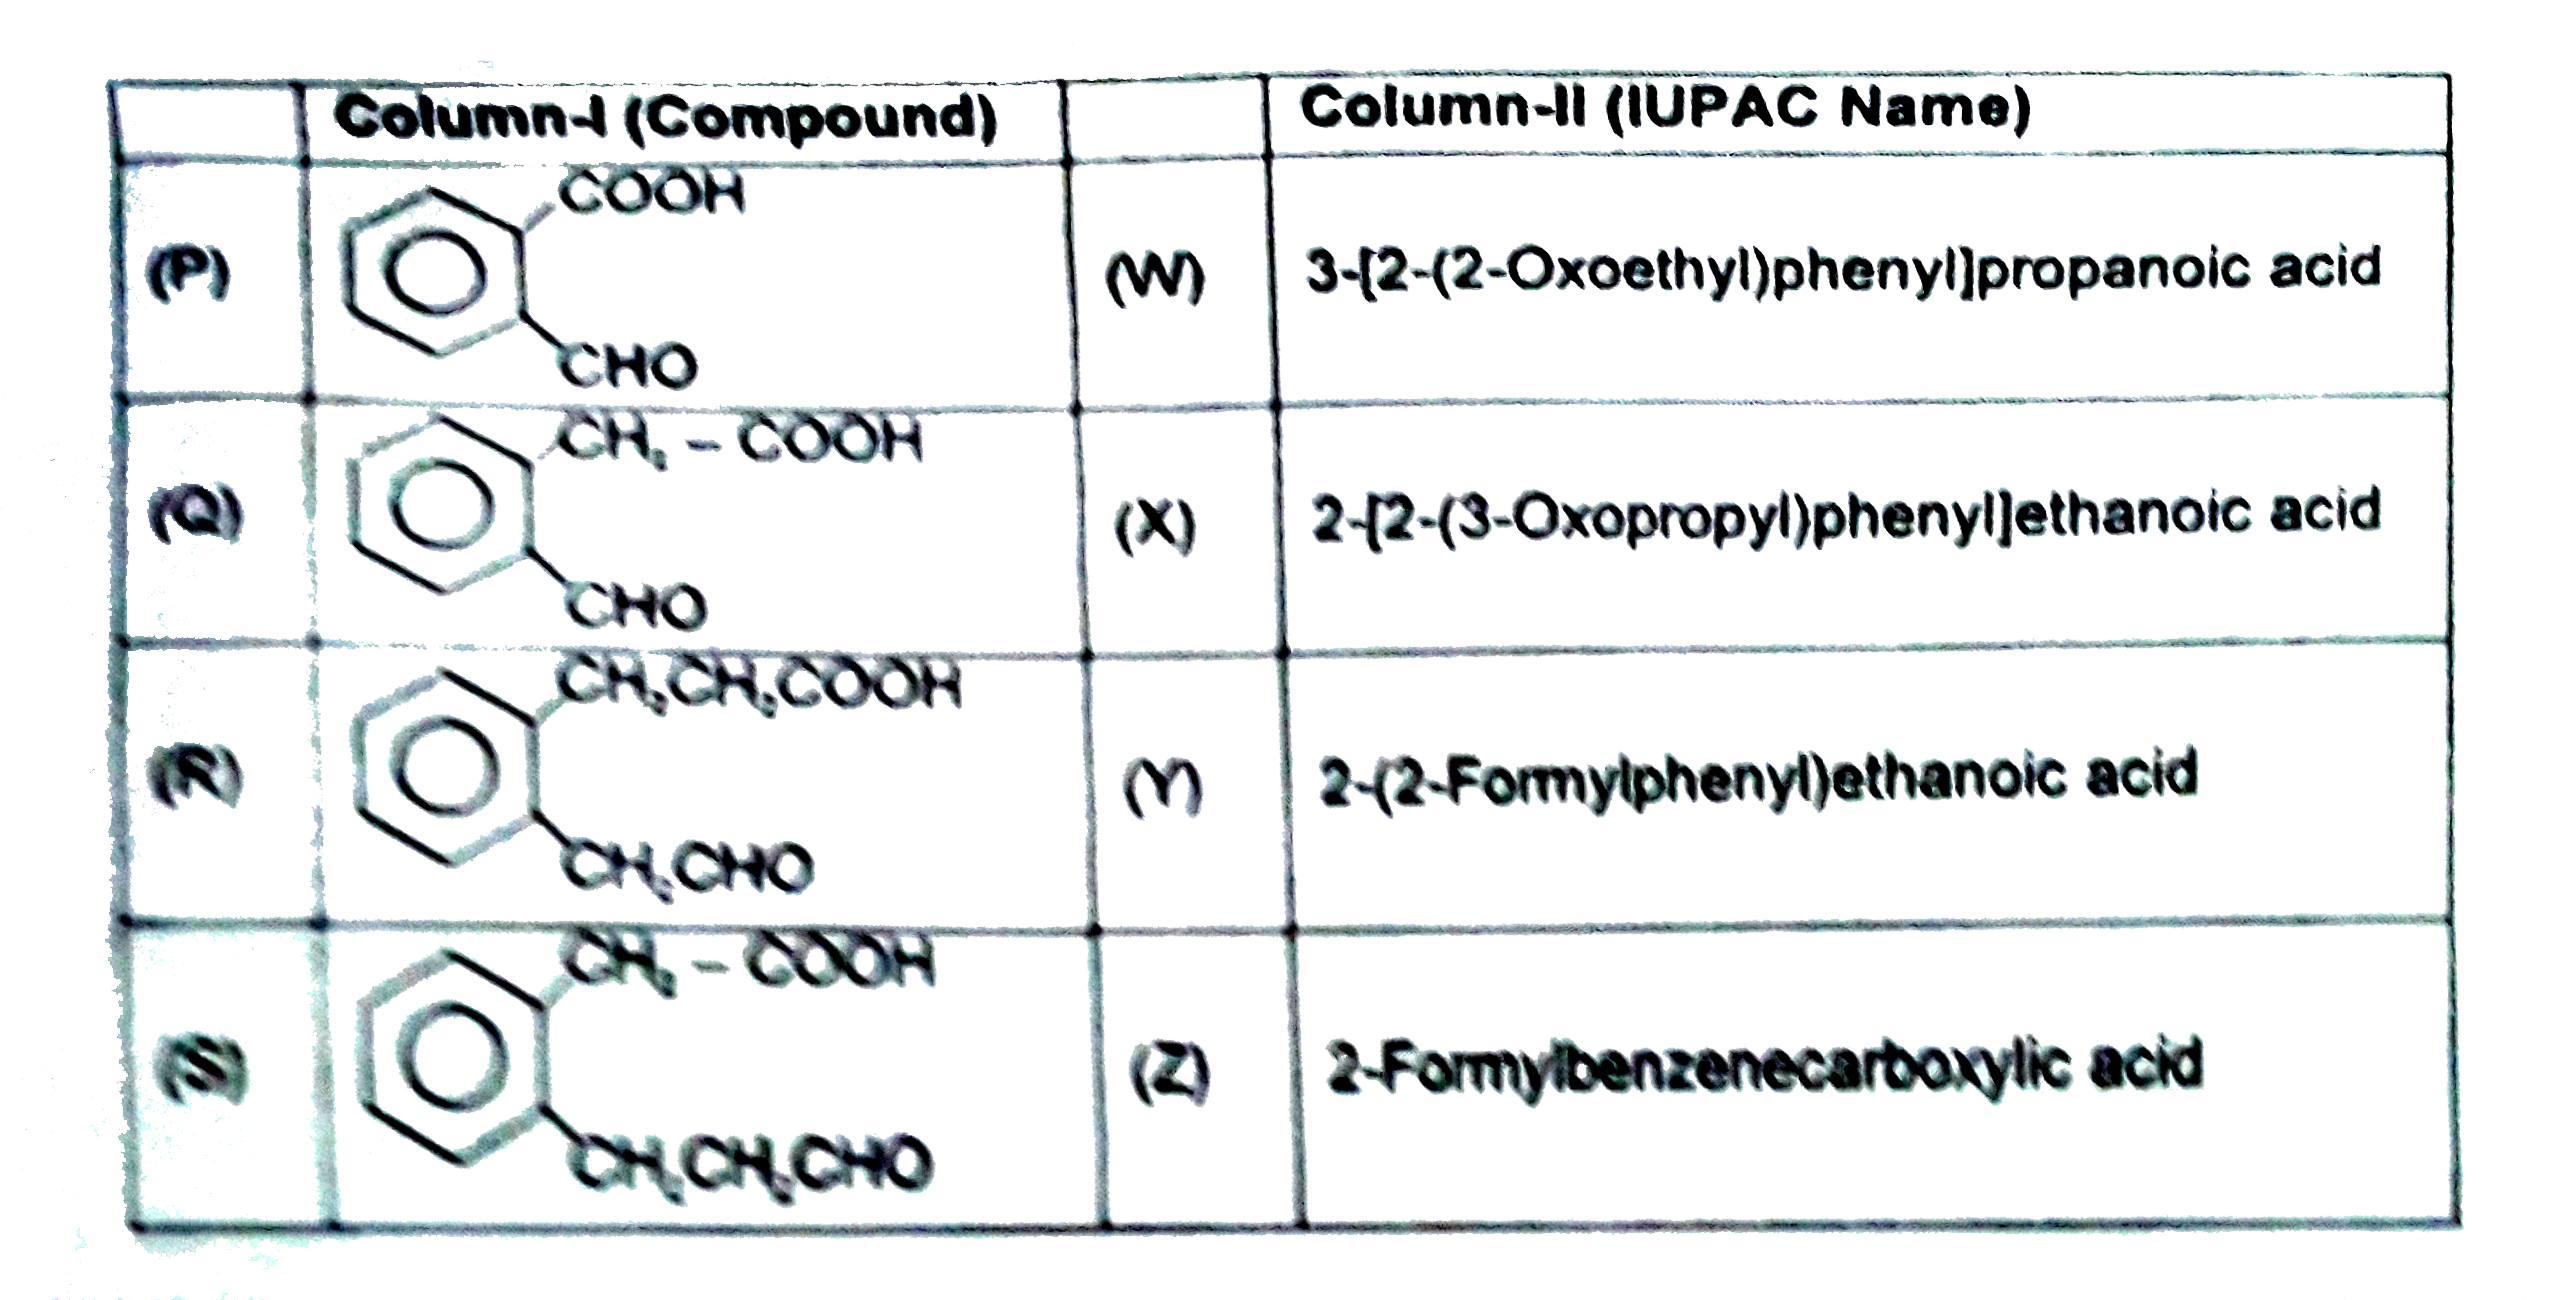
Match the graphs between the following variables with their names :

Text Solution
(A - 3) (B - 1) (C - 4)
(A) When molar volume is constant, the p - T graph is called isochore.
(B) When temperature is constant, the p - V graph is called isotherm.
(C ) When pressure is constant, V - T graph is called isobar.
|
Topper's Solved these Questions
- STATES OF MATTER BOOK - KUMAR PRAKASHANCHAPTER - STATES OF MATTER EXERCISE - SECTION - D SOLUTION OF NCERT EXEMPLAR PROBLEMS (Assertion and Reason)
6 Videos
- STATES OF MATTER BOOK - KUMAR PRAKASHANCHAPTER - STATES OF MATTER EXERCISE - SECTION - D SOLUTION OF NCERT EXEMPLAR PROBLEMS (Long Answer Type Questions)
6 Videos
- STATES OF MATTER BOOK - KUMAR PRAKASHANCHAPTER - STATES OF MATTER EXERCISE - SECTION - D SOLUTION OF NCERT EXEMPLAR PROBLEMS (Short Answer Type Questions)
23 Videos
- SOME BASIC CONCEPTS OF CHEMISTRYBOOK - KUMAR PRAKASHANCHAPTER - SOME BASIC CONCEPTS OF CHEMISTRYEXERCISE - Section - D (Solutions of NCERT Exemplar Problems) (Long Answer Type Questions)
4 Videos
- STRUCTURE OF ATOMBOOK - KUMAR PRAKASHANCHAPTER - STRUCTURE OF ATOMEXERCISE - QUESTINS PAPER FROM MODULE (SECTION -D)
2 Videos
Similar Questions
Knowledge Check
Match the following with their name
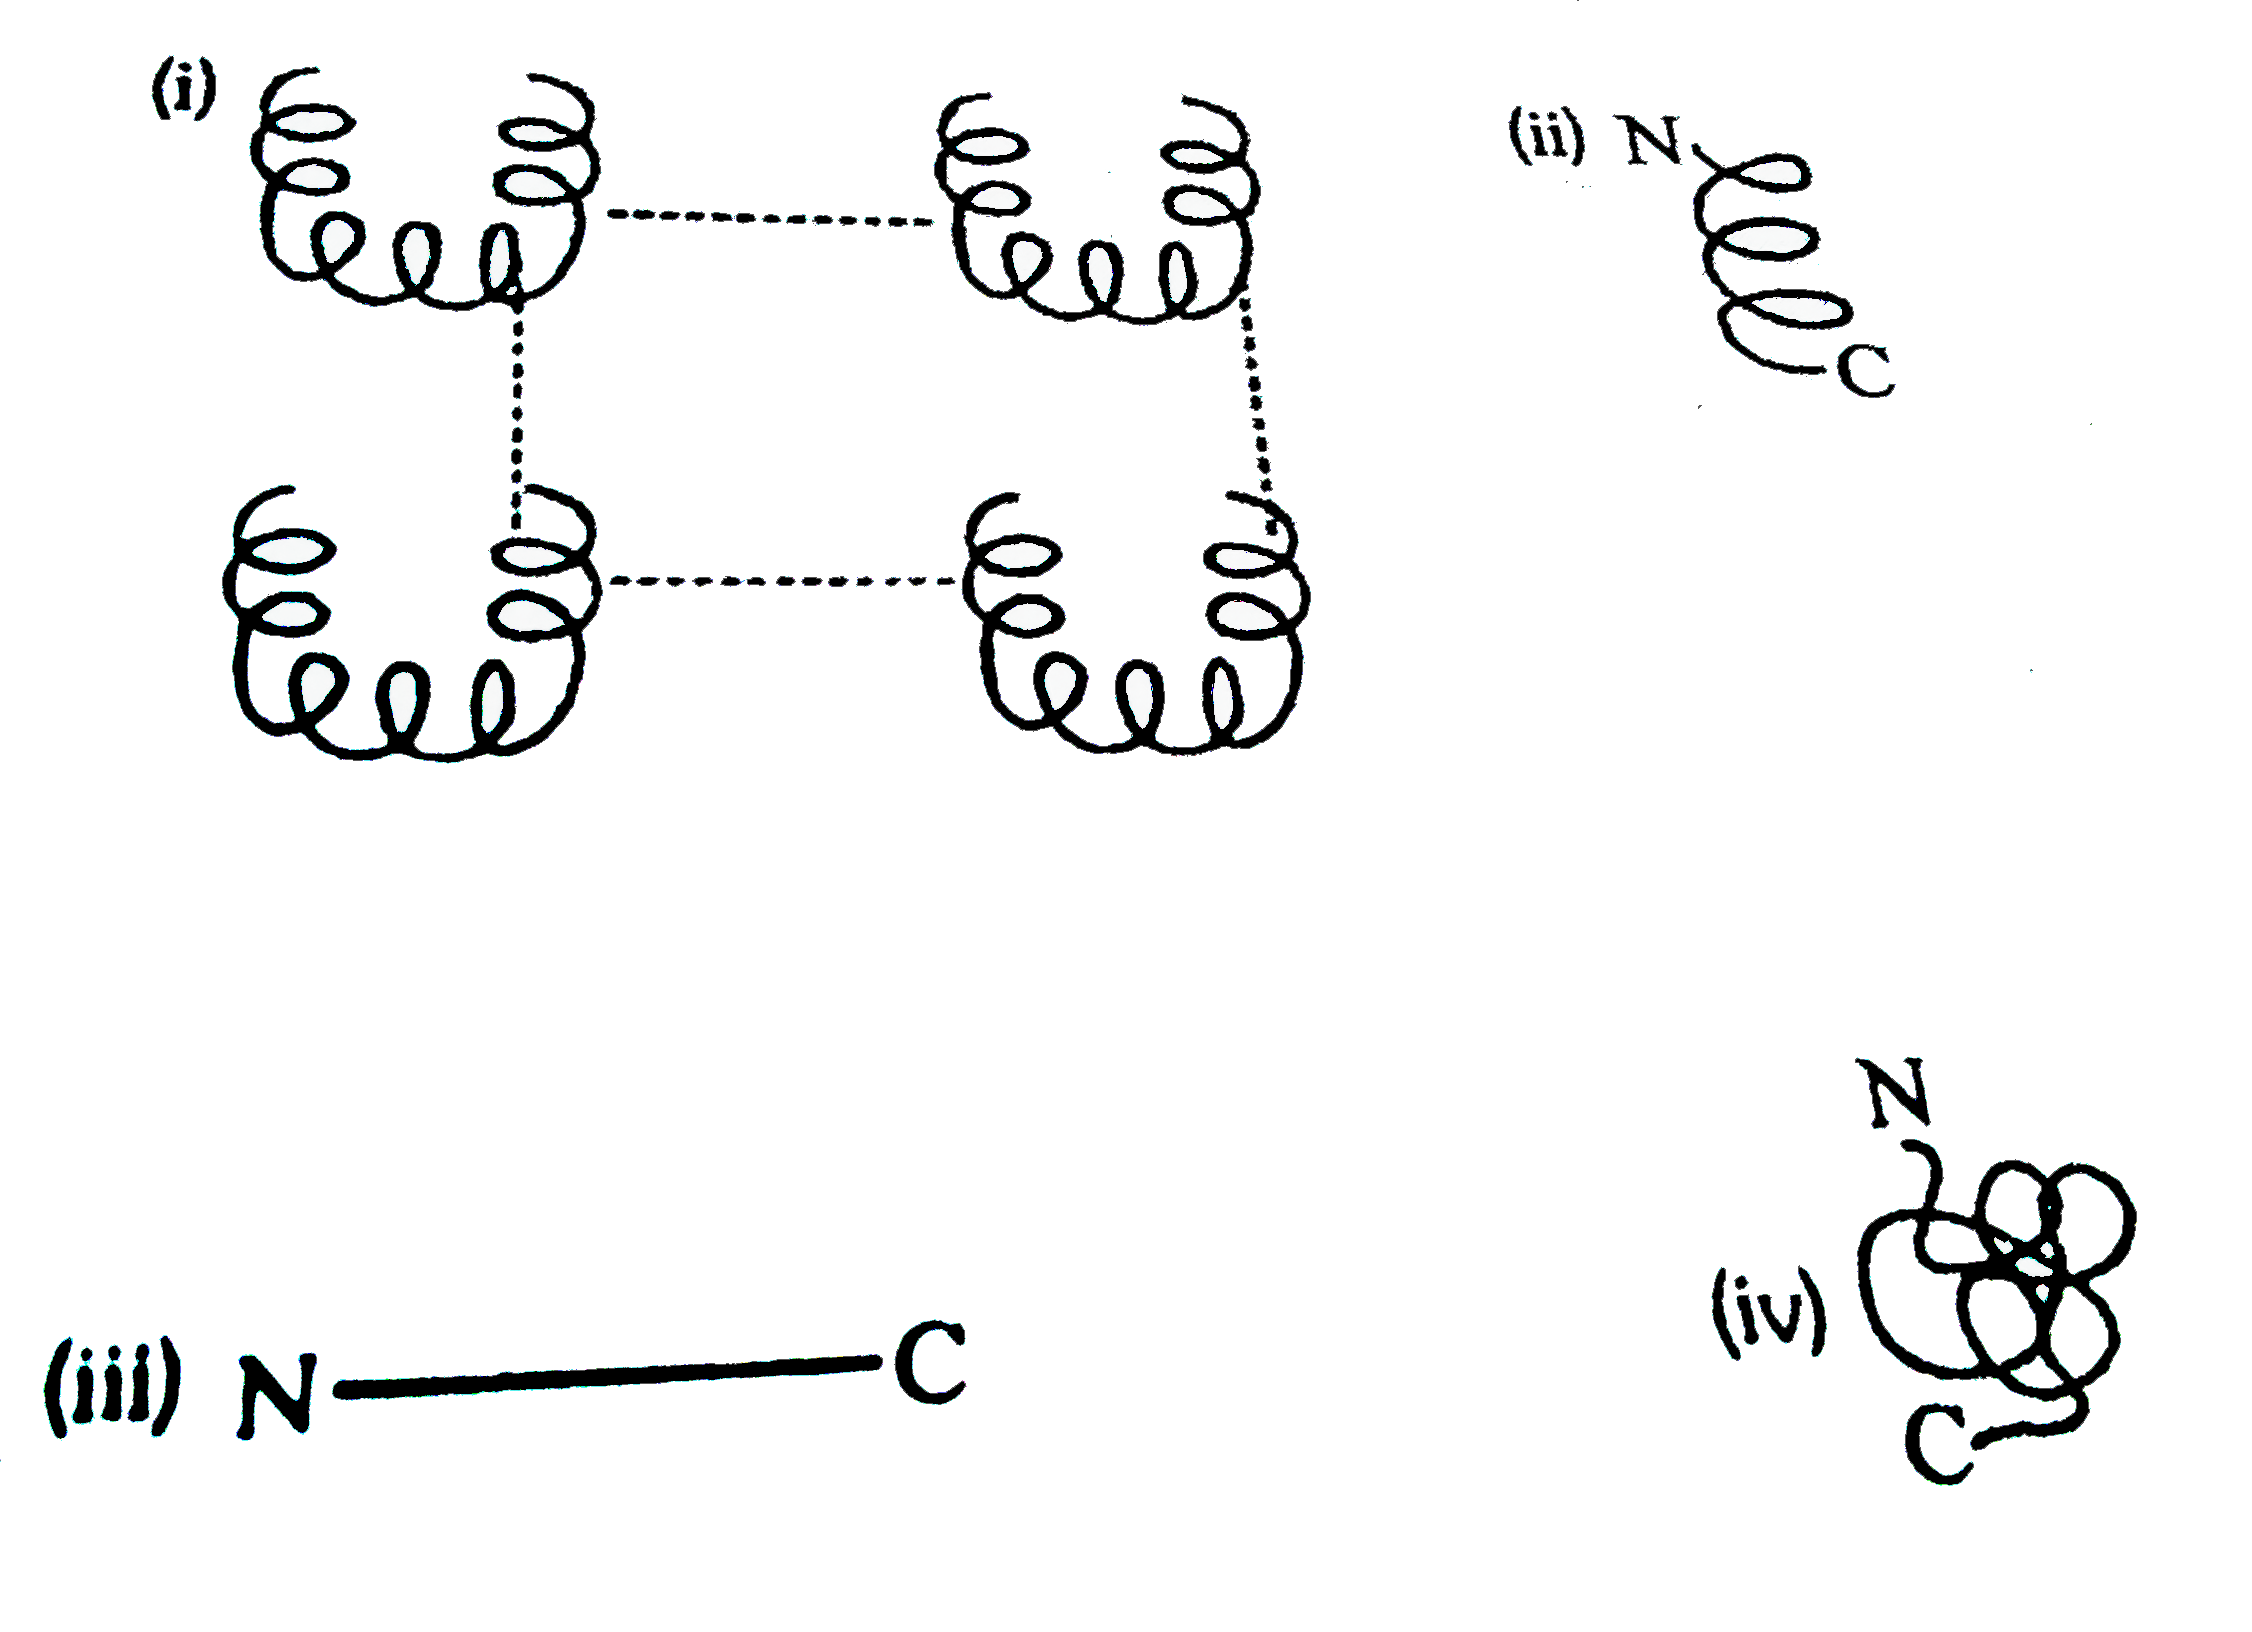 APrimary structureBSecondary structureCTertiary structureDQuaternary structure
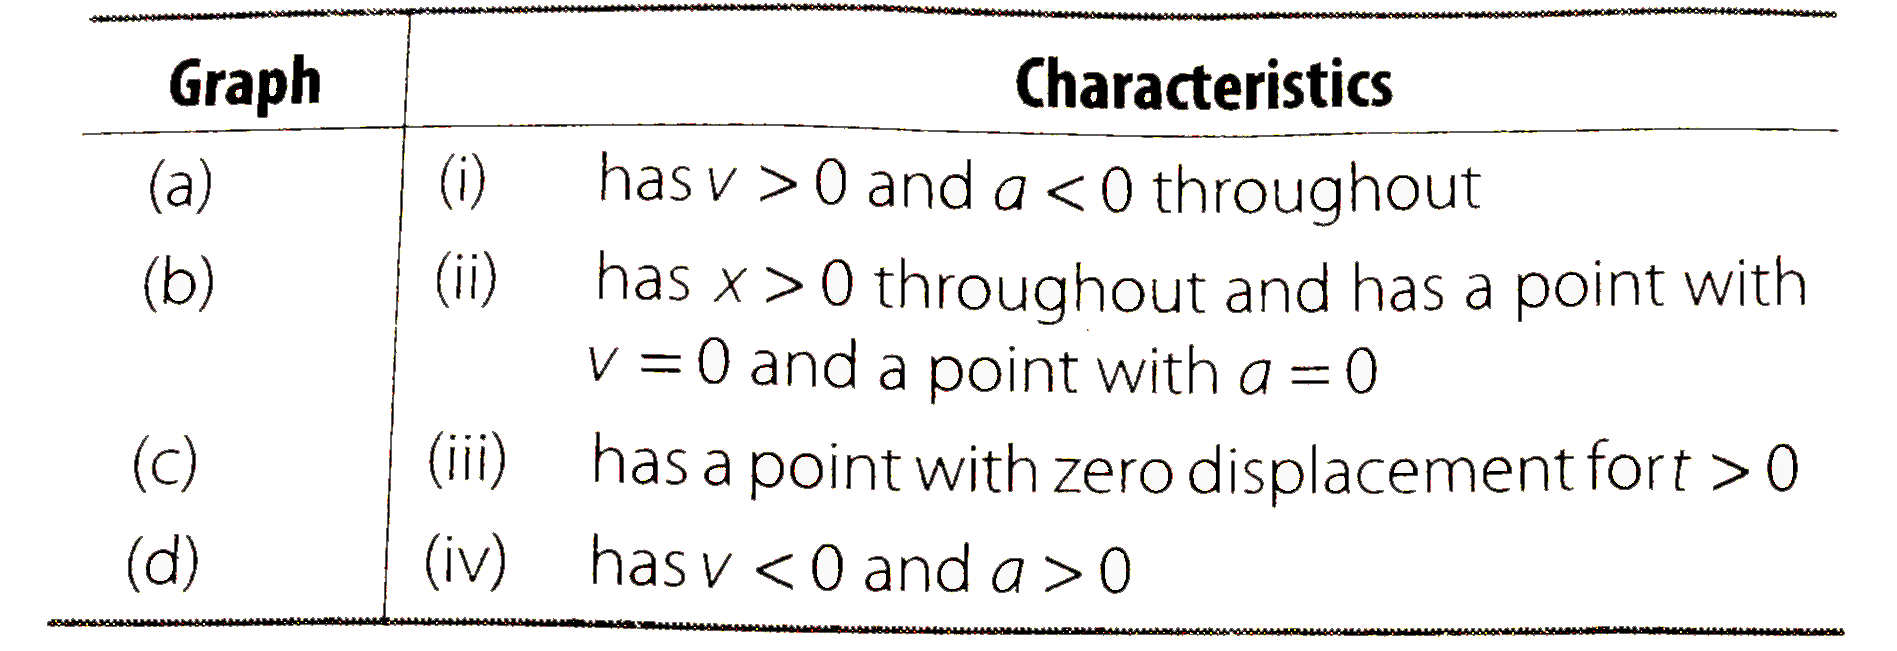
Refer to the graph in figure. Match the following
 A
A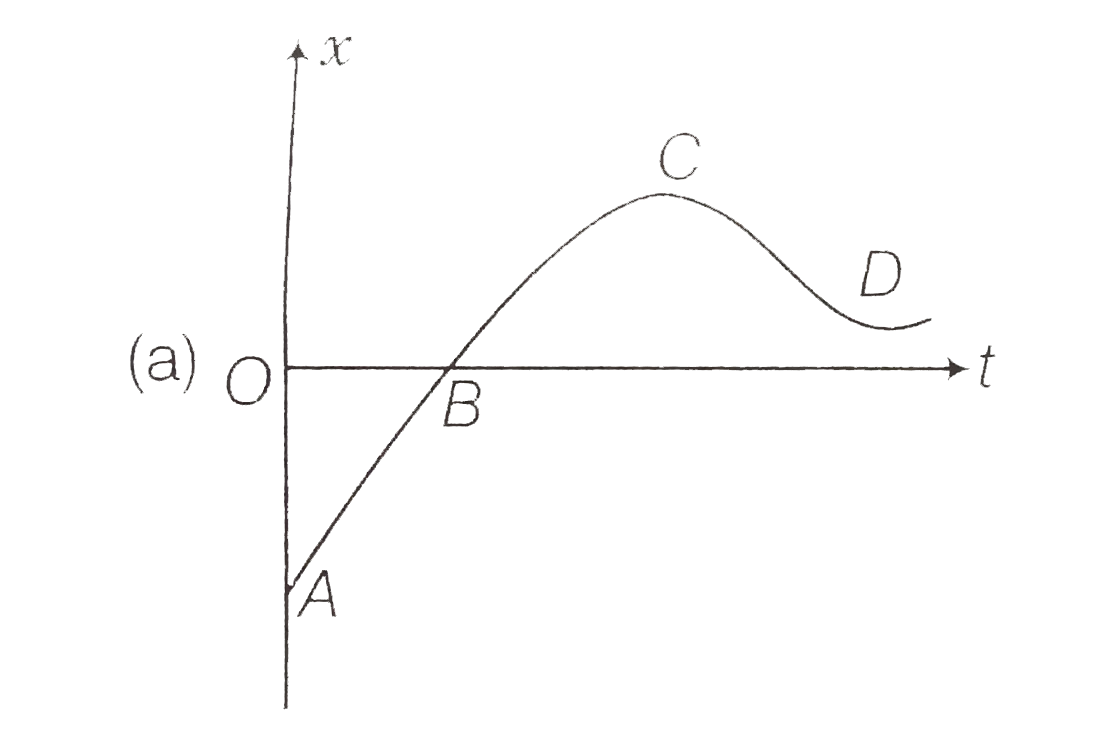 B
B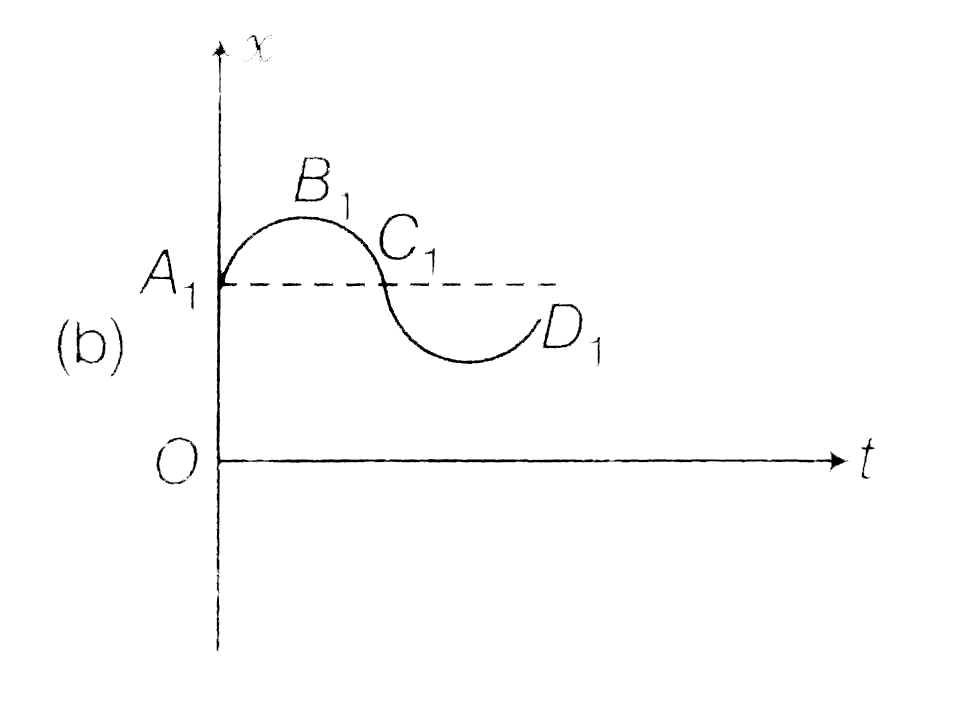 C
C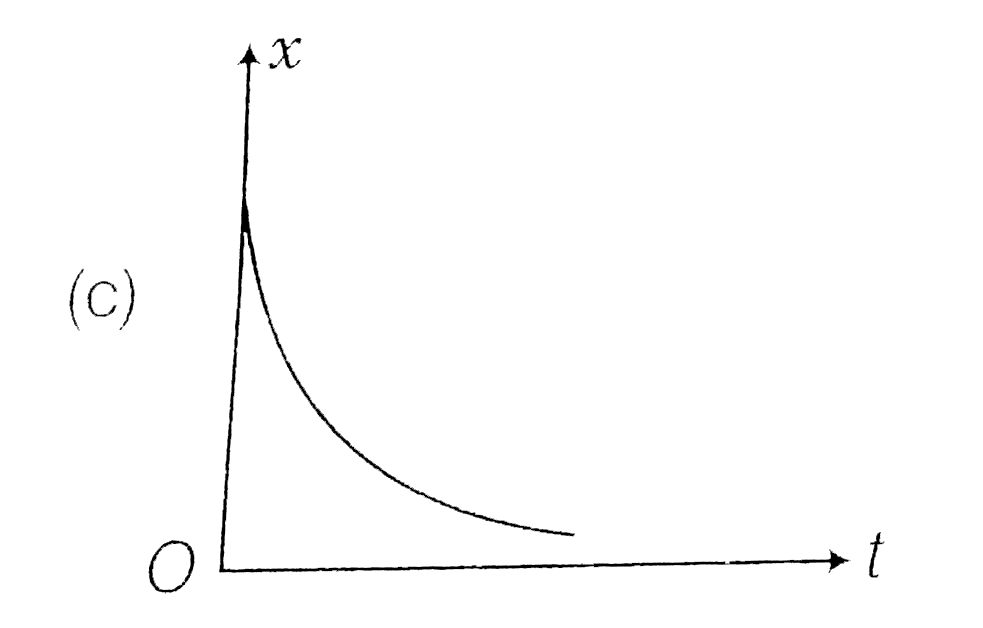 D
D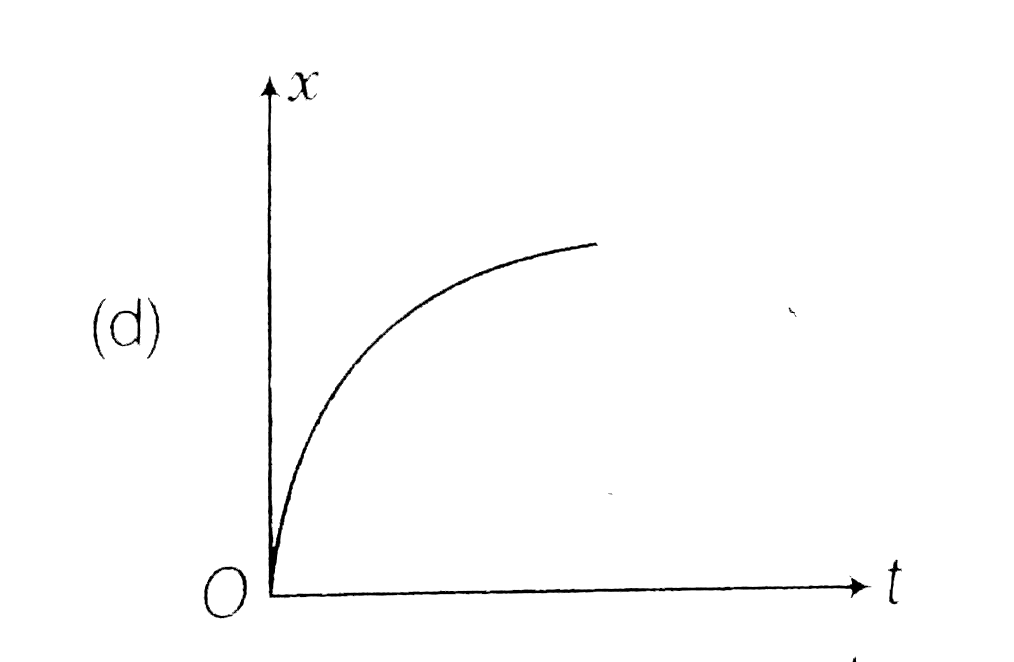
In the given figure is shown a variable y varying exponentially on another variable x. Study the graph carafully. Which of the following equations best suits the show graph?
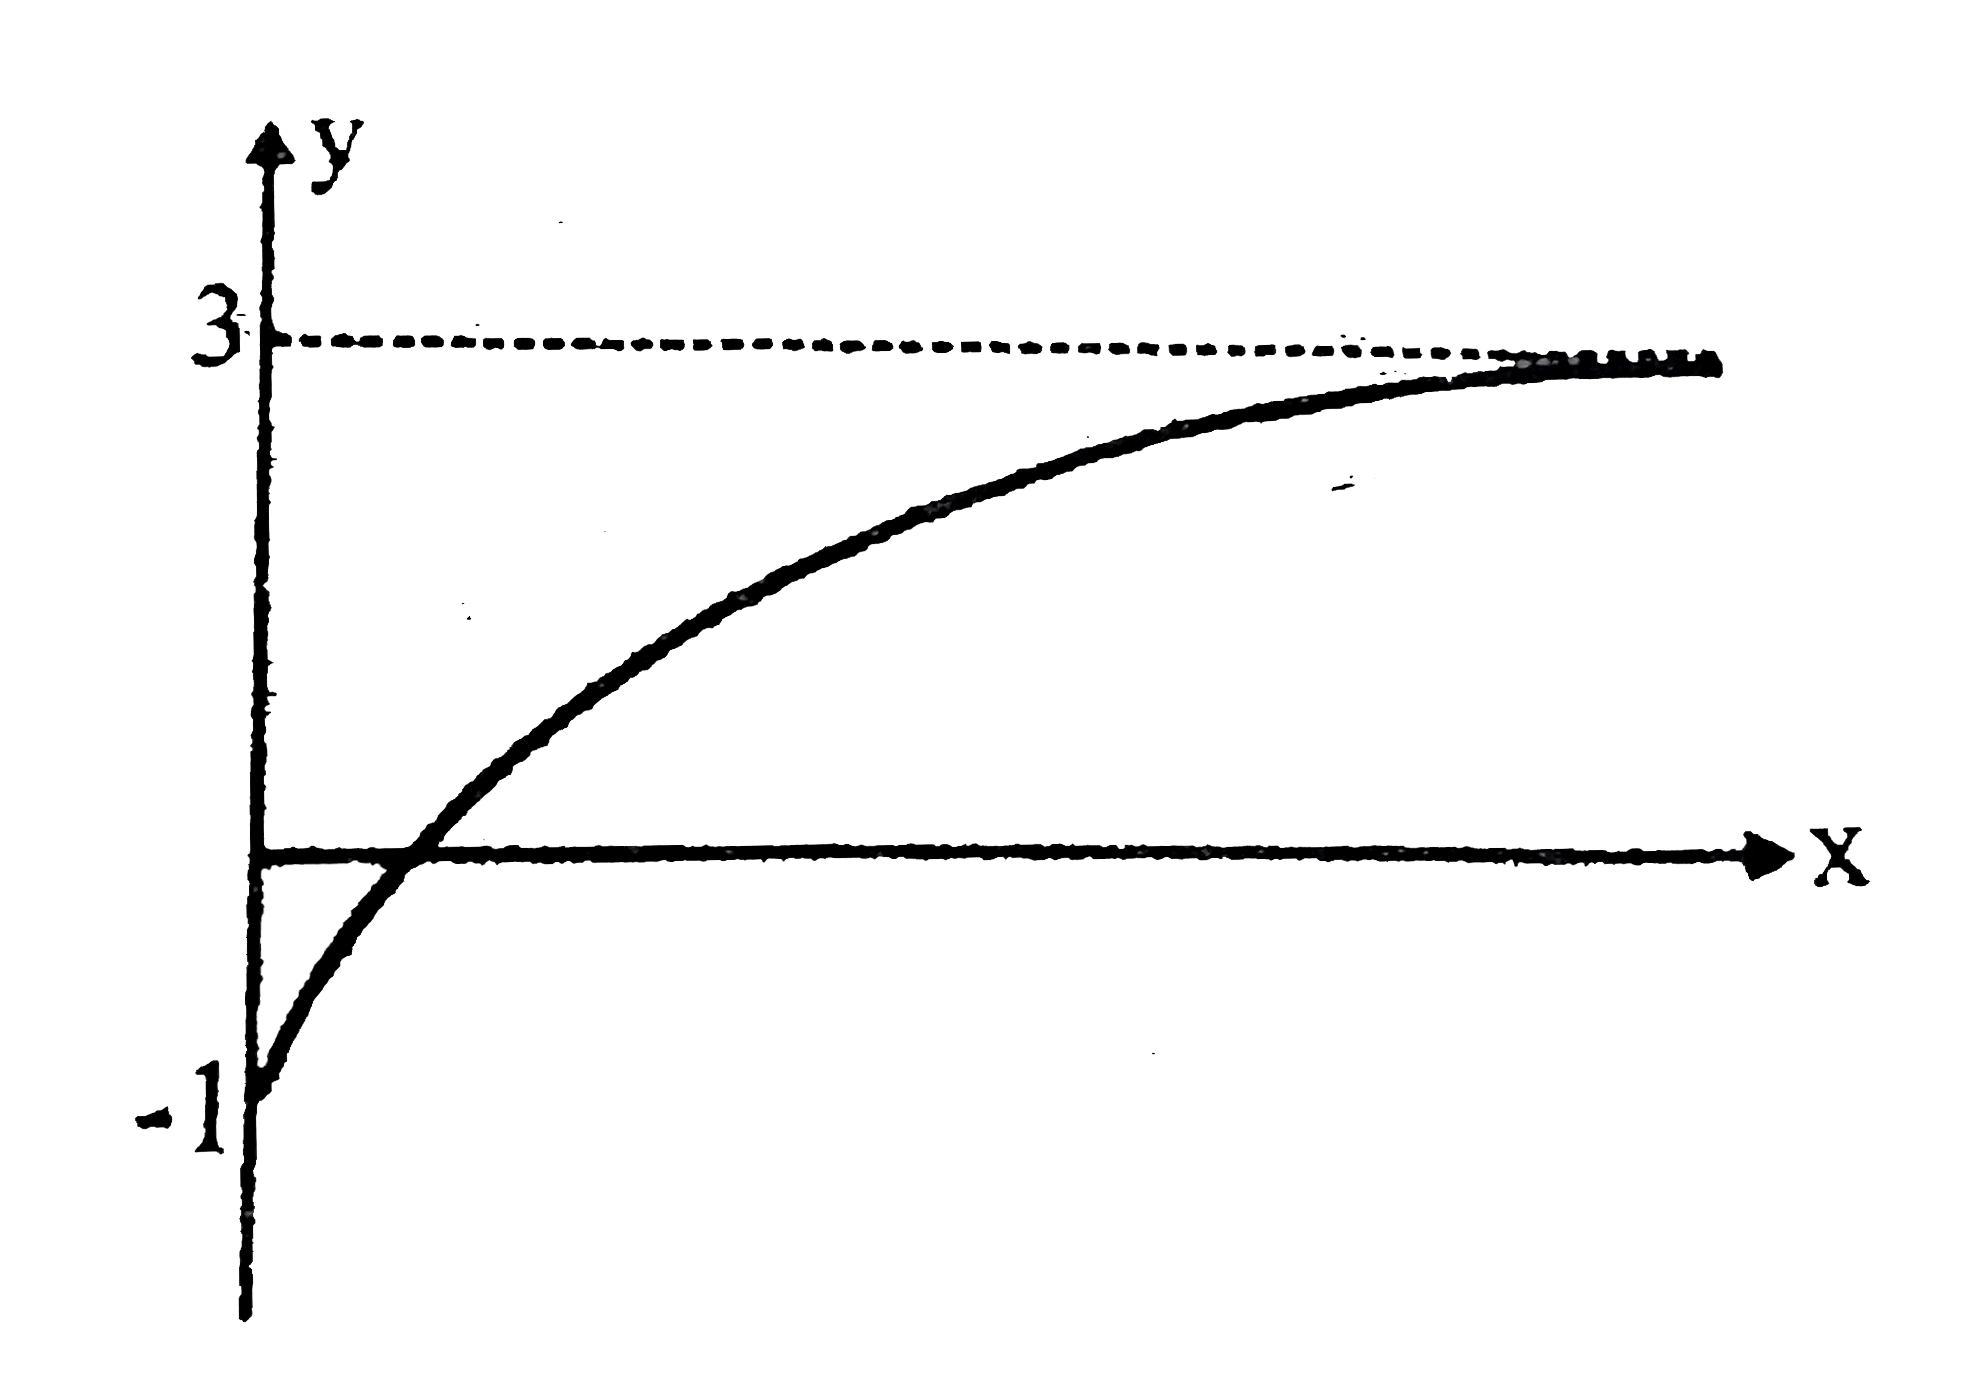 Ay=3−e−xBy=1−4e−xCy=1−3e−xDy=3−4e−x
Match the following graphs of ideal gas with their coordinates :
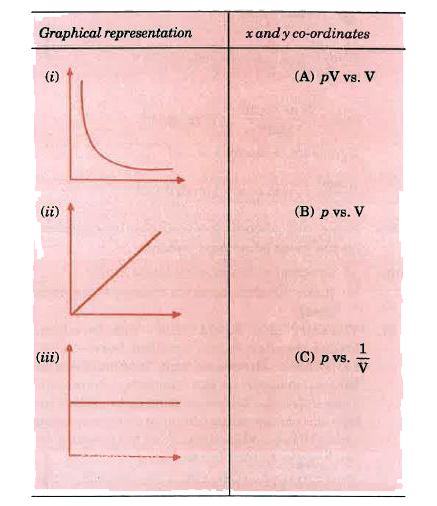
View SolutionMatch the following graphs of ideal gas with their coordinates.
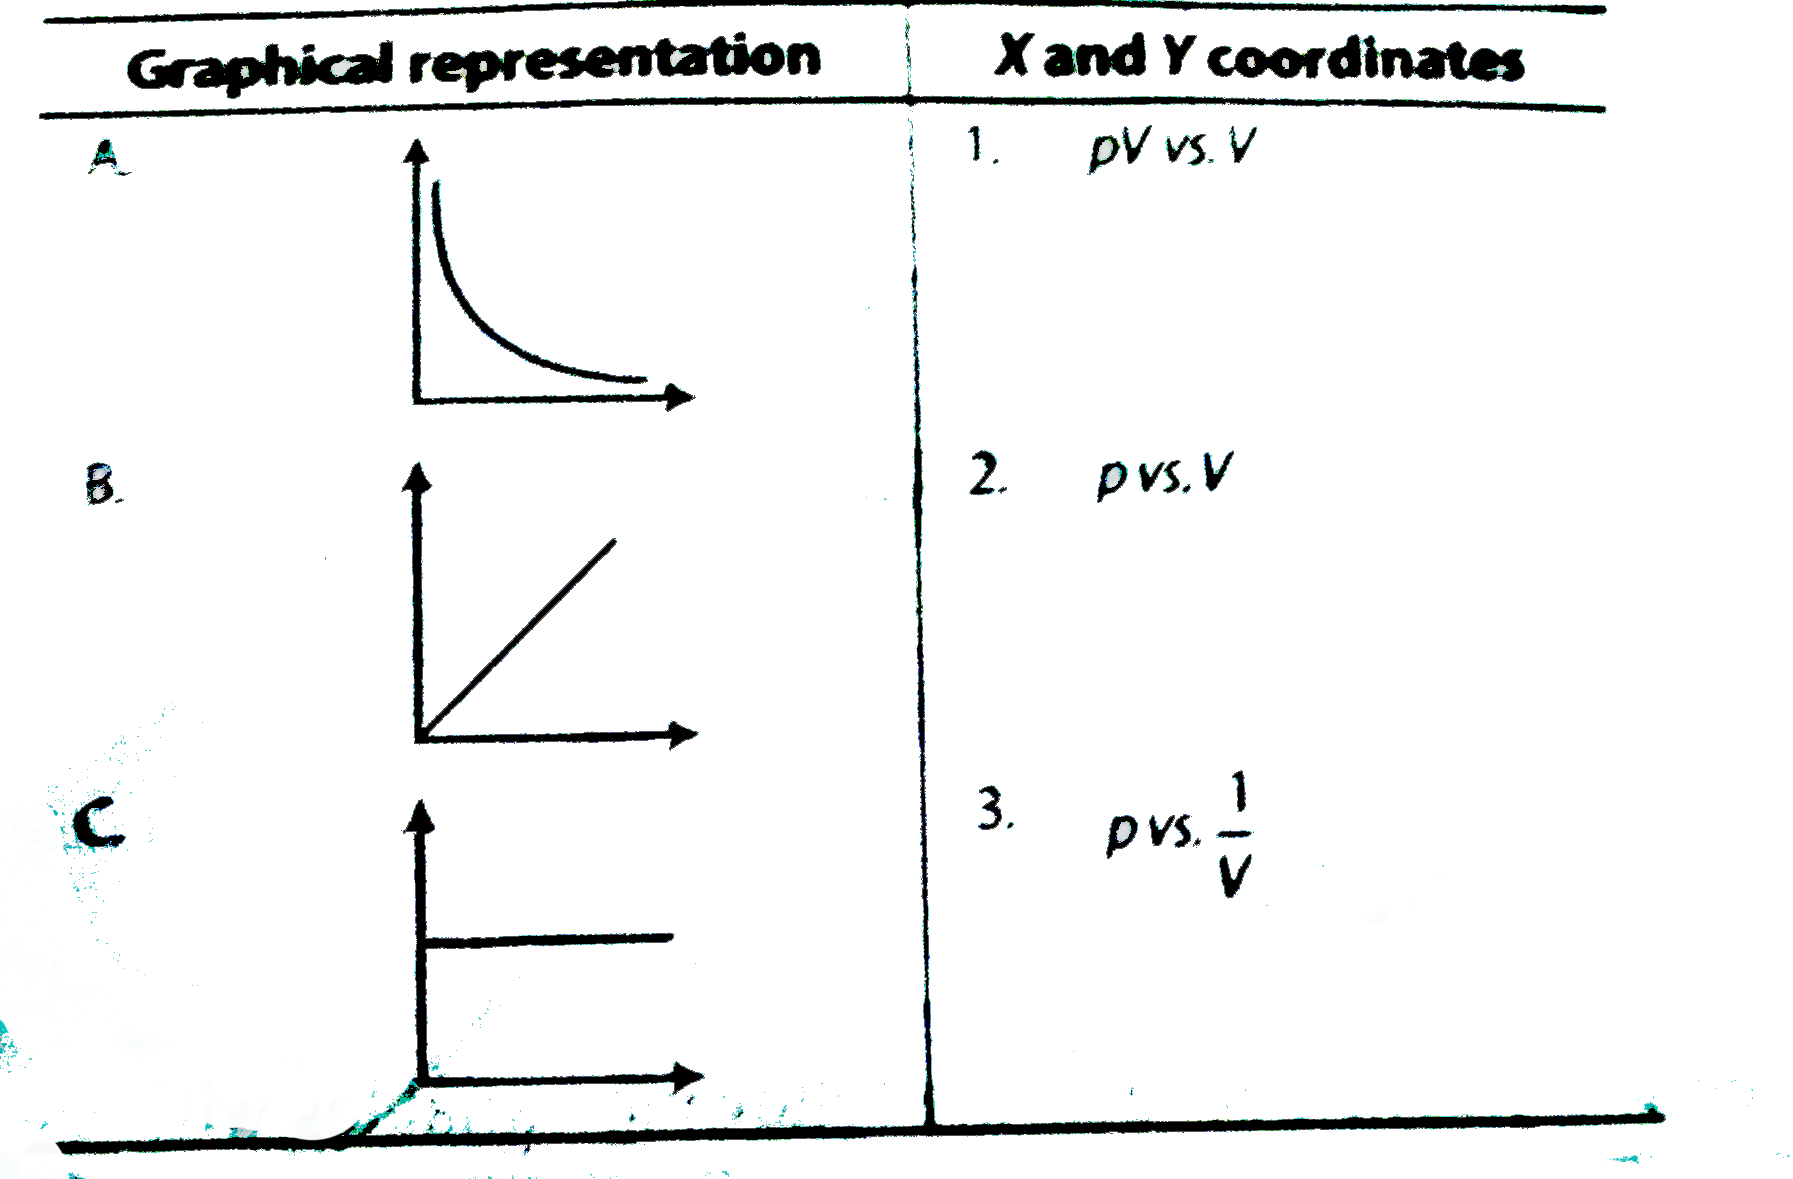
View SolutionMatch the following graphs of ideal gas with their coordinates.

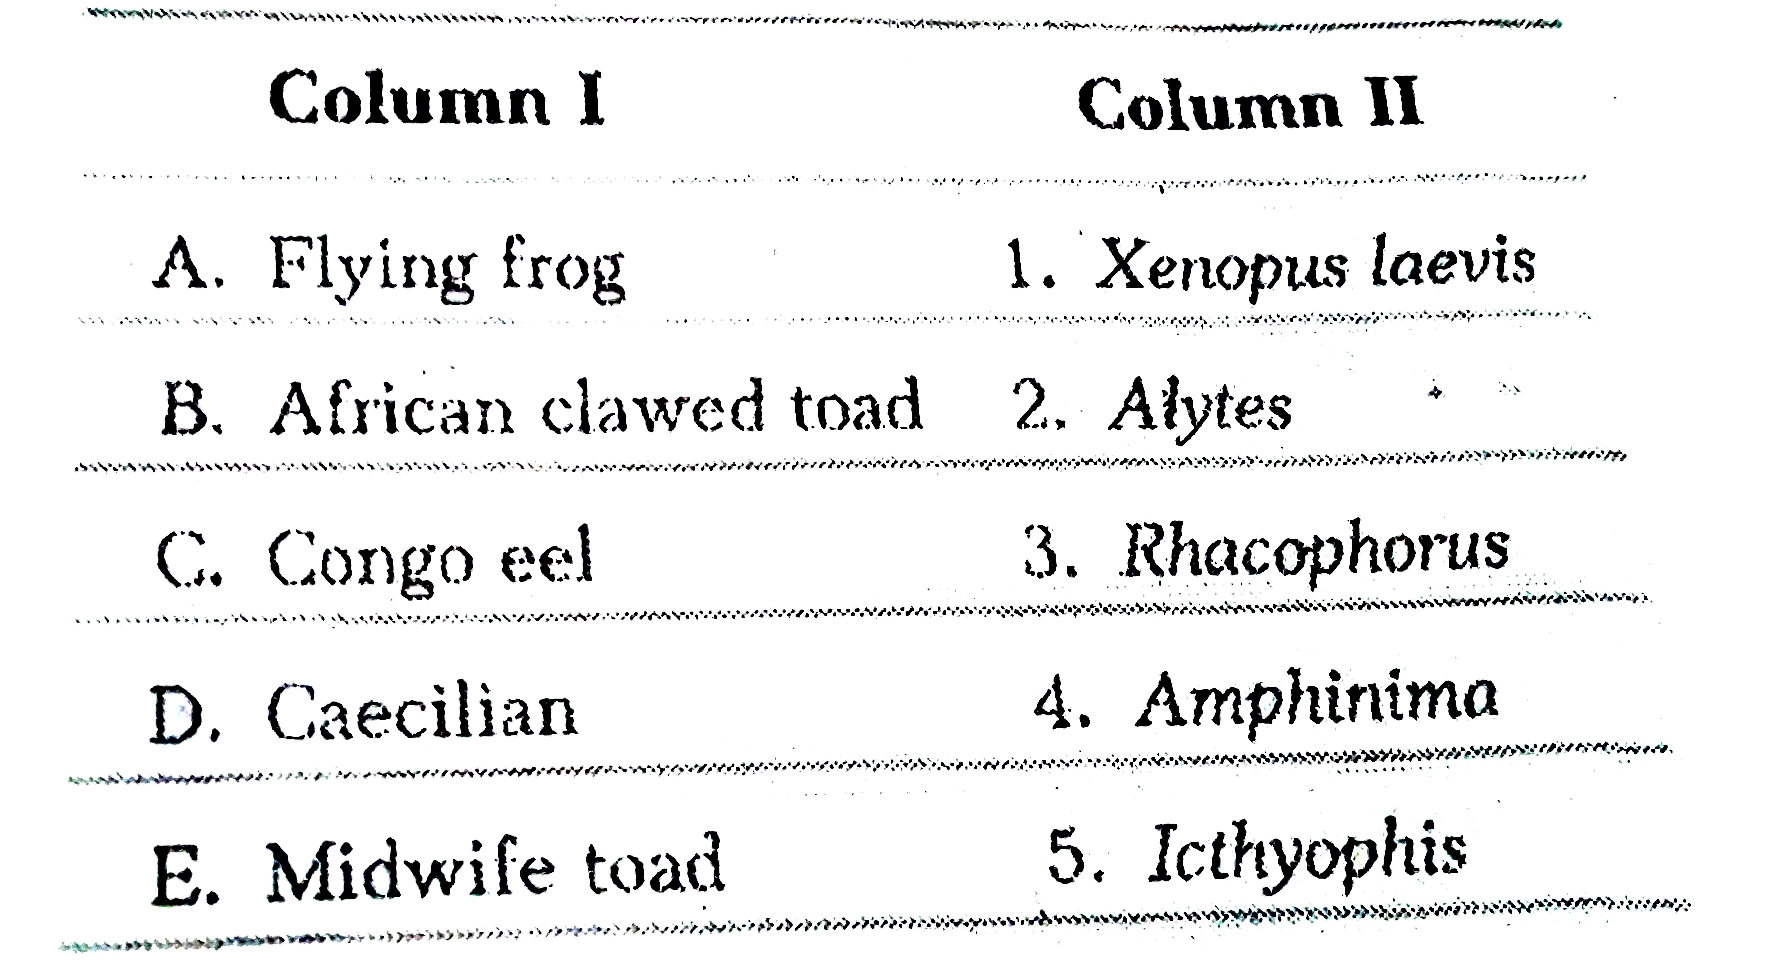
View SolutionMatch the following amphibians wiith their correct scientific names.
View SolutionThe following graph gives the minimum and maximum temperatures of various cities on a specific day. Read the graph and answer the following questions
Name the city which has the minimum difference between its minimum and maximum temperatures.

View Solution

