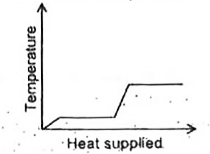
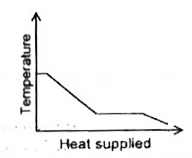
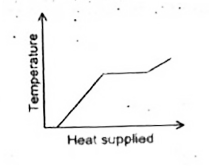
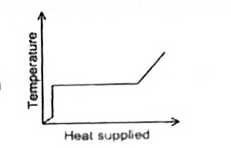
One gram of steam is condensed to water at 100∘C. Which of the following complies with this process?
A
540 cal of heat is absorbed
B
80 cal of heat is absorbed
C
540 cal of heat is released
D
80 cal of heat is released
Video Solution
Text Solution
The correct Answer is:C
When 1 gram of steam is condensed to water at 100∘C, 540 cal of heat is released.
Hence, the correct option is (c).
|
Topper's Solved these Questions
- WATER-A WONDER LIQUID BOOK - PEARSON IIT JEE FOUNDATIONCHAPTER - WATER-A WONDER LIQUID EXERCISE - Test Your Concepts (Short Answer)
31 Videos
- WATER-A WONDER LIQUID BOOK - PEARSON IIT JEE FOUNDATIONCHAPTER - WATER-A WONDER LIQUID EXERCISE - Concept Application
5 Videos
- WATER-A WONDER LIQUID BOOK - PEARSON IIT JEE FOUNDATIONCHAPTER - WATER-A WONDER LIQUID EXERCISE - Test Your Concepts (Very Short Answer) Fill in the blanks
25 Videos
- WATER - A WONDER LIQUIDBOOK - PEARSON IIT JEE FOUNDATIONCHAPTER - WATER - A WONDER LIQUIDEXERCISE - Crossword
1 Videos
Similar Questions
Knowledge Check
When steam condenses into water its
Atemperature remains the sameBheat dissipatesCtemperature increasesDtemperature decreasesA block of ice −10∘C is slowly heated and converted to steam at 100∘C. Which of the following curves represent the phenomenon qualitatively?
A B
B C
C D
D
A block of ice at −12∘C is slowly heated and converted into steam at 100∘C. Which of the following curves best represents the event ?
A B
B C
C D
D
A block of ice at temperature −20∘C is slowly heated and converted to steam at 100∘C. Which of the following diagram is most appropriate?
View SolutionA block of ice at −10∘C is slowly heated and converted to steam at 100∘C. Which of the following curves represents the phenomenon qualitatively?
View SolutionWhich one of the following is a condensation polymer ?
View SolutionWhich one of the following is not a condensation polymer?
View Solutiona block of ice at temperature −20∘C is slowly heated and converted to steam at 100∘C which of the following diagram is most appropriate
View Solution
