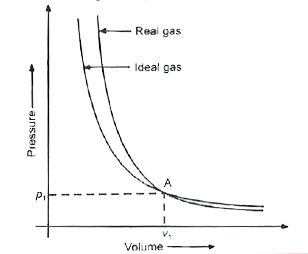
Pressure versus volume graph for real gas and are shown in figure. Answer the following question on the basis of this graph.

(i) Interpret the behaviour of real gas with respect to ideal gas at low pressure.
(ii) Interpret the behaviour of real gas with respect to ideal gas at high pressure.
(iii) Mark the pressure and volume by drawing a line at the point where real gas behaves as an ideal gas.
Video Solution
Text Solution
(i) At low pressure, the two curves almost coincide. This shows that at low pressure, the real gases show very small deviation from ideal behaviour.
(ii) At high pressure, the curves are far apart. This shows that real gases show large deviations at high pressure.
(iii) At point A, where the two curves intersect each other, the real gas behaves exactly like ideal gas and the pressure and volume corresponding to this point the .

|
Topper's Solved these Questions
- STATES OF MATTER : GASES AND LIQUIDSBOOK - MODERN PUBLICATIONCHAPTER - STATES OF MATTER : GASES AND LIQUIDSEXERCISE - NCERT FILE NCERT (EXemplar Problems) (Matching Type Question)
3 Videos
- STATES OF MATTER : GASES AND LIQUIDSBOOK - MODERN PUBLICATIONCHAPTER - STATES OF MATTER : GASES AND LIQUIDSEXERCISE - NCERT FILE NCERT (EXemplar Problems) (Assertion and Reason Type Questions)
6 Videos
- STATES OF MATTER : GASES AND LIQUIDSBOOK - MODERN PUBLICATIONCHAPTER - STATES OF MATTER : GASES AND LIQUIDSEXERCISE - NCERT FILE (NCERT)(Textbook Exercises)
23 Videos
- SOME BASIC CONCEPTS OF CHEMISTRY BOOK - MODERN PUBLICATIONCHAPTER - SOME BASIC CONCEPTS OF CHEMISTRY EXERCISE - COMPETITION FILE (INTEGER TYPE AND NUMERICAL VALUE TYPE QUESTIONS)
10 Videos
- STRUCTURE OF ATOMBOOK - MODERN PUBLICATIONCHAPTER - STRUCTURE OF ATOMEXERCISE - Unit Practice Test
13 Videos
Similar Questions
Knowledge Check
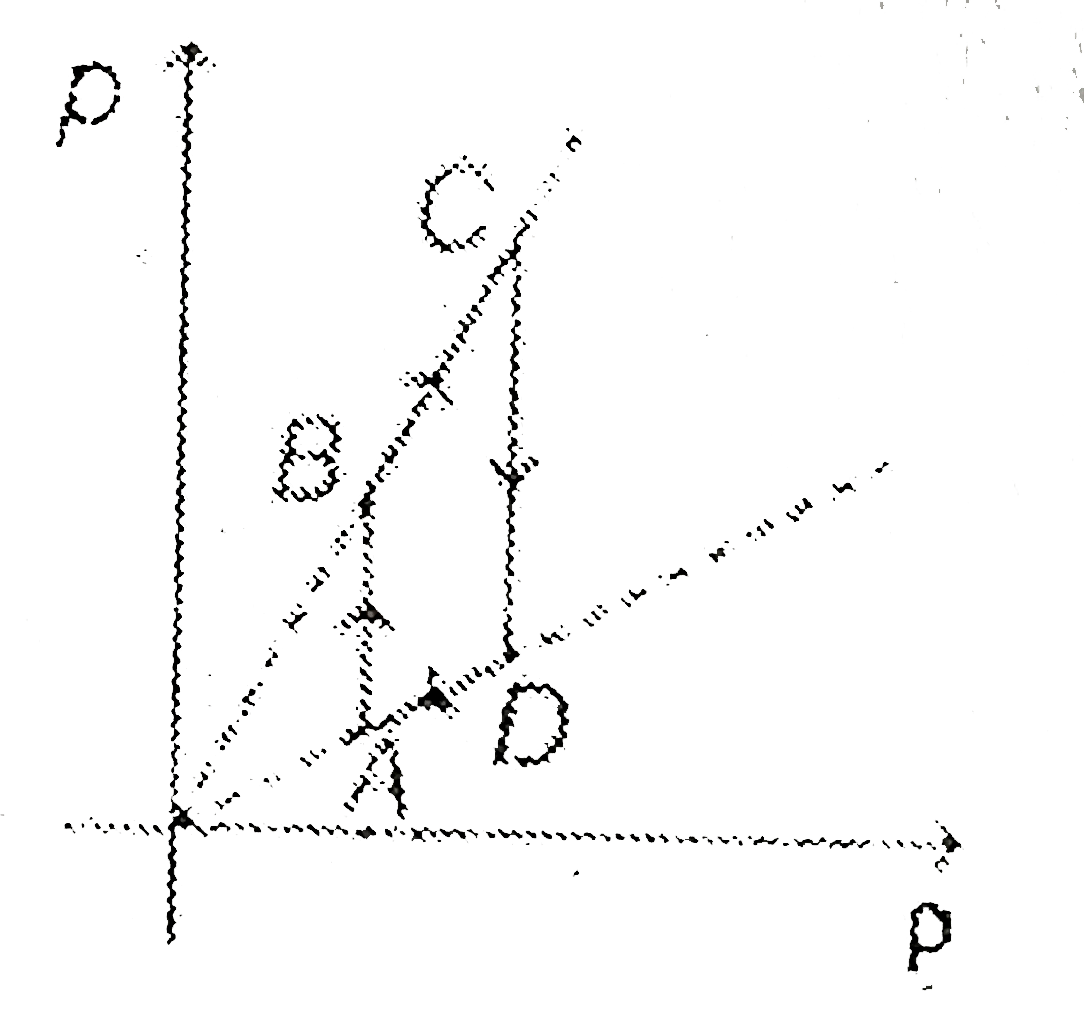
Pressure versus density graph of an ideal gas is shown in figure
 Aduring the process AB work done by the gas is positiveBduring the process AB work done by the gas is negativeCduring the process BC internal energy of the gas is increasingDNone of the above
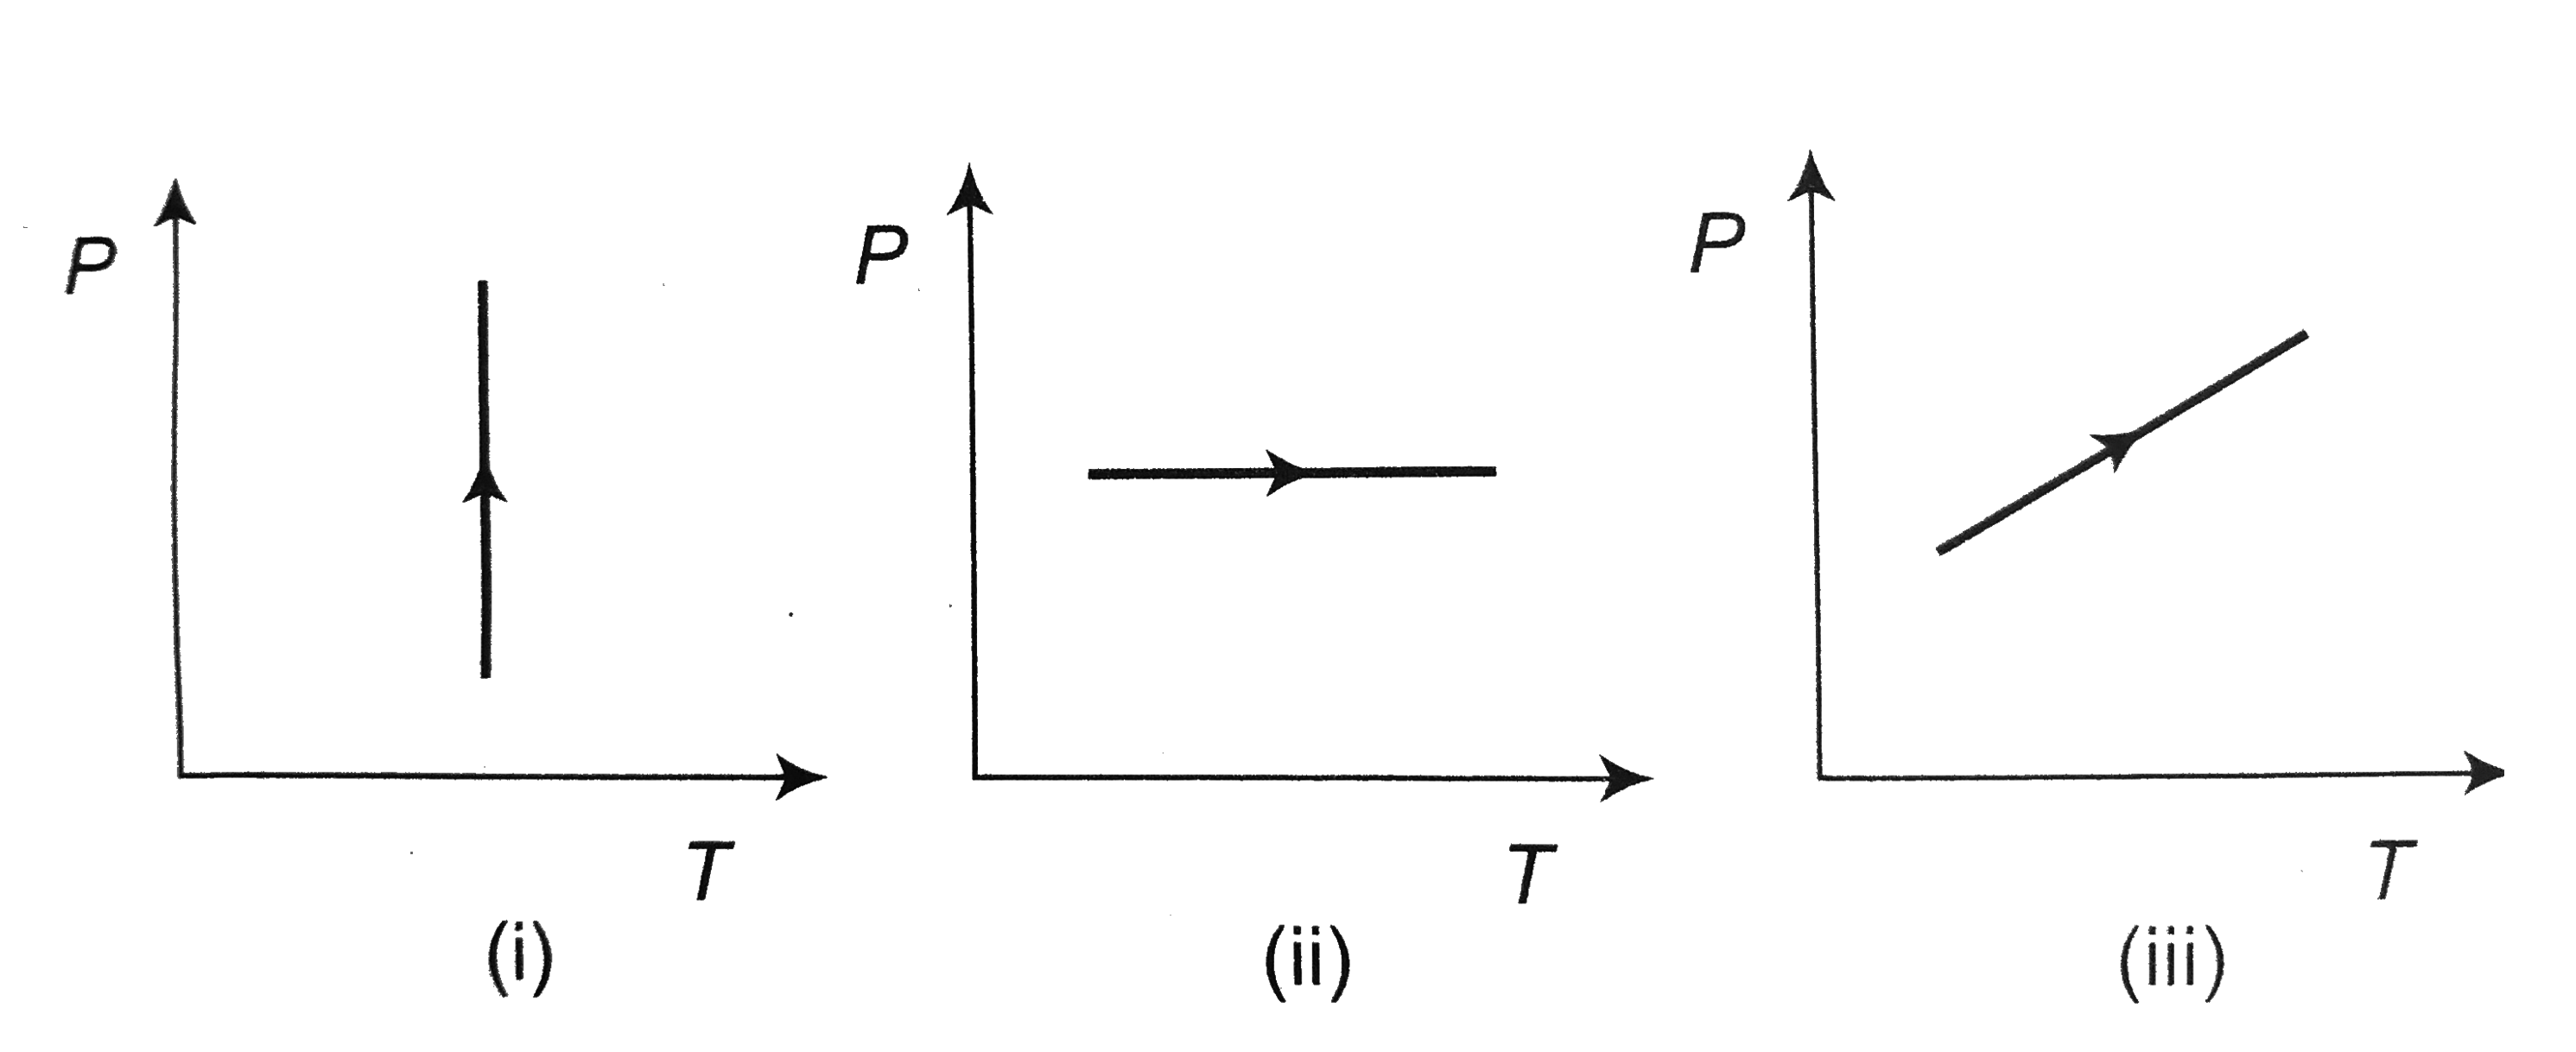
Pressure versus temperature graphs of an ideal gas are as shown in figure. Choose the wrong statement
 ADensity of gas is increased in graph (i)BDensity of gas is decrease in graph (ii)CDensity of gas is constant in graph (iii)DNone of these
Real gas will approach the behaviour of ideal gas at
Alow temperature and high pressureBhigh temperature and low pressureClow temperature and low pressureDhigh temperature and high pressure
Real gas will approach the behaviour of ideal gas at
View SolutionThe compressibilty factor for a real gas at high pressure is:
View SolutionThe product of the pressure and volume of an ideal gas is
View SolutionThe product of the pressure and volume of an ideal gas is
View SolutionWhich of the following graphs represent the behaviour of an ideal gas ?
View Solution

