Rate of reaction (r ) is plotted against temperature (T) for an enzyme catalysed reaction. Which of the following is correct representation ?
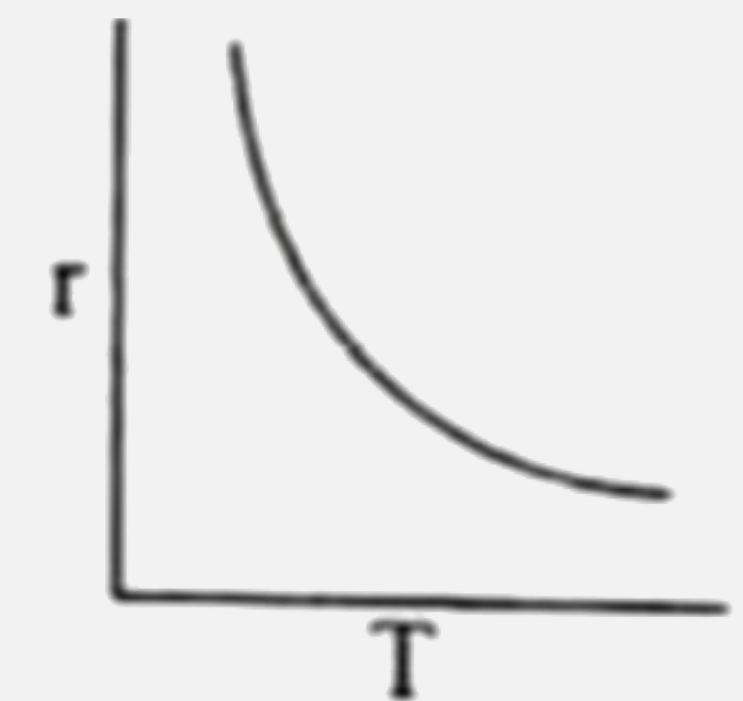
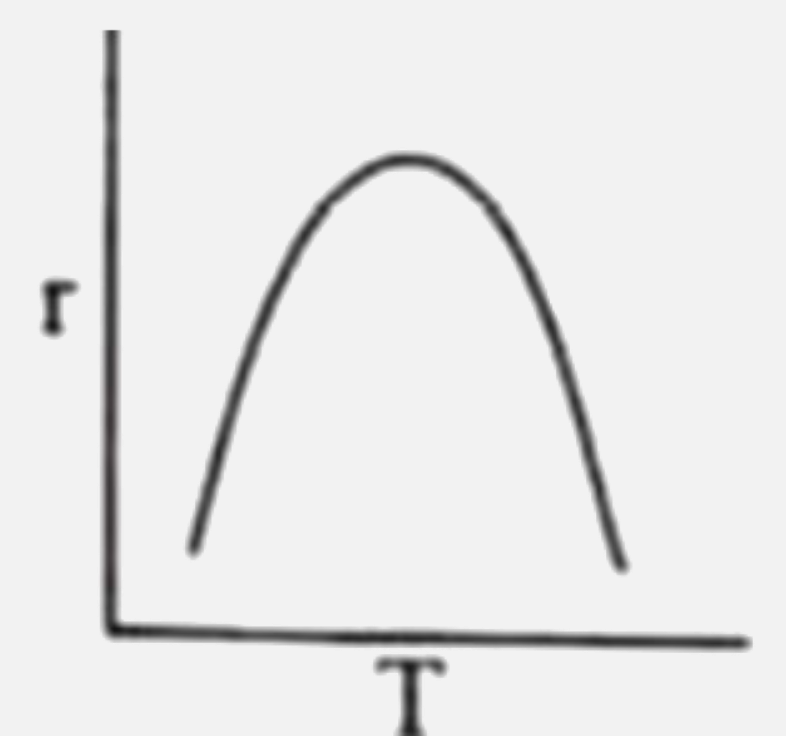
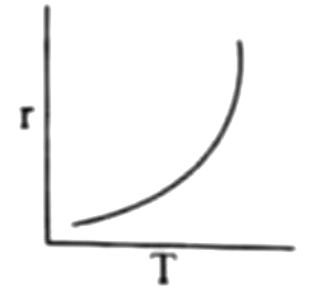
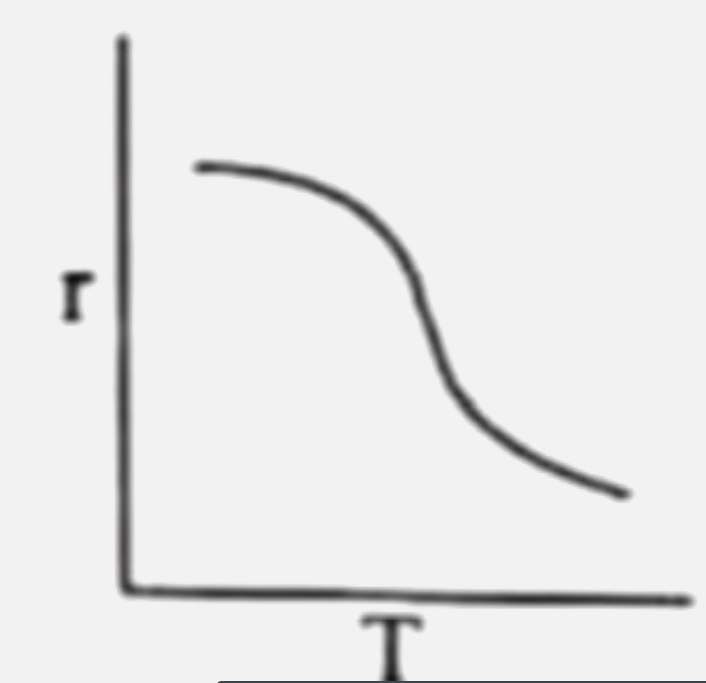
The correct Answer is:B
To solve the question regarding the correct representation of the rate of an enzyme-catalyzed reaction plotted against temperature, we can follow these steps:
1. Understand the Concept of Enzyme Activity:
- Enzymes are biological catalysts that speed up reactions. Their activity is influenced by temperature. Each enzyme has an optimum temperature at which it functions best.
2. Identify the Optimum Temperature:
- For many enzymes, the optimum temperature is around 35°C to 40°C. At this temperature, the rate of reaction is at its peak.
3. Analyze the Behavior of Enzymes with Temperature:
- As temperature increases towards the optimum temperature, the kinetic energy of the enzyme and substrate molecules increases, leading to an increase in the rate of reaction.
- Beyond the optimum temperature, the enzyme starts to denature, which means it loses its functional shape. This denaturation leads to a decrease in the rate of reaction.
4. Graph Representation:
- The graph of rate (R) versus temperature (T) will show an increase in the rate of reaction as temperature rises until it reaches the optimum temperature. After this point, the rate will sharply decline due to denaturation of the enzyme.
5. Select the Correct Option:
- Based on the behavior described, the correct graph representation will show a rise in the rate of reaction up to the optimum temperature and a subsequent decline after that. From the options provided (A, B, C, D), option B is the correct representation.
Final Answer:
The correct representation of the rate of an enzyme-catalyzed reaction plotted against temperature is option B.
- Enzymes are biological catalysts that speed up reactions. Their activity is influenced by temperature. Each enzyme has an optimum temperature at which it functions best.
- For many enzymes, the optimum temperature is around 35°C to 40°C. At this temperature, the rate of reaction is at its peak.
- As temperature increases towards the optimum temperature, the kinetic energy of the enzyme and substrate molecules increases, leading to an increase in the rate of reaction.
- Beyond the optimum temperature, the enzyme starts to denature, which means it loses its functional shape. This denaturation leads to a decrease in the rate of reaction.
- The graph of rate (R) versus temperature (T) will show an increase in the rate of reaction as temperature rises until it reaches the optimum temperature. After this point, the rate will sharply decline due to denaturation of the enzyme.
- Based on the behavior described, the correct graph representation will show a rise in the rate of reaction up to the optimum temperature and a subsequent decline after that. From the options provided (A, B, C, D), option B is the correct representation.
The correct representation of the rate of an enzyme-catalyzed reaction plotted against temperature is option B.
Topper's Solved these Questions
Similar Questions
Knowledge Check
Rate of reaction (r ) is plotted against temperature (T) for an enzyme catalysed reaction. What of the following is correct representation ?
A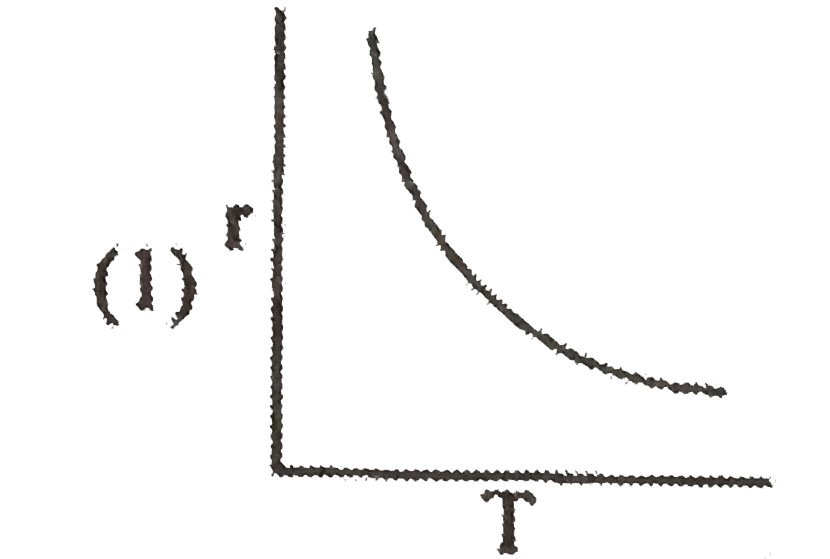 B
B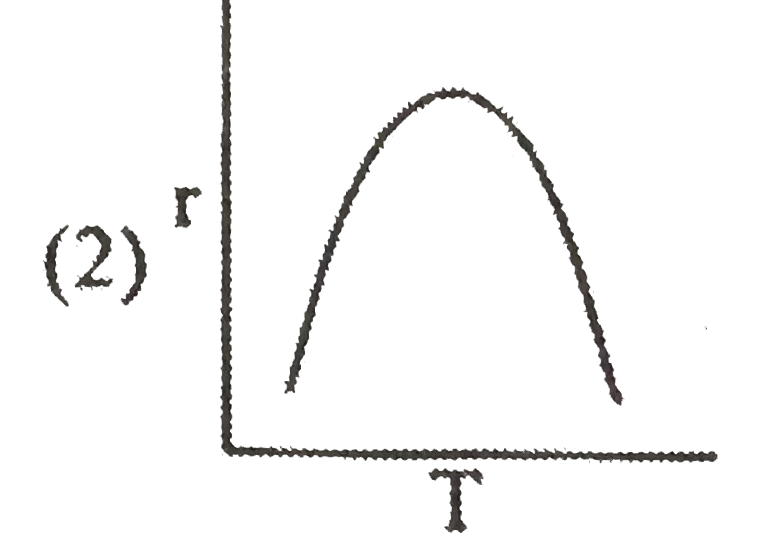 C
C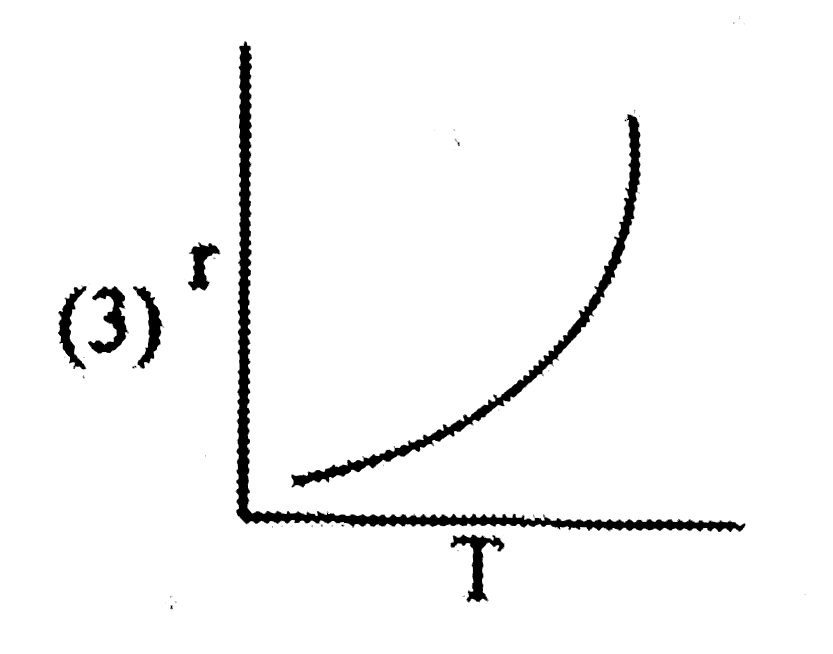 D
D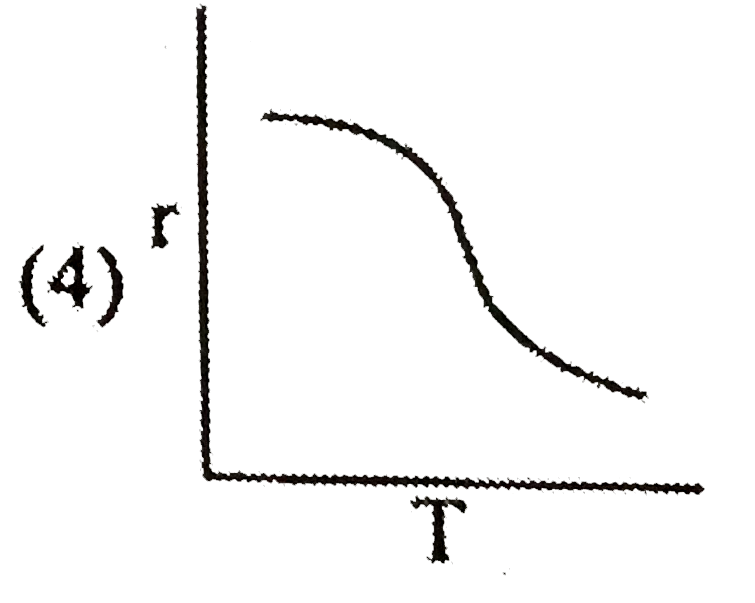
How do enzymes catalyse the reaction ?
ABy holding the substrate molecule for chemical reactionBBy providing functional groups which will attack the substrate to carry out chemical reactionCBoth (1) & (2)DNeither (1) & (2)The first step of an enzyme catalysed reaction is :
AThe enzyme breaks the chemical bond of the substrate .BThe enzyme releases the product of the reaction.CThe substrate binds to the active site of the enzyme.DThe binding site reacts with the substrate forming the enzyme product complex.
The reactant in an enzyme-catalysed reaction is called the
View SolutionRate of which reactions increases with temperature:
View SolutionRate of which reaction increase with temperature:
View SolutionRate of which reactions increases with temperature:
View SolutionRate of which reactions increases with temperature:
View Solution

