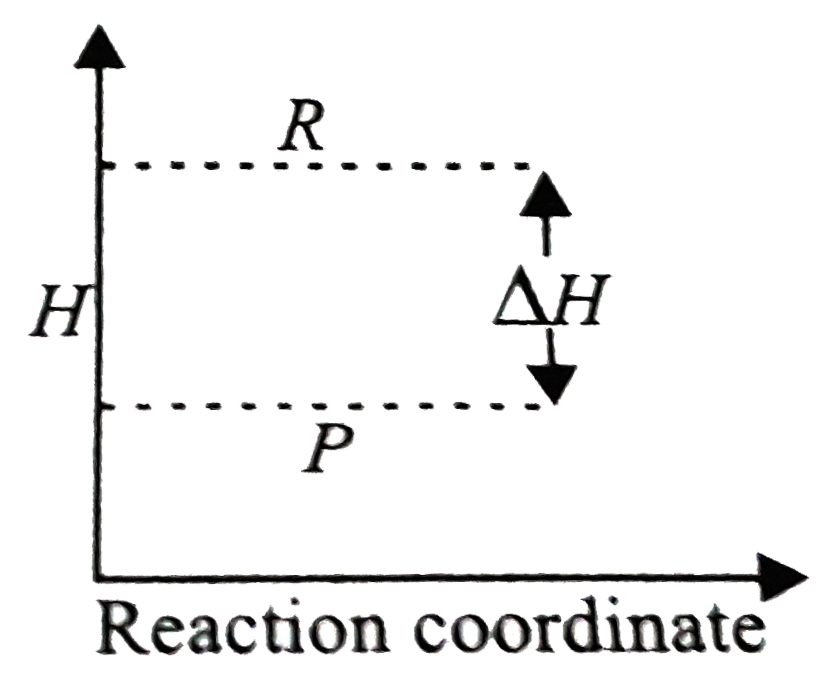
Study the given graph and choose the correct option.
A
ΔH= Net heat absorbed from the surroundings
B
ΔH= Net heat given to the surroundings
C
ΔH=+ve for the reaction
D
ΔH= Total energy possessed by the reactants
Video Solution
Text Solution
The correct Answer is:B
It shows that that the reaction is exothermic acid ΔH is the heat given to the surroundings.
|
Topper's Solved these Questions
- THERMODYNAMICSBOOK - NCERT FINGERTIPSCHAPTER - THERMODYNAMICSEXERCISE - Gibbs Energy Change And Equilibrium
4 Videos
- THERMODYNAMICSBOOK - NCERT FINGERTIPSCHAPTER - THERMODYNAMICSEXERCISE - Higher Order Thinking Skills
8 Videos
- THERMODYNAMICSBOOK - NCERT FINGERTIPSCHAPTER - THERMODYNAMICSEXERCISE - Enthalpies For Different Type Of Reaction
22 Videos
- THE S-BLOCK ELEMENTSBOOK - NCERT FINGERTIPSCHAPTER - THE S-BLOCK ELEMENTSEXERCISE - Assertion And Reason
15 Videos
Similar Questions
Knowledge Check
Study the given figure and choose the correct option -
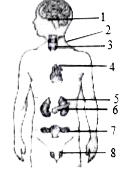 A2.→ Parathormone
6.→ islets of langerhans
8.→ ICSH production
3.→ ThyroxineB5.→ Adrenaline
1. → FSH production 8.→ Testosterone
4.→ ImmunityC1.→ Master gland
8.→ ICSH production 6.→ Thyroxine
5.→ AdrenalineD7.→ LH production
8.→ Testosterone
6.→ Insulin
4.→ Thyroxinefor the given figure, choose the correct option
 AThe body Is In rotational equilibriumBF=net ext0Cτ=net ext0DBoth (1) and (2) are correct
Consider the following graph and choose the correect option
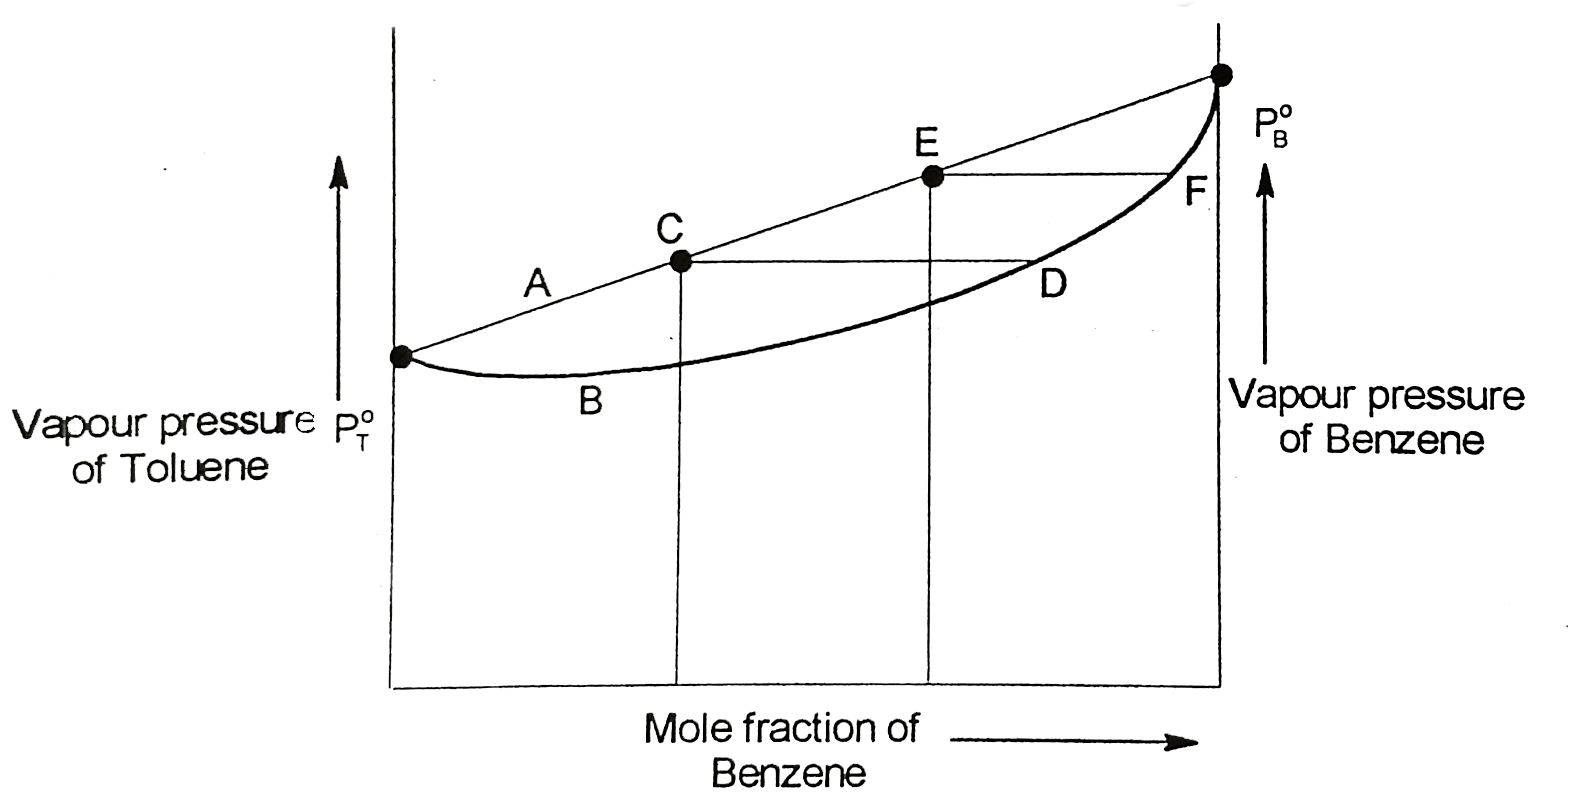 AA represent vapour compsition and B represent liquid compositionBAt the state E of the system the vapour phase just start forming and its vapour phase composition will correspond to the point CCAt the state C of the system the vapor phase just start forming and its vapour phase composition will correspond to the point DDA and B both represent vapour composition.
Identify the given animal and choose the correct option.

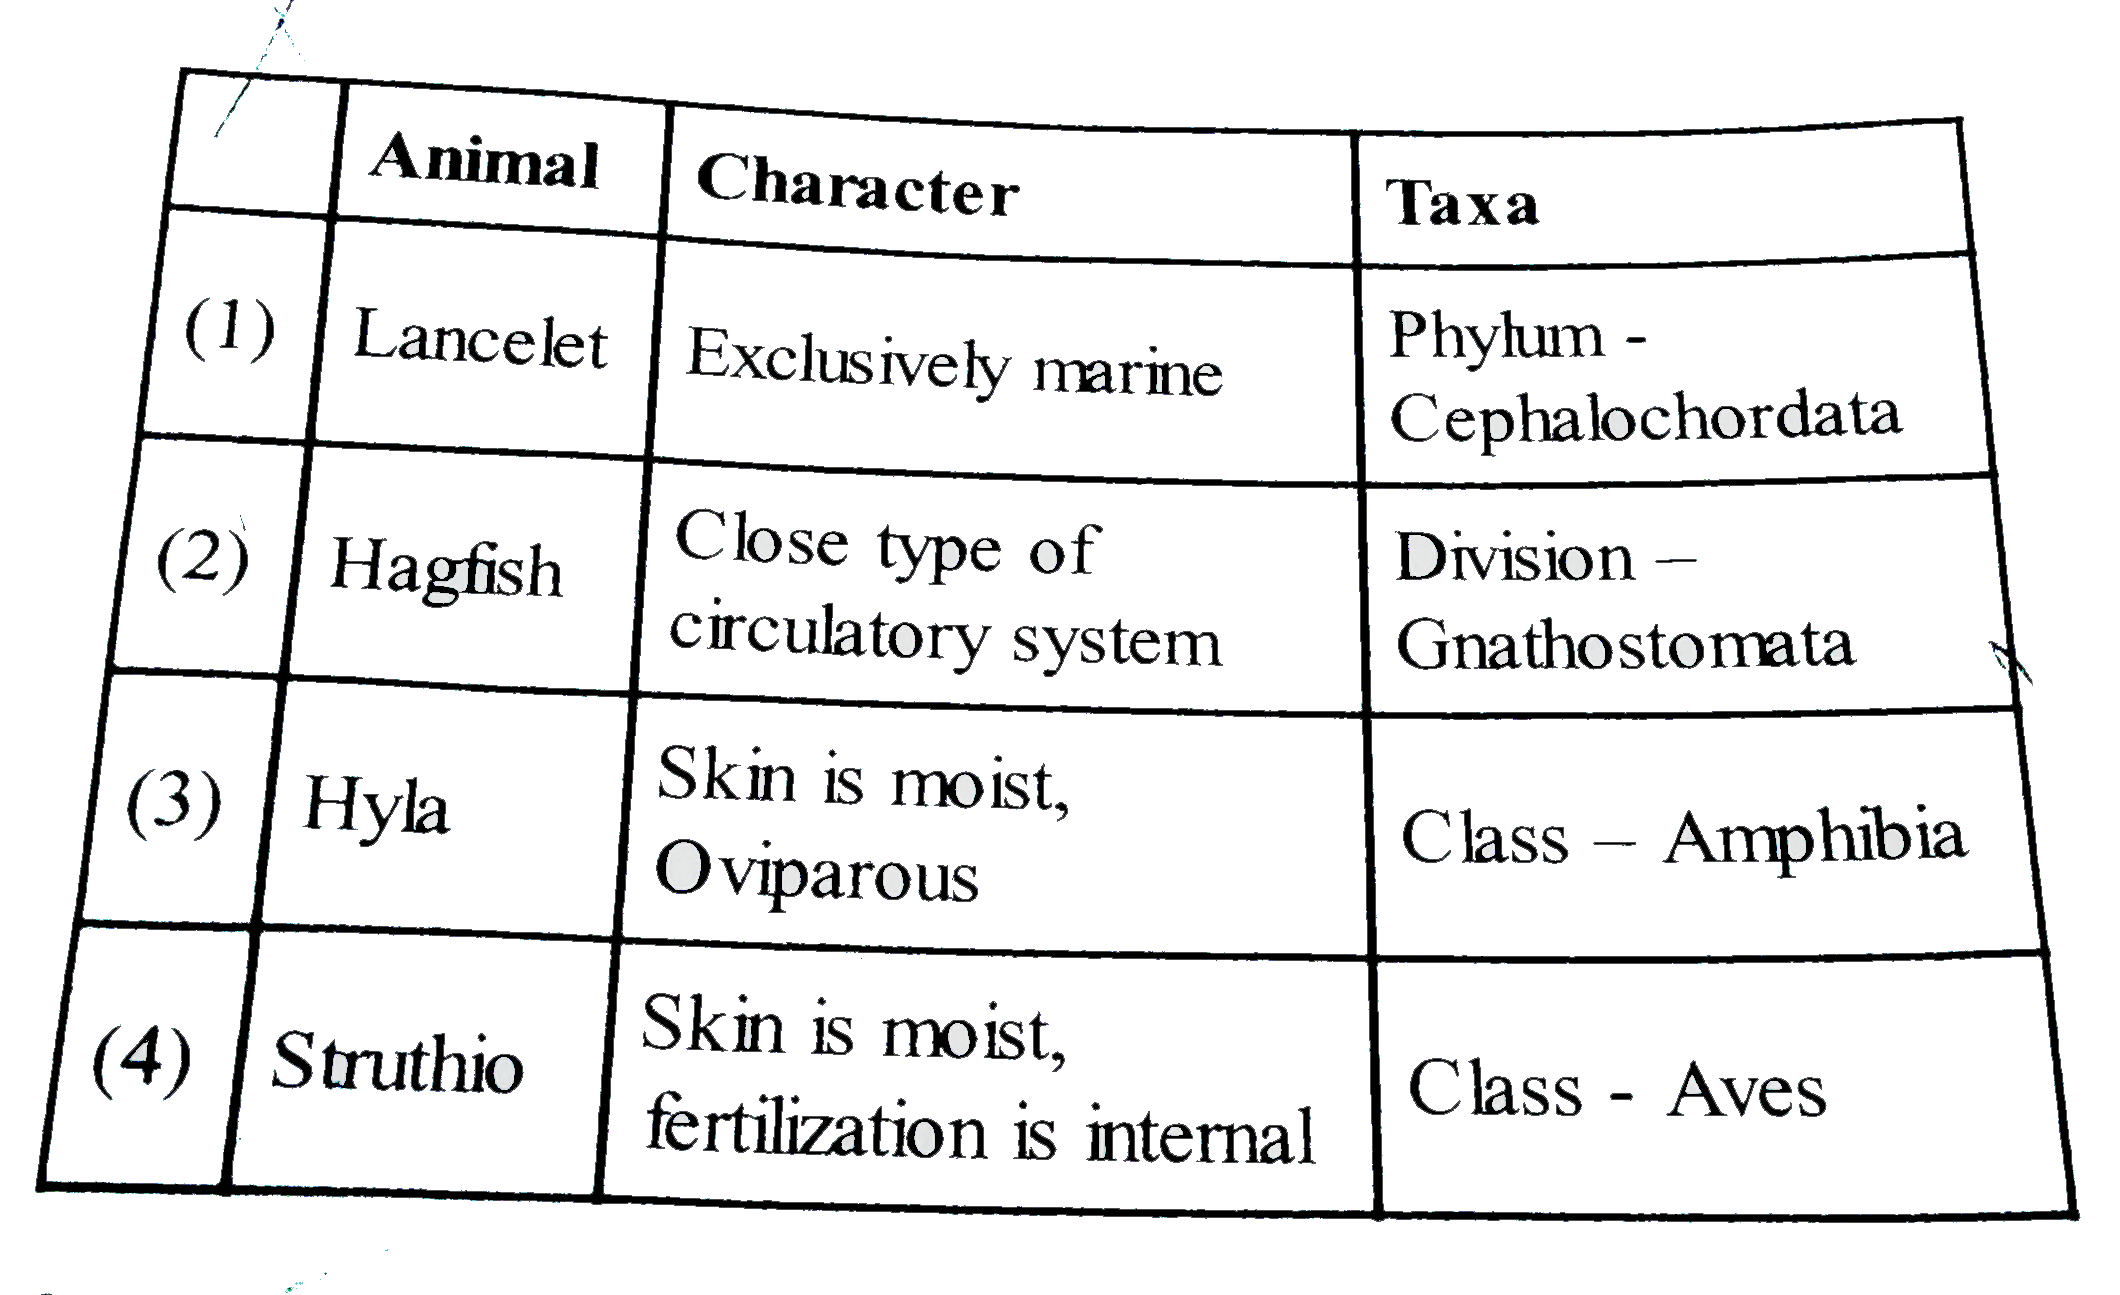
View SolutionStudy the given table and select the correct option :
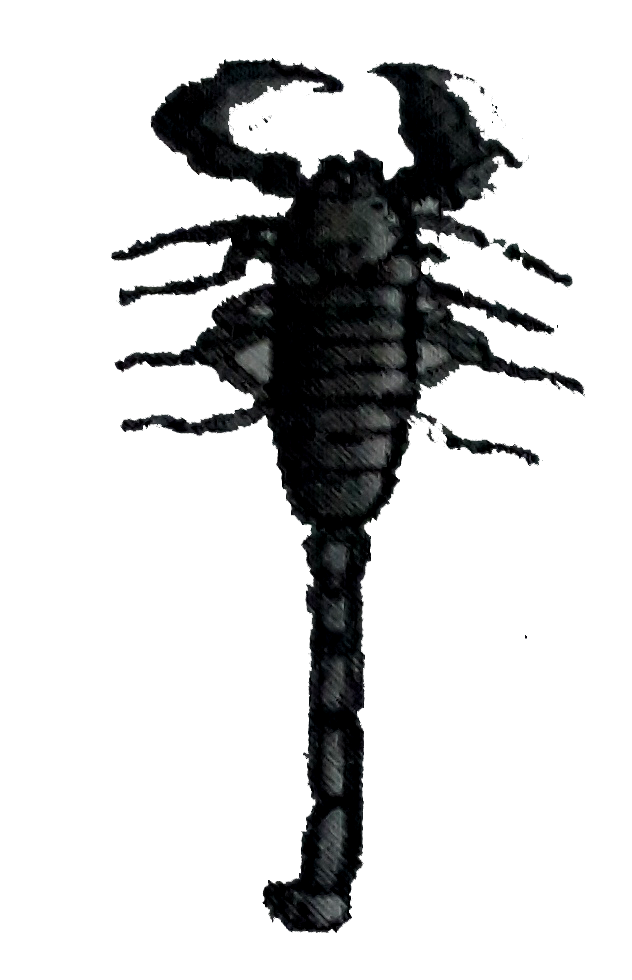
View SolutionStudy the given animal and select the correct option for this animal :
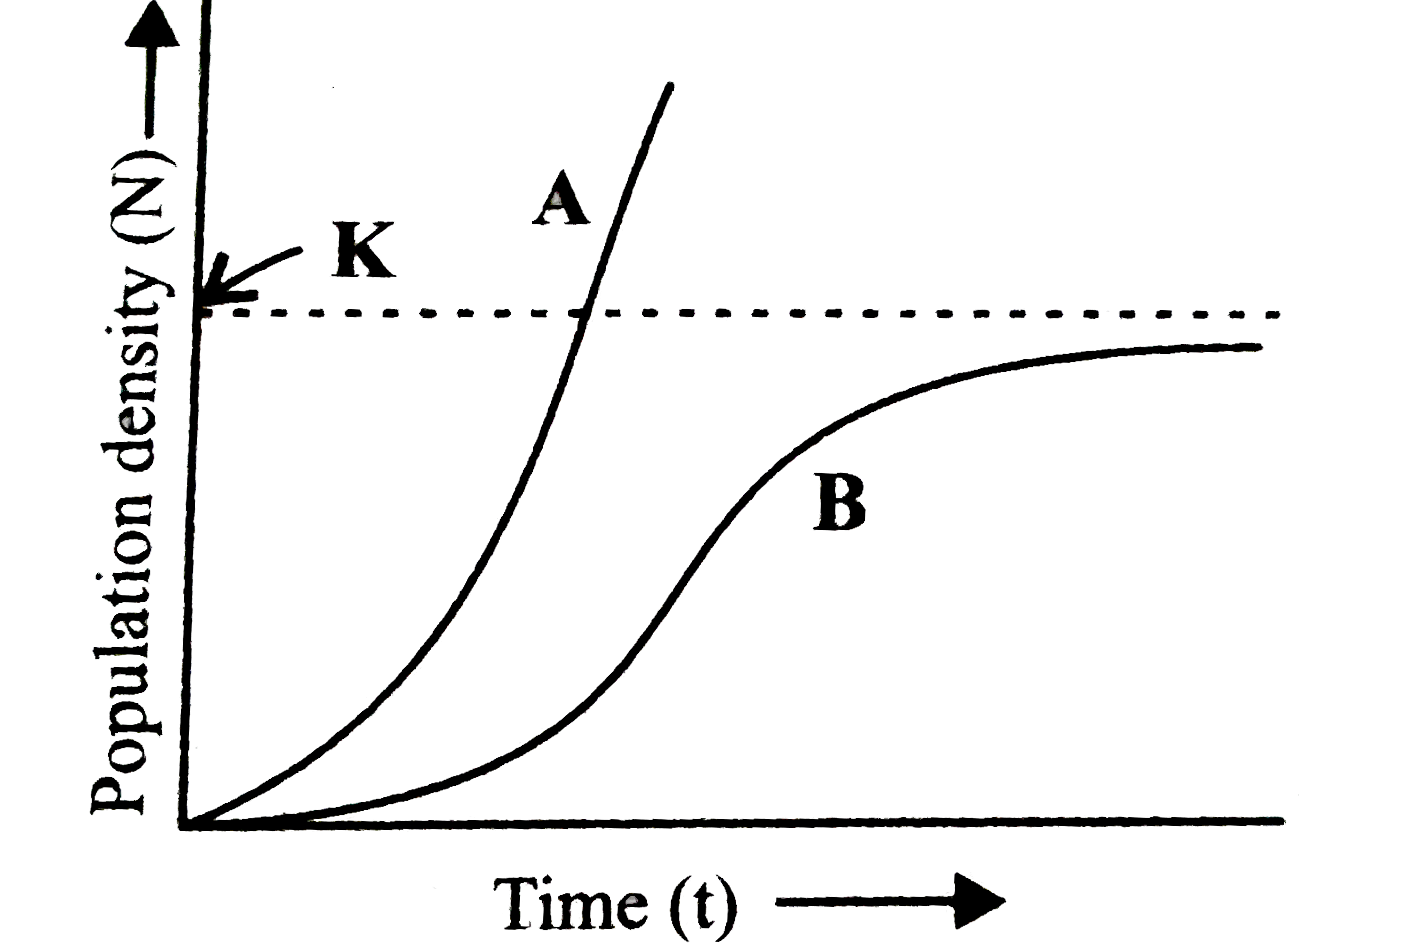
View SolutionStudy the population growth curves (A and B) in the given graph and select the incorrect option.
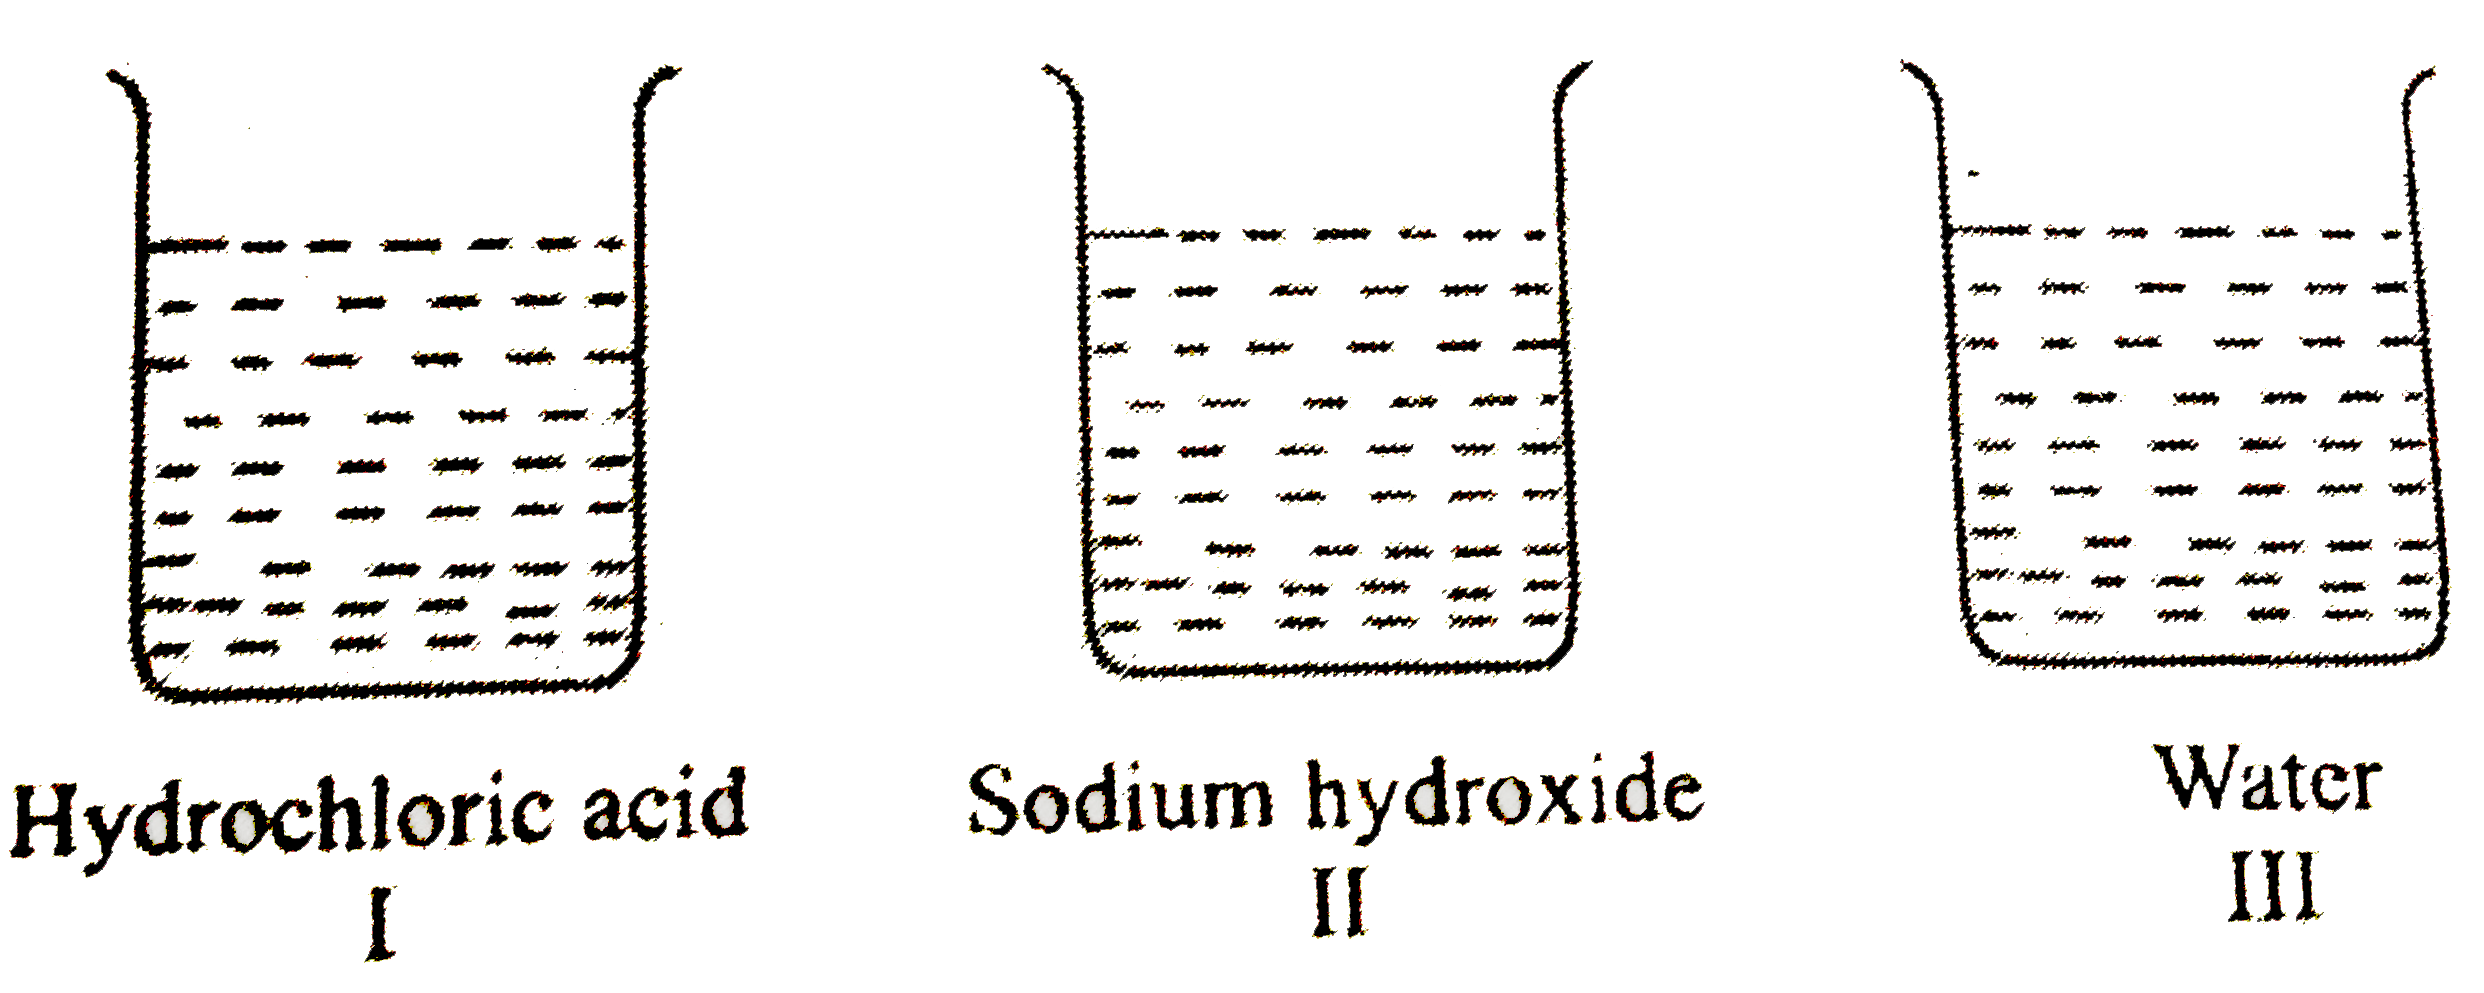
View SolutionObserve the given figures and choose the correct option:
View Solution

