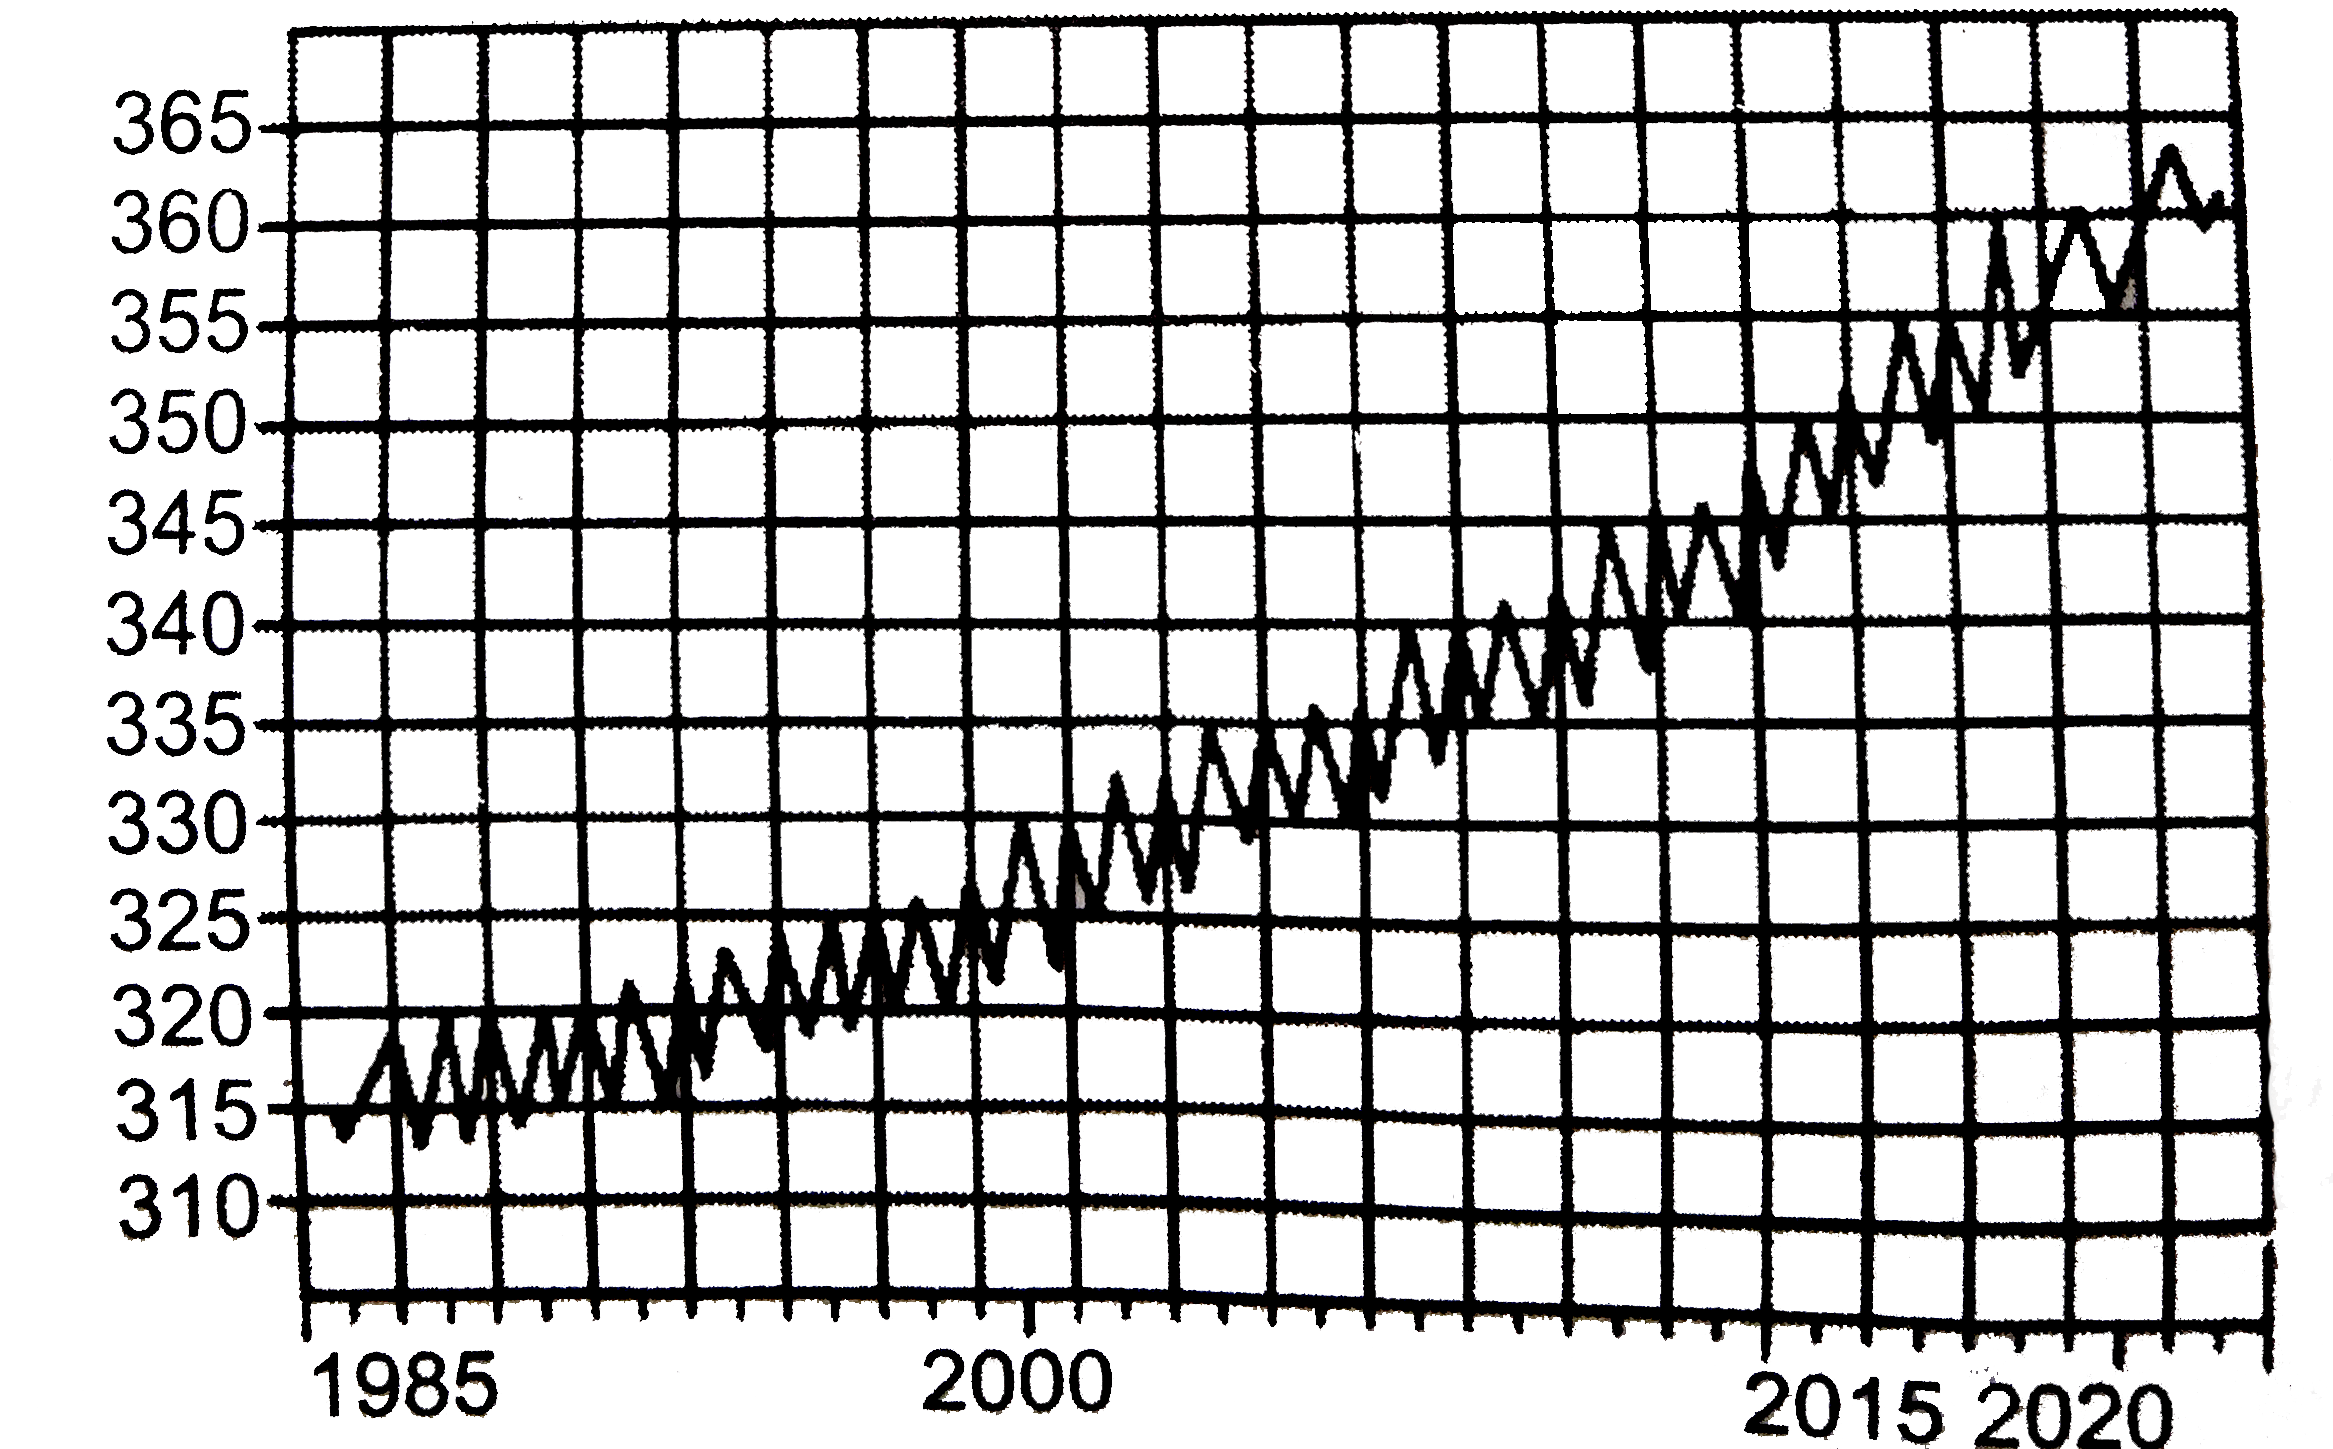
The figure shows increase in CO2 content (ppm) from 1985 to 2015 in Delhi. The peaks come in about June and the valleys in January each year. Increase in CO2 content from 1985 to 2015 is about.
10%
15%
20%
30%
The correct Answer is:A
From figure , CO2 content in 1985=318p±
CO2 content in 2015=351p±
Increase in 30 years=33ppm
Percentage increase w.r.t. 1985value=33×100318=10.37%.
Topper's Solved these Questions
- ENVIRONMENTAL CHEMISTRYBOOK - A2ZCHAPTER - ENVIRONMENTAL CHEMISTRYEXERCISE - Section B - Assertion Reasoning
14 Videos
- ENVIRONMENTAL CHEMISTRYBOOK - A2ZCHAPTER - ENVIRONMENTAL CHEMISTRYEXERCISE - AIPMT/NEET Questions
10 Videos
- CLASSIFICTION, PURIFICATION AND NOMENCLATURE OF ORGANIC COMPOUNDSBOOK - A2ZCHAPTER - CLASSIFICTION, PURIFICATION AND NOMENCLATURE OF ORGANIC COMPOUNDSEXERCISE - Section D - Chapter End Test
30 Videos
- HYDROCARBONSBOOK - A2ZCHAPTER - HYDROCARBONSEXERCISE - Section D - Chapter End Test
30 Videos
Similar Questions
List any three human activities which would lead to an increase in the carbon dioxide content of air.
View SolutionThe following graph shows the production of cement (in lakh tons) of four factories A, B, C and D over the years
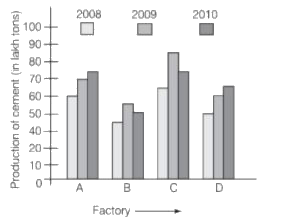
The percentage increase in production of cement by factory B from 2008 to 2009 is about
View Solution
Knowledge Check
CO2 content of atmosphere is about
A6.5%B3.334%C0.34%D0.034%The CO2 content by volume, in the atmospheric air is about
A3.34%B4%C0.0314%D2.1%CO2 content of atmosphere has increased in the last 150 years from
A25 to 35 ppmB270 to 340ppmC0.027 to 0.34ppmD0.2 to 0.3 ppm
What is the work done in increasing the angular frequency of a circular ring of mass 2kg and radius 25cm from 10rpm to 20rpm about its axis?
View SolutionThe bar chart given below shows the number of mobile phone thefts in 2 cities Delhi and Jaipur from month February 2015 to June 2015.
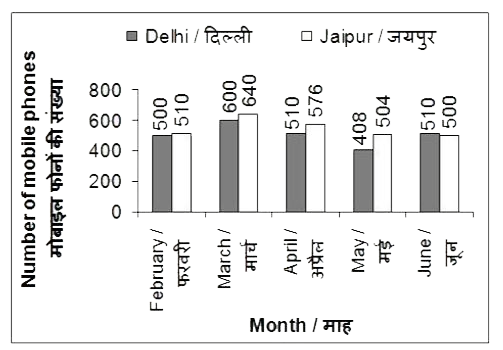
In Delhi, what was the percentage change in the number of mobile phones theft from April 2015 to May 2015?
View SolutionThe CO2 emissions in million metric tons over 3 years are given in the following table .
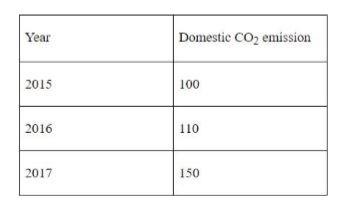
What is the increase in the percentage of CO2 emission from year 2016 to 2017 ?
View SolutionThe work done in increasing the angular frequency of a circular ring of mass 2kg and radius 25cm from 10rpm to 20rpm about is axis
View SolutionThe line chart given below shows the number of students in 2 sections X and Y from year 2009 to 2016.
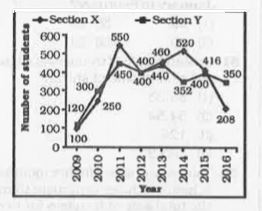
What is the percentage change in the number of students in section Y from year 2011 to year 2015?
View Solution
