The following mechanism has been proposed for the exothermic catalyzed cmplex reaction:
A+BFast−−→IABk1−−→AB+Ik2−−→P+A
If k1 is much smaller than k2, the most suitable qualitative plot of potential energy (PE) versus reaction coordinates for the above reaction is
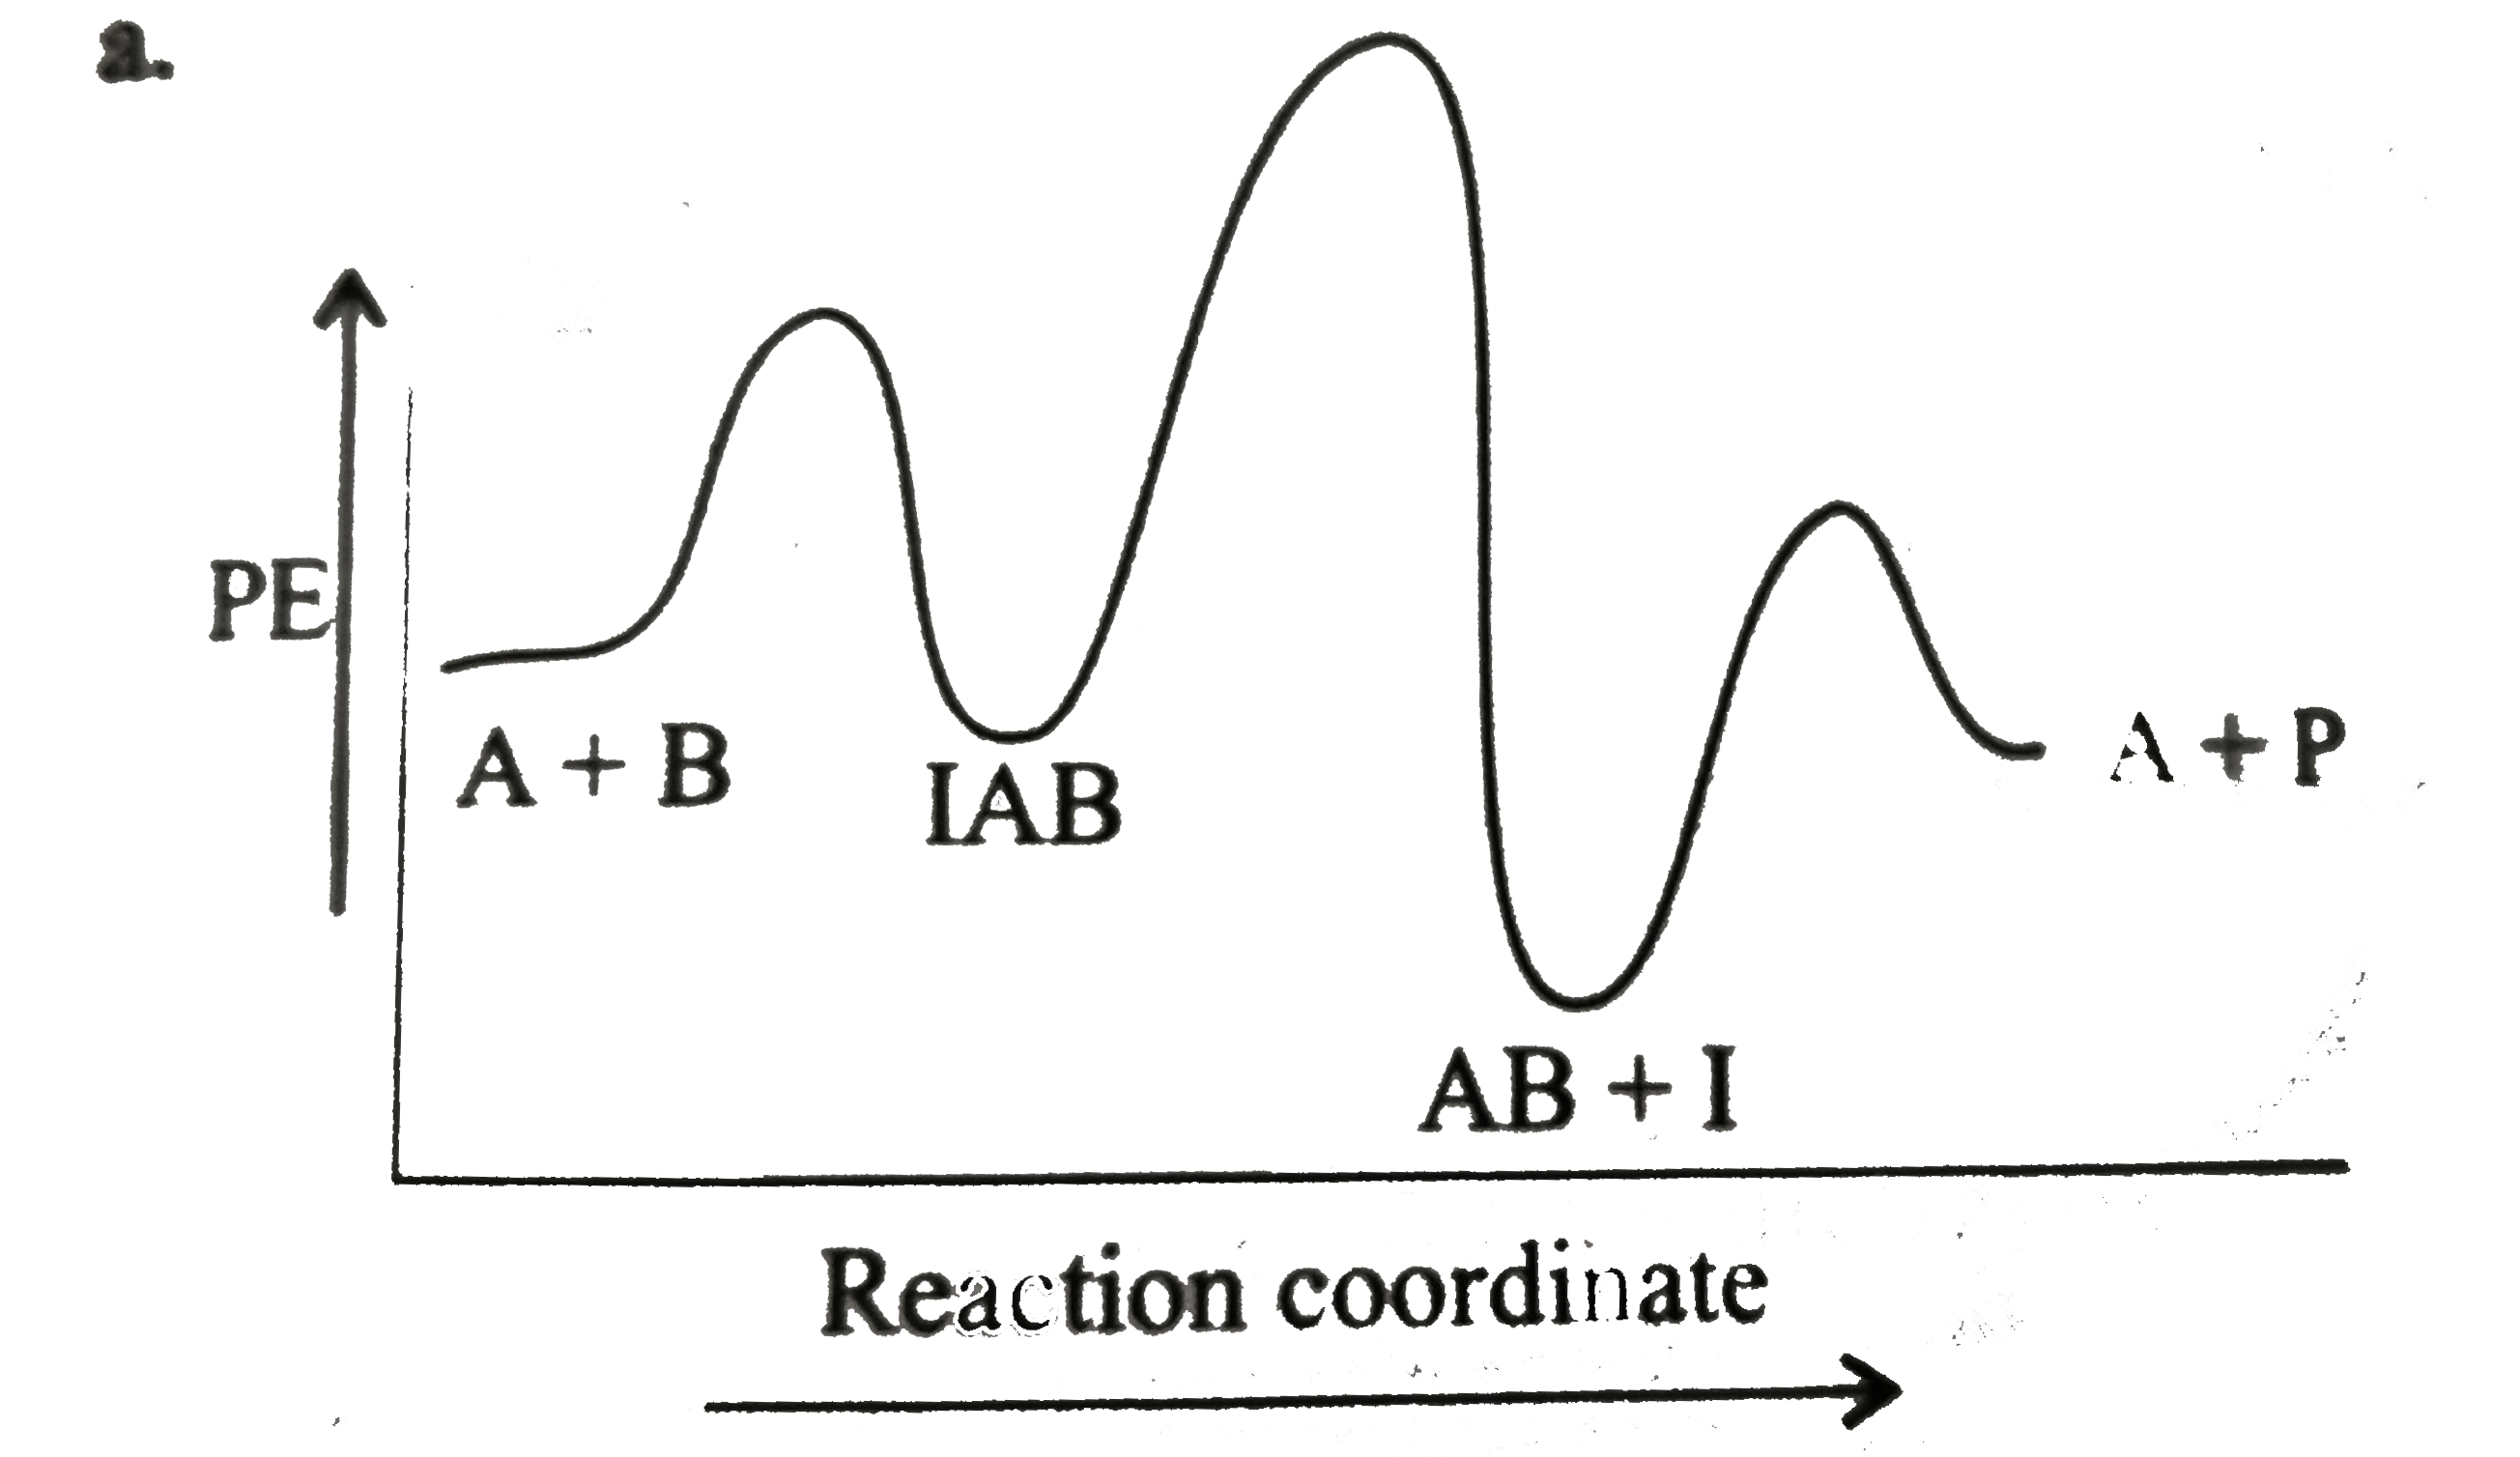
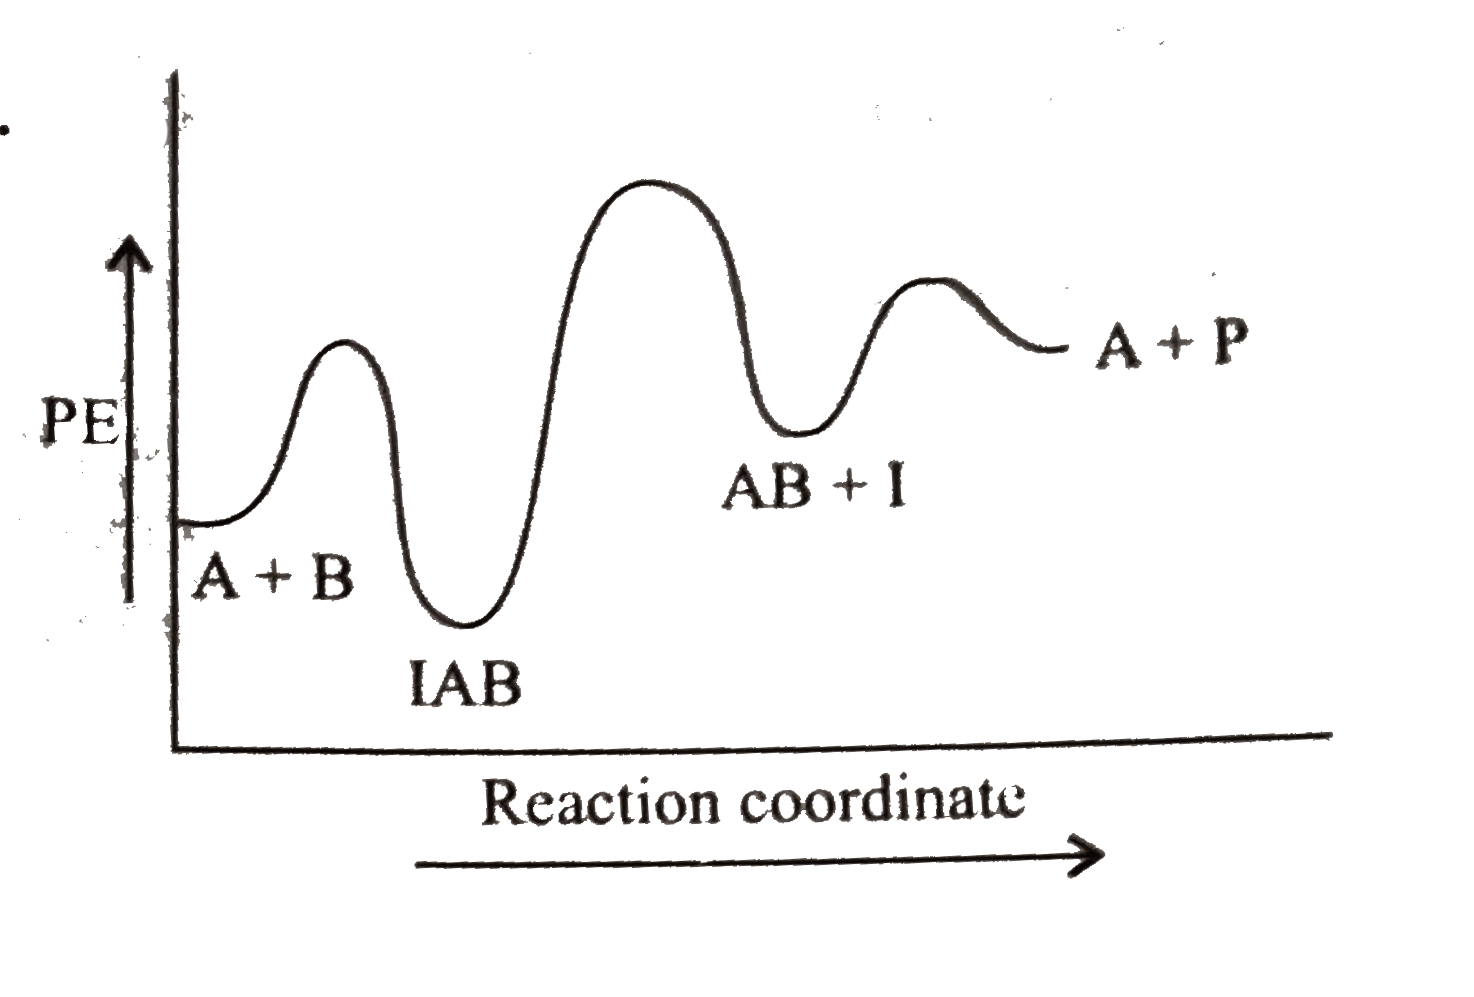
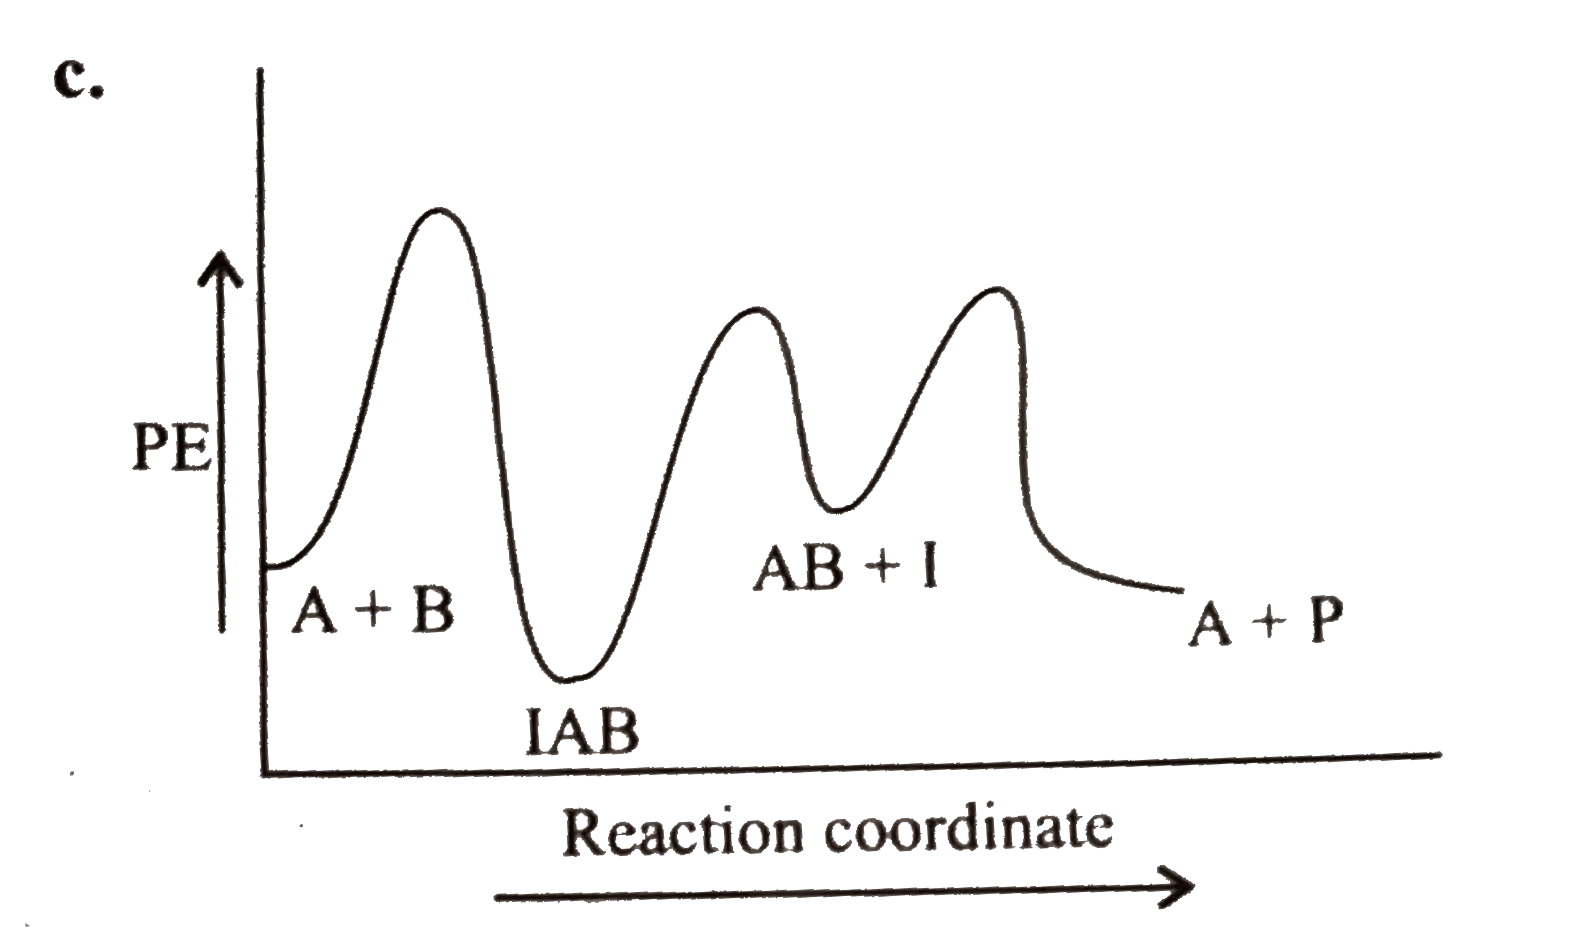
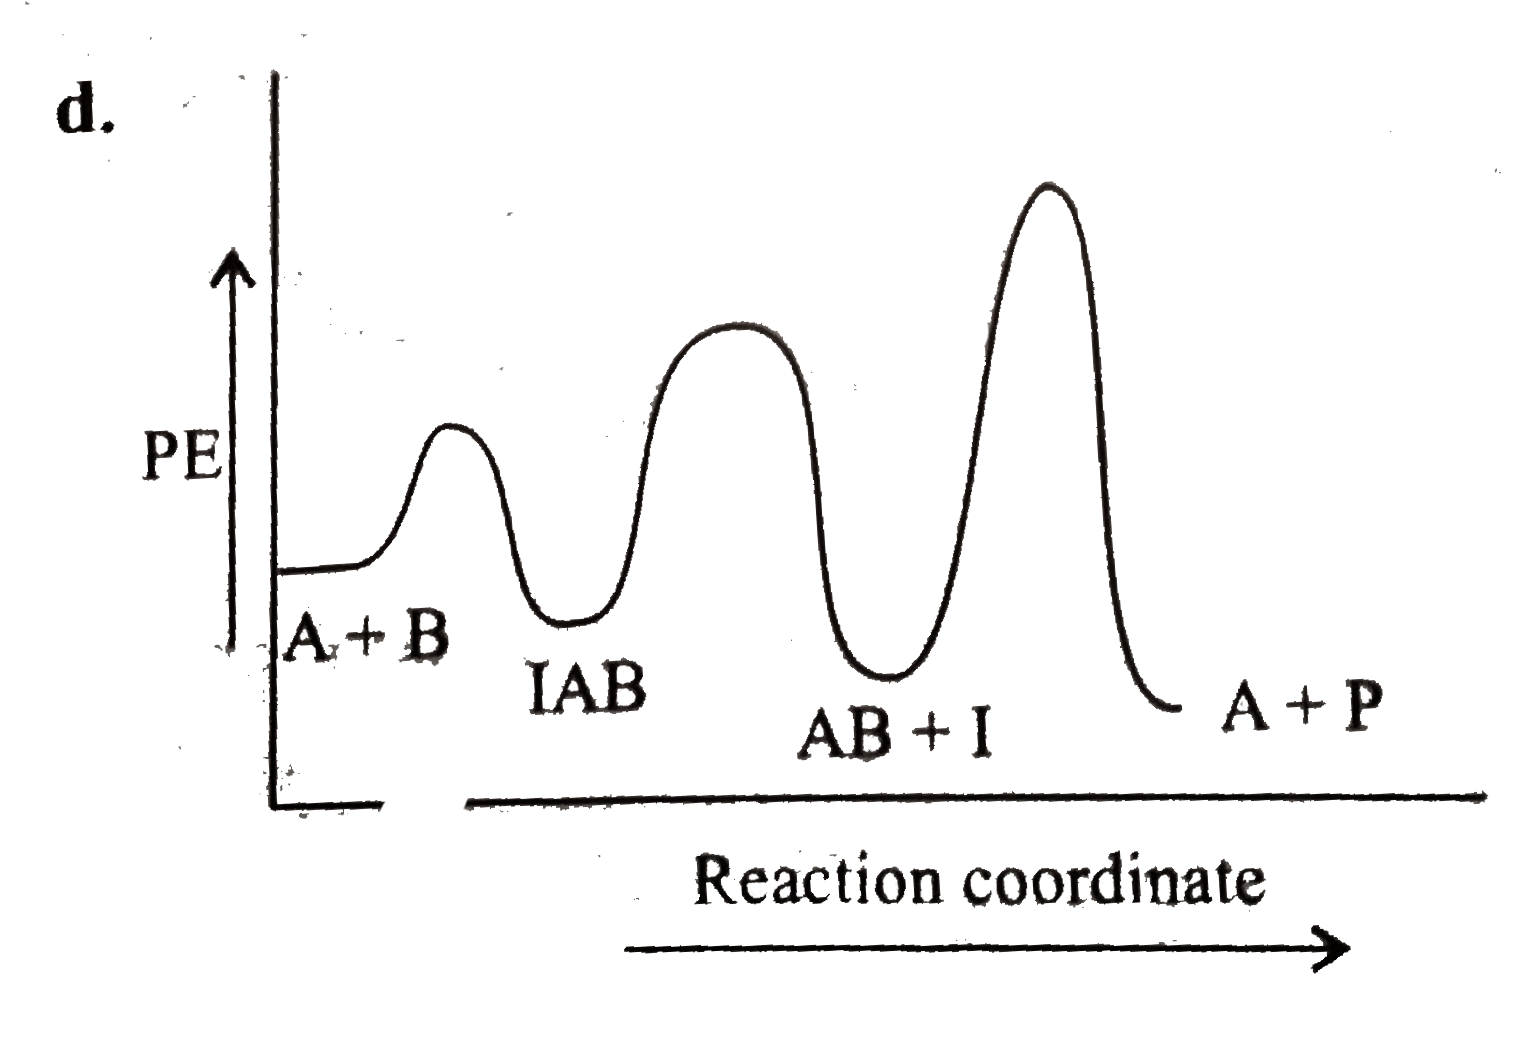
The correct Answer is:D
To solve the problem regarding the potential energy (PE) versus reaction coordinates for the given exothermic catalyzed complex reaction mechanism, we will analyze the steps involved in the reaction and the implications of the rate constants k1 and k2.
1. Understanding the Reaction Mechanism:
The reaction is given as:
\(
A + B \overset{\text{Fast}}{\rightarrow} I_{AB} \overset{k_1}{\rightarrow} AB + I \overset{k_2}{\rightarrow} P + A
\)
Here, \( I_{AB} \) is an intermediate formed in the first step, which is fast, and the second step leading to the product \( P \) is slower.
2. Identifying the Nature of the Reaction:
Since the reaction is exothermic, the energy of the products \( P \) will be lower than the energy of the reactants \( A + B \). This means that the potential energy diagram will show a decrease in energy from reactants to products.
3. Analyzing Rate Constants:
Given that \( k_1 \) is much smaller than \( k_2 \) (\( k_1 \ll k_2 \)), it indicates that the first step is much slower compared to the second step. This implies that the activation energy for the first step is relatively high, while the second step has a lower activation energy.
4. Drawing the Potential Energy Diagram:
- Start with the energy level of the reactants \( A + B \).
- The first step has a high activation energy barrier, leading to the formation of the intermediate \( I_{AB} \). This will be represented by a peak in the energy diagram.
- After the intermediate, the second step has a lower activation energy barrier, leading to the product \( P \). This will be represented by a smaller peak or a downward slope from the intermediate to the product.
- The final energy level of the products \( P \) will be lower than that of the reactants, indicating an exothermic reaction.
5. Conclusion:
The potential energy diagram will show:
- A high peak for the first step (due to the larger activation energy).
- A lower peak for the second step (due to the smaller activation energy).
- The overall trend will be a decrease in energy from reactants to products.
Final Potential Energy Diagram:
The final diagram will look like this:
PE∣|/||/ (IntermediateIAB)|/∣∣/∣∣∣/⌊_______________(ProductsP)∣∣(ReactantsA+B)
The reaction is given as:
\(
A + B \overset{\text{Fast}}{\rightarrow} I_{AB} \overset{k_1}{\rightarrow} AB + I \overset{k_2}{\rightarrow} P + A
\)
Here, \( I_{AB} \) is an intermediate formed in the first step, which is fast, and the second step leading to the product \( P \) is slower.
Since the reaction is exothermic, the energy of the products \( P \) will be lower than the energy of the reactants \( A + B \). This means that the potential energy diagram will show a decrease in energy from reactants to products.
Given that \( k_1 \) is much smaller than \( k_2 \) (\( k_1 \ll k_2 \)), it indicates that the first step is much slower compared to the second step. This implies that the activation energy for the first step is relatively high, while the second step has a lower activation energy.
- Start with the energy level of the reactants \( A + B \).
- The first step has a high activation energy barrier, leading to the formation of the intermediate \( I_{AB} \). This will be represented by a peak in the energy diagram.
- After the intermediate, the second step has a lower activation energy barrier, leading to the product \( P \). This will be represented by a smaller peak or a downward slope from the intermediate to the product.
- The final energy level of the products \( P \) will be lower than that of the reactants, indicating an exothermic reaction.
The potential energy diagram will show:
- A high peak for the first step (due to the larger activation energy).
- A lower peak for the second step (due to the smaller activation energy).
- The overall trend will be a decrease in energy from reactants to products.
The final diagram will look like this:
Topper's Solved these Questions
- BOOK - CENGAGE CHEMISTRYCHAPTER - CHEMICAL KINETICSEXERCISE - Ex 4.3 (Objective)15videos
CHEMICAL KINETICS
- BOOK - CENGAGE CHEMISTRYCHAPTER - CHEMICAL KINETICSEXERCISE - Ex 4.3 More Than One Correct5videos
CHEMICAL KINETICS
- BOOK - CENGAGE CHEMISTRYCHAPTER - CHEMICAL KINETICSEXERCISE - Ex 4.1 (Objective)9videos
CHEMICAL KINETICS
- BOOK - CENGAGE CHEMISTRYCHAPTER - CARBOXYLIC ACIDS AND THEIR DERIVATIVESEXERCISE - Exercises Archives (Analytical And Descriptive)34videos
CARBOXYLIC ACIDS AND THEIR DERIVATIVES
- BOOK - CENGAGE CHEMISTRYCHAPTER - COORDINATION COMPOUNDSEXERCISE - Archives Subjective18videos
COORDINATION COMPOUNDS
Similar Questions
Knowledge Check
- Question 1 - Select One
A consecutive reaction, AK1−−→BK2−−→C is characterised by:
AMaximum in the concentration of ABMaximum in the concentration of BCMaximum in the concentration of CDHighly exothermicity - Question 2 - Select One
In the sequence of reaction,
Lk1−−→Mk2−−→Nk3−−→O
k3>k2>k1
The rate determining step of the reaction is :AL→MBM→NCN→ODL→O - Question 3 - Select One
The overall rate d[P]dt, for the reaction 2AK⇐⇒B,B+Ckf−−→P is given by
AKkf[A]2[C]BK[A][B]Ckf[B][C]DKkf[A]2[B][C]
Conisder the following reactions:
I. A+Bk1⇐⇒k−1C
II. C+Bk2−−→D
Then k1[A][B]−k−1[C]−k2[C][B] is equal toView SolutionIn the series reaction
AK2−−→BK2−−→CK2−−→D , if K1>K2>K3 then the rate determing step of the reaction isView SolutionFor the two step reaction in which both the steps are first order
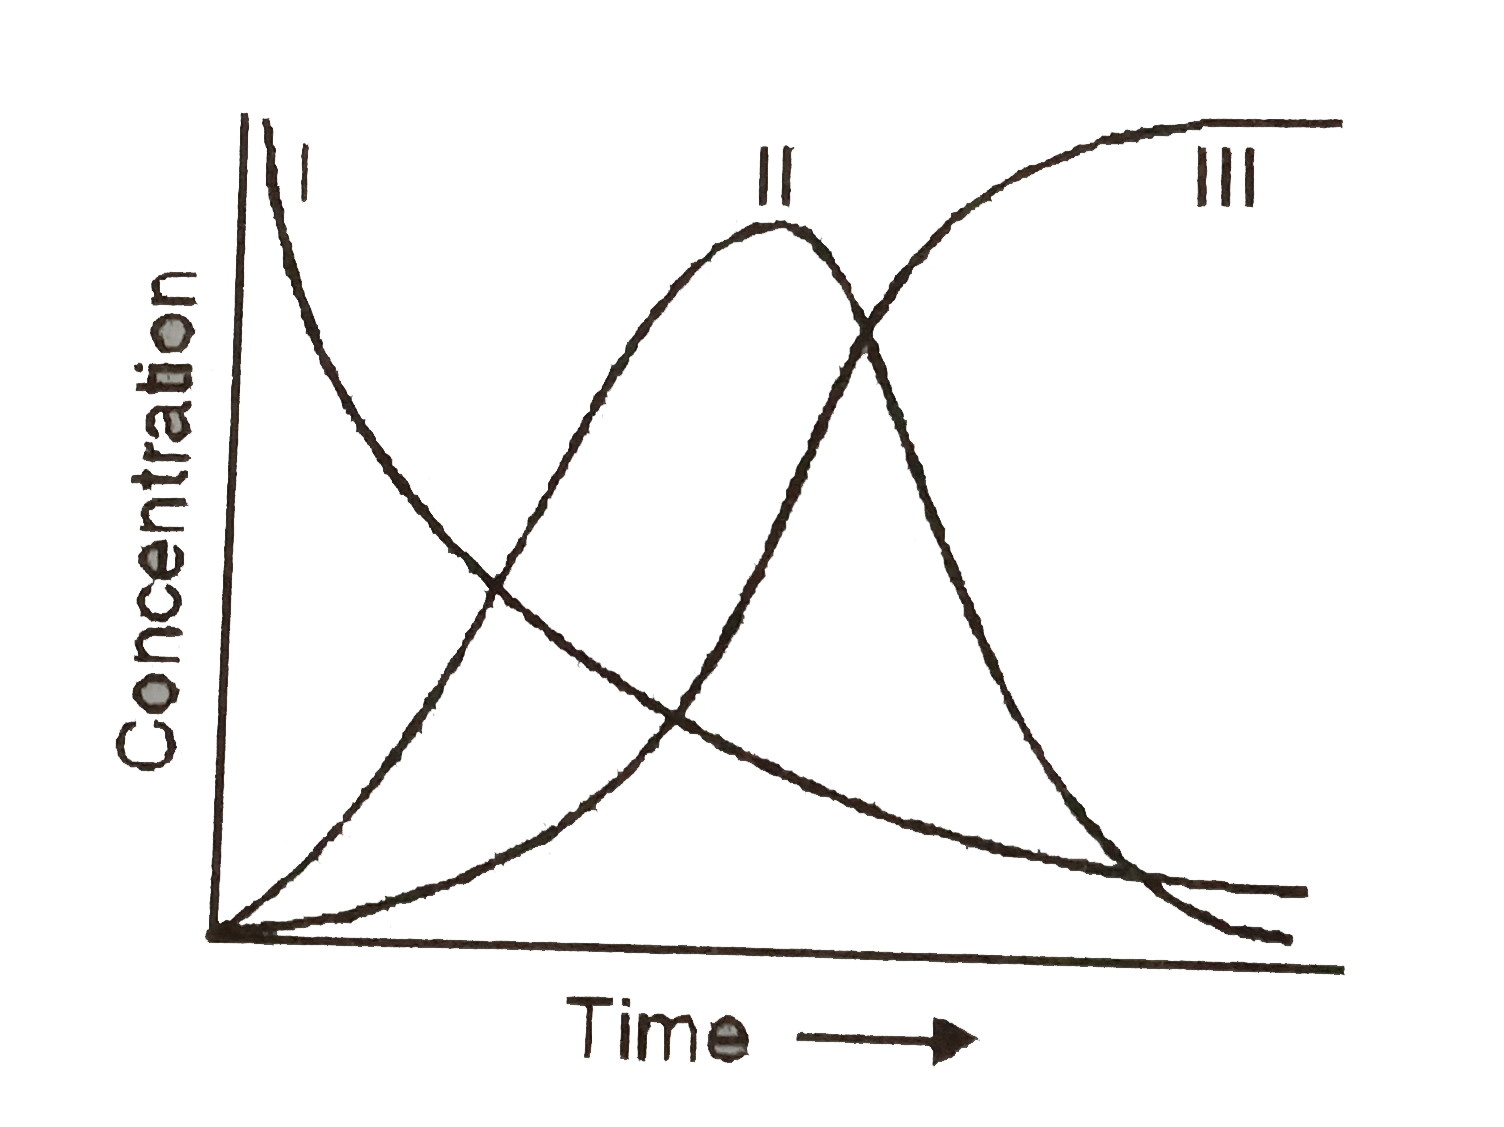
Rk1−−→I
Ik2−−→P
the rate of change of concentration of I is given by the plotView SolutionA reaction is represented by Ak1−−→B (slow ) and A+Bk2−−→C (fast) where k1 and k2 are the ratge constants of two steps. The rate of production of C will be given by
View SolutionA following mechanism has been proposed for a reaction
2A+B→D→E
A+B→C+D(slow)
A+C→E (fast)
The rate law expression for the reaction by RDS methd is:View Solution

