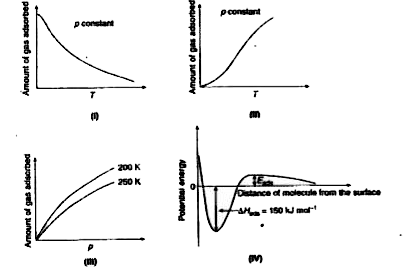
The given graphs/data I, II, III and IV represent general trends observed for different physisorption and chemisorption processes under mild conditions of temperature and pressure. Which of the following choice(s) about I, II, III and IV is (are) correct?
 Solution in Malayalam
I is physisorption and II is chemisorption
I is physisorption and III is chemisorption
IV is chemisorption and II is chemisorption
IV is chemisorption and III is chemisorption
The correct Answer is:A, C
In physisorption, with the increase of temperature and pressure, the rate of adsorption decreases because according to Le Chatelier.s principle, increase of temperature and pressure will shift the equilibrium to the left.
Adsorbate + Adsorbent ⇒ Adsorption + Heat
This is shown in Graphs I and III , whereas in case of chemisorption, there is a formation of strong bond between the adsorbate and the adsorbent and so the rate of adsorptoin increases with increase in temperature (Graphs II and IV).
Similar Questions
The given graph/data I, II, III and IV represent general trends for different physisorption and chemisorption processes under mild conditions of temperature and pressure. Which of the following choice (s) about I, II, III and IV is (are) correct
View SolutionWrite the differences between physisorption and chemisorption with respect to the following : (i) Specificity (ii) Temperature dependence (iii) Reversibility and (iv) Enthalpy change
View SolutionMatch the following (A) (i-P), (ii-S), (iii-R), (iv-Q) (B) (i-Q), (ii-S), (iii-P), (iv-R) (C) (i-Q), (ii-P), (iii-R), (iv-S) (D) (i-P), (ii-R), (iii-Q), (iv-S)
View SolutionWrite the differences between physisorption and chemisorption with respect to the following: (i) Specificity (ii) Temperature dependence (iii) Reversibility and (iv) Enthalpy change
View SolutionThe given graph/data I,II,III and IV represent general trends observed for different physisorption and chemisorption processes under mild conditions of temperature and pressure . Which of the following choice(s) about I,II,III, and IV is/are correct ?
View Solution(b)write the difference between physisorption and chemisorption with respect to the following : (i) Specificity (ii) Temperature dependence (iii) Reversibility and (iv) Enthalpy change
View SolutionThe given graph/data I, II, III and IV represent general trends observed for different physisorption and chemisorption processes under mild conditions of temperature and pressure. Which of the following choice(s) about I, II, III and IV is (are) correct? The correct choice is :
View SolutionMatch the following a. (i)- (r), (ii)- (p), (iii)- (s), (iv)- (q) b. (i)- (s), (ii)- (p), (iii)- (q), (iv)- (r ) c. (i)- (r), (ii)- (q), (iii)- (p), (iv)- (s) d. (i)- (r), (ii)- (p), (iii)- (q), (iv)- (s)
View Solution
