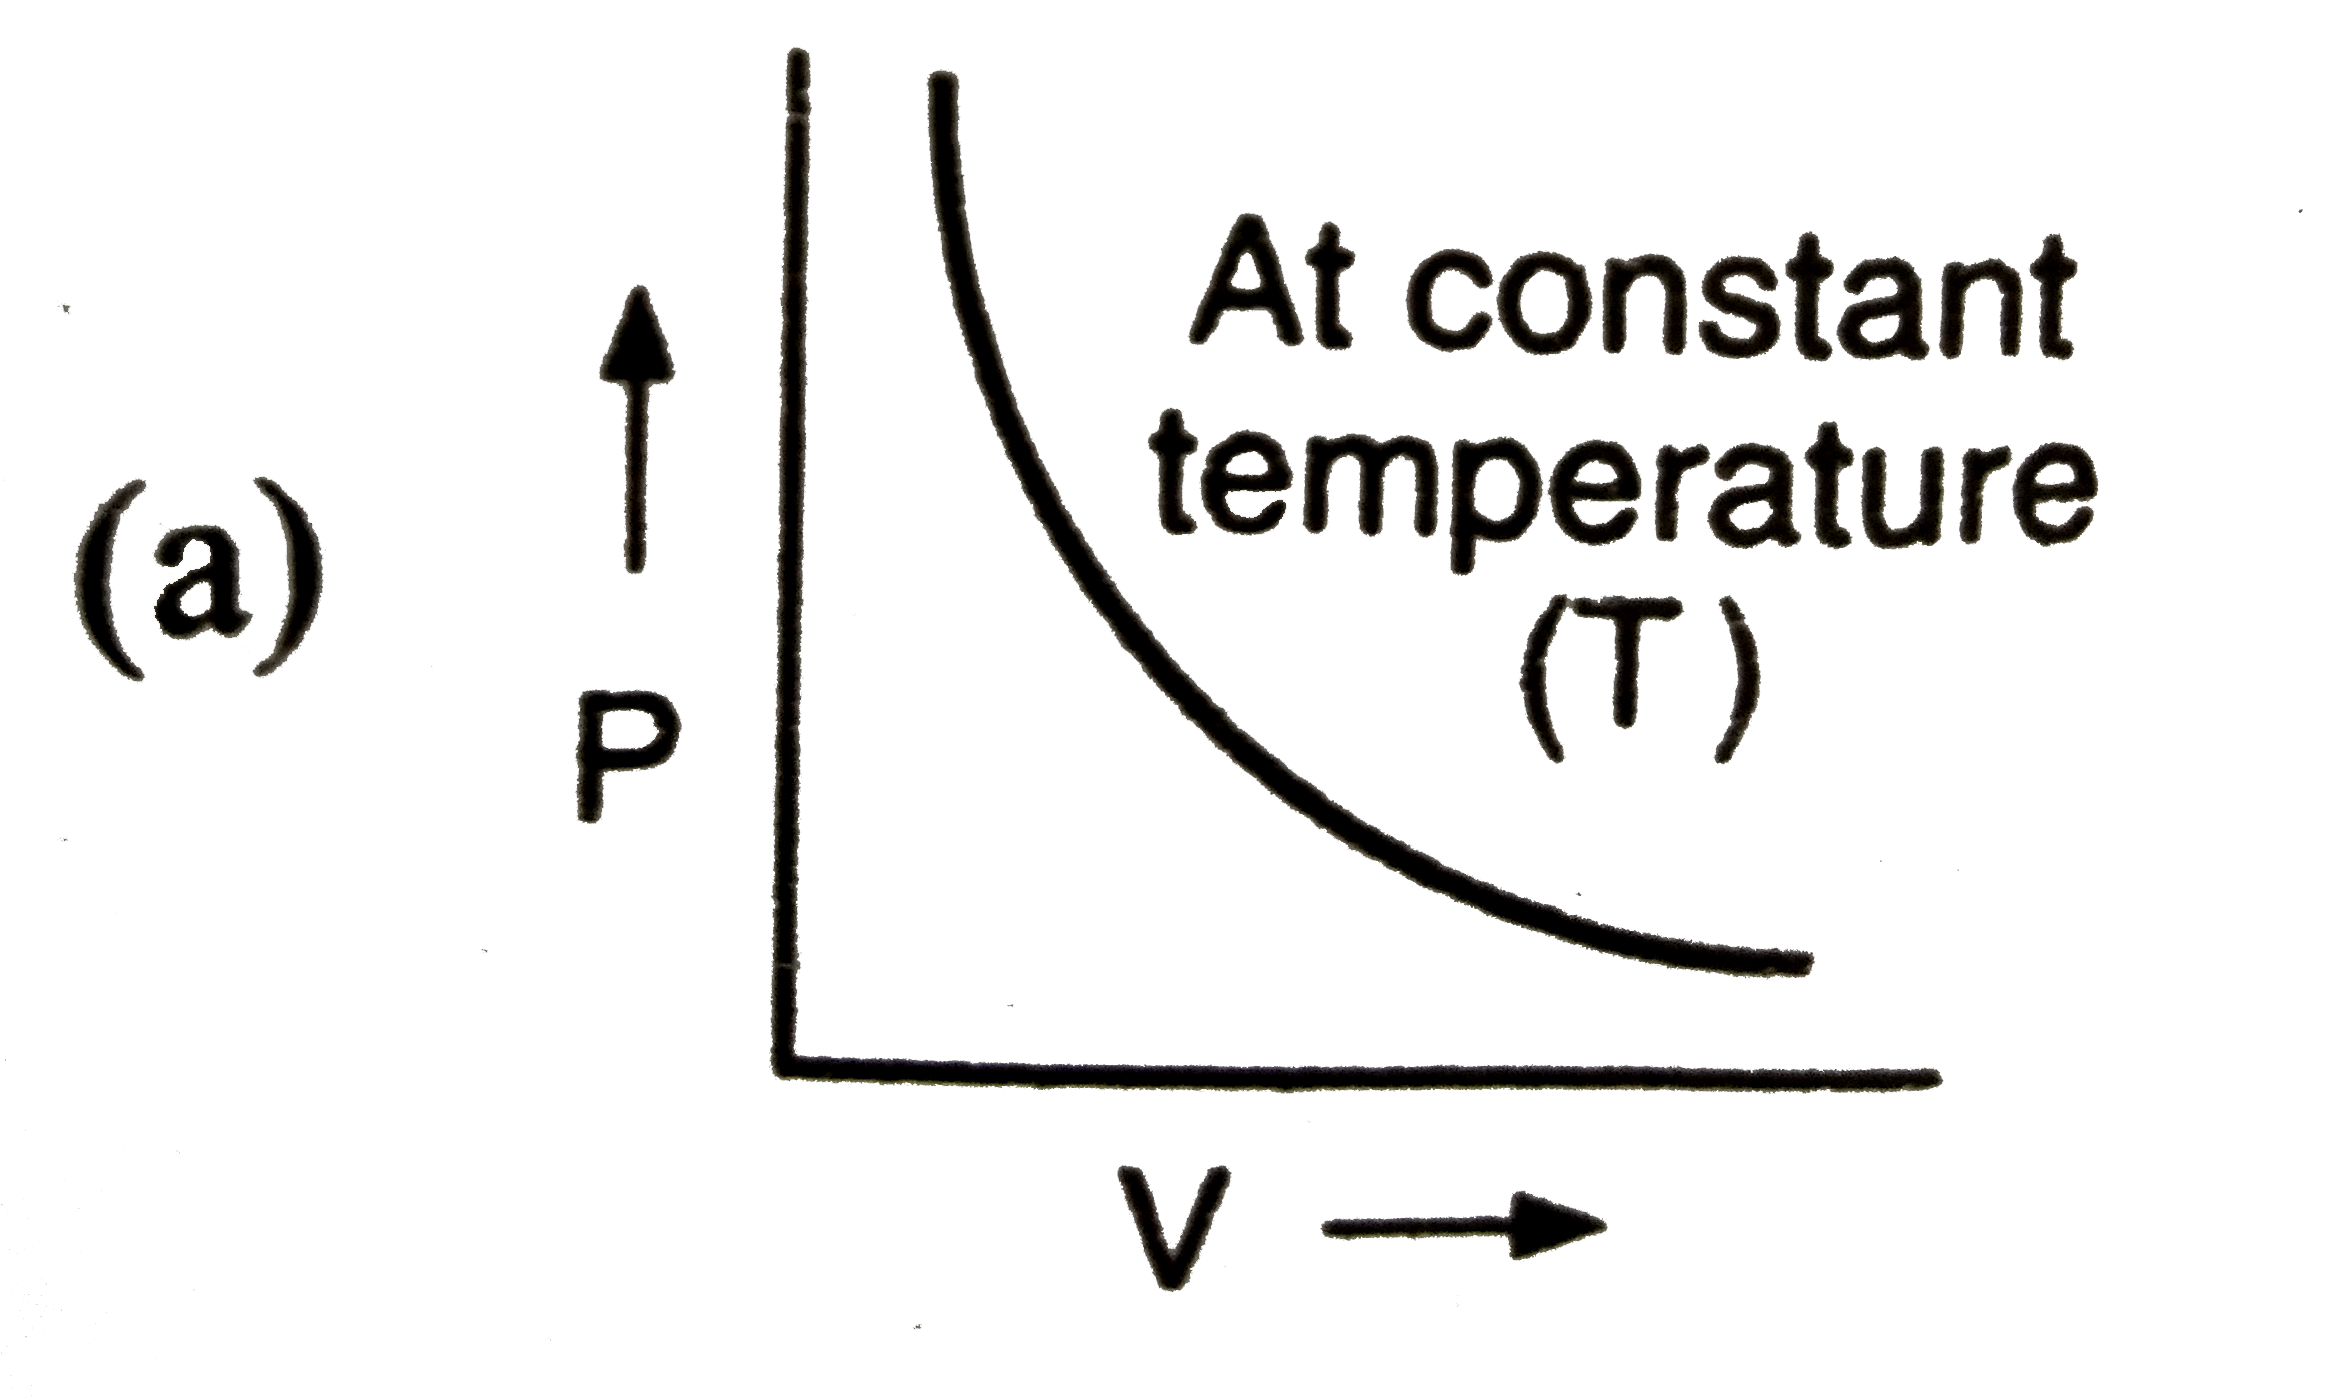
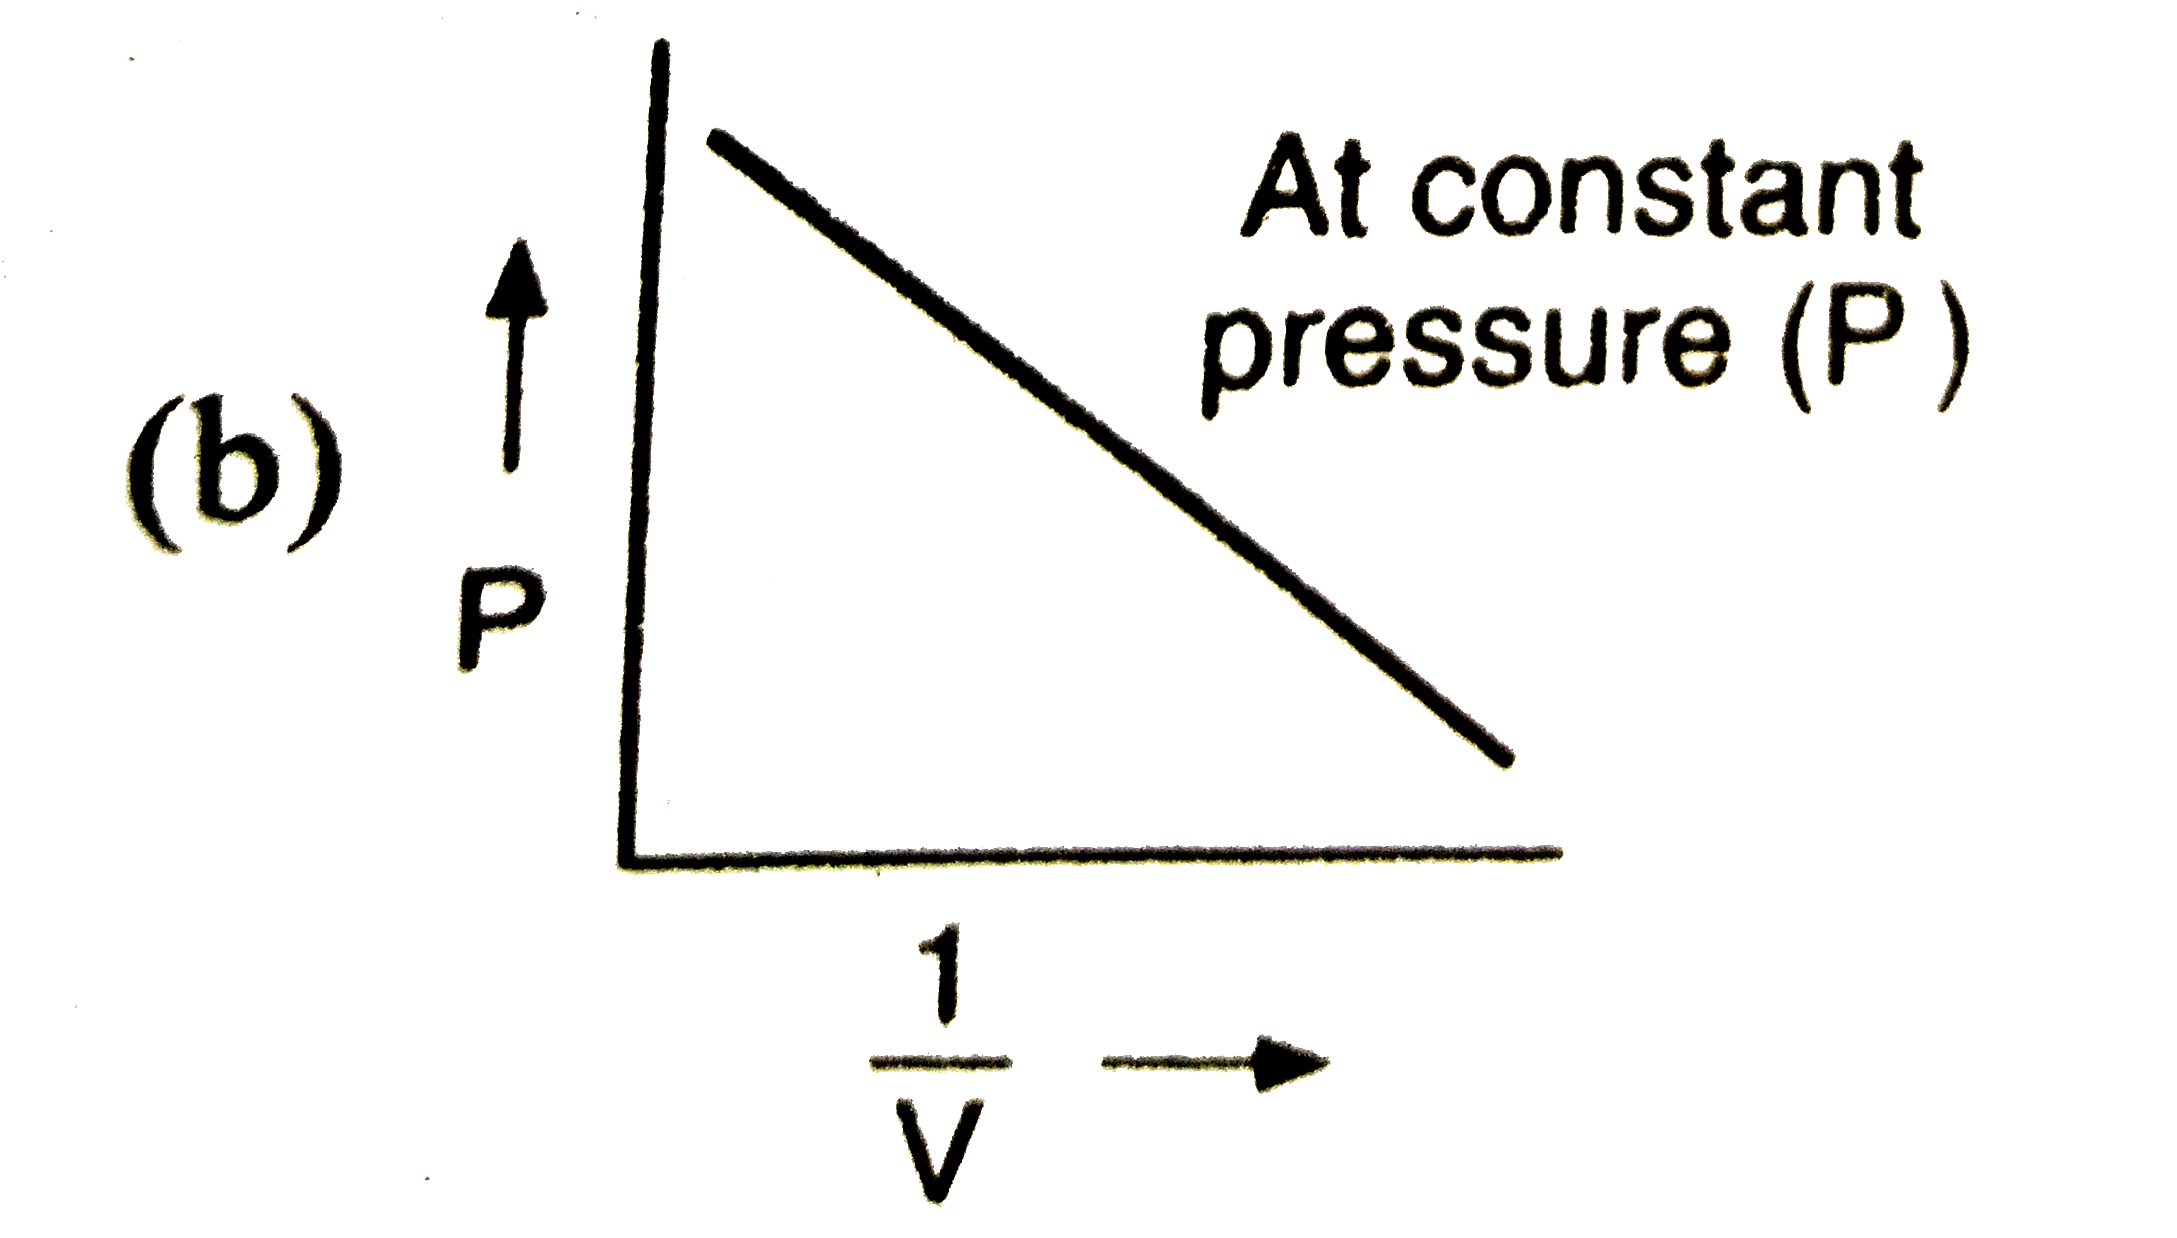
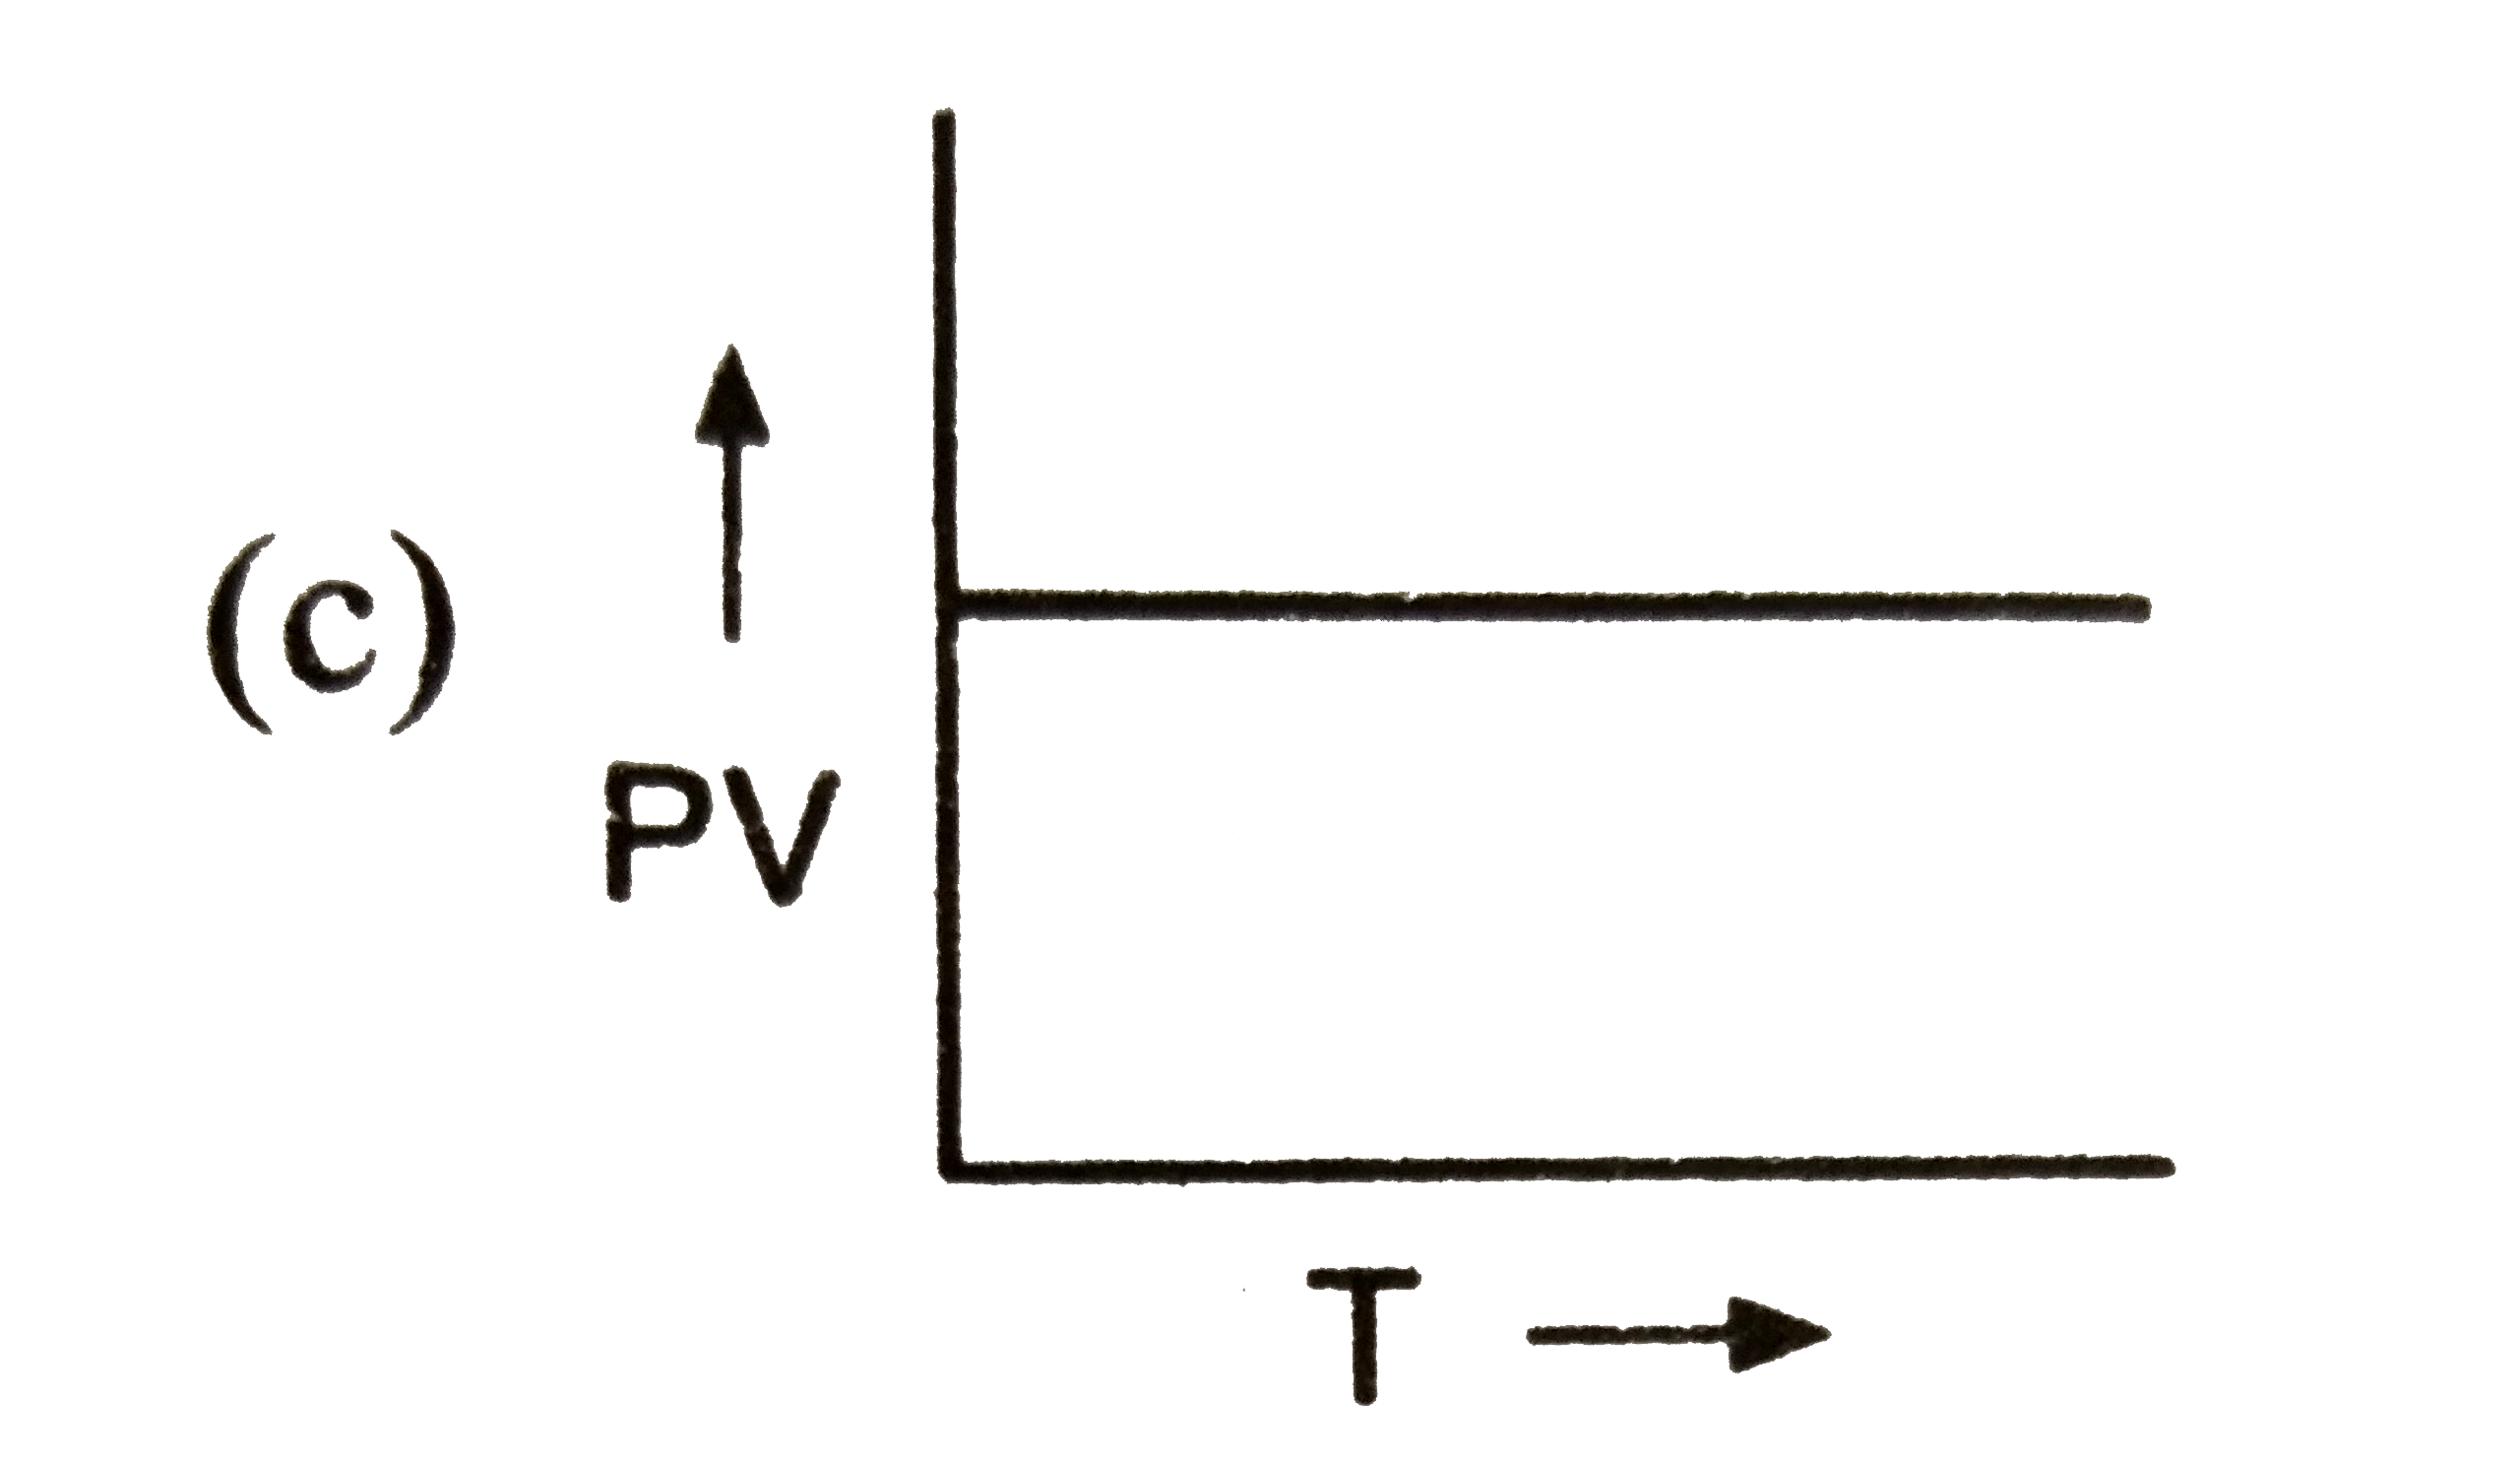
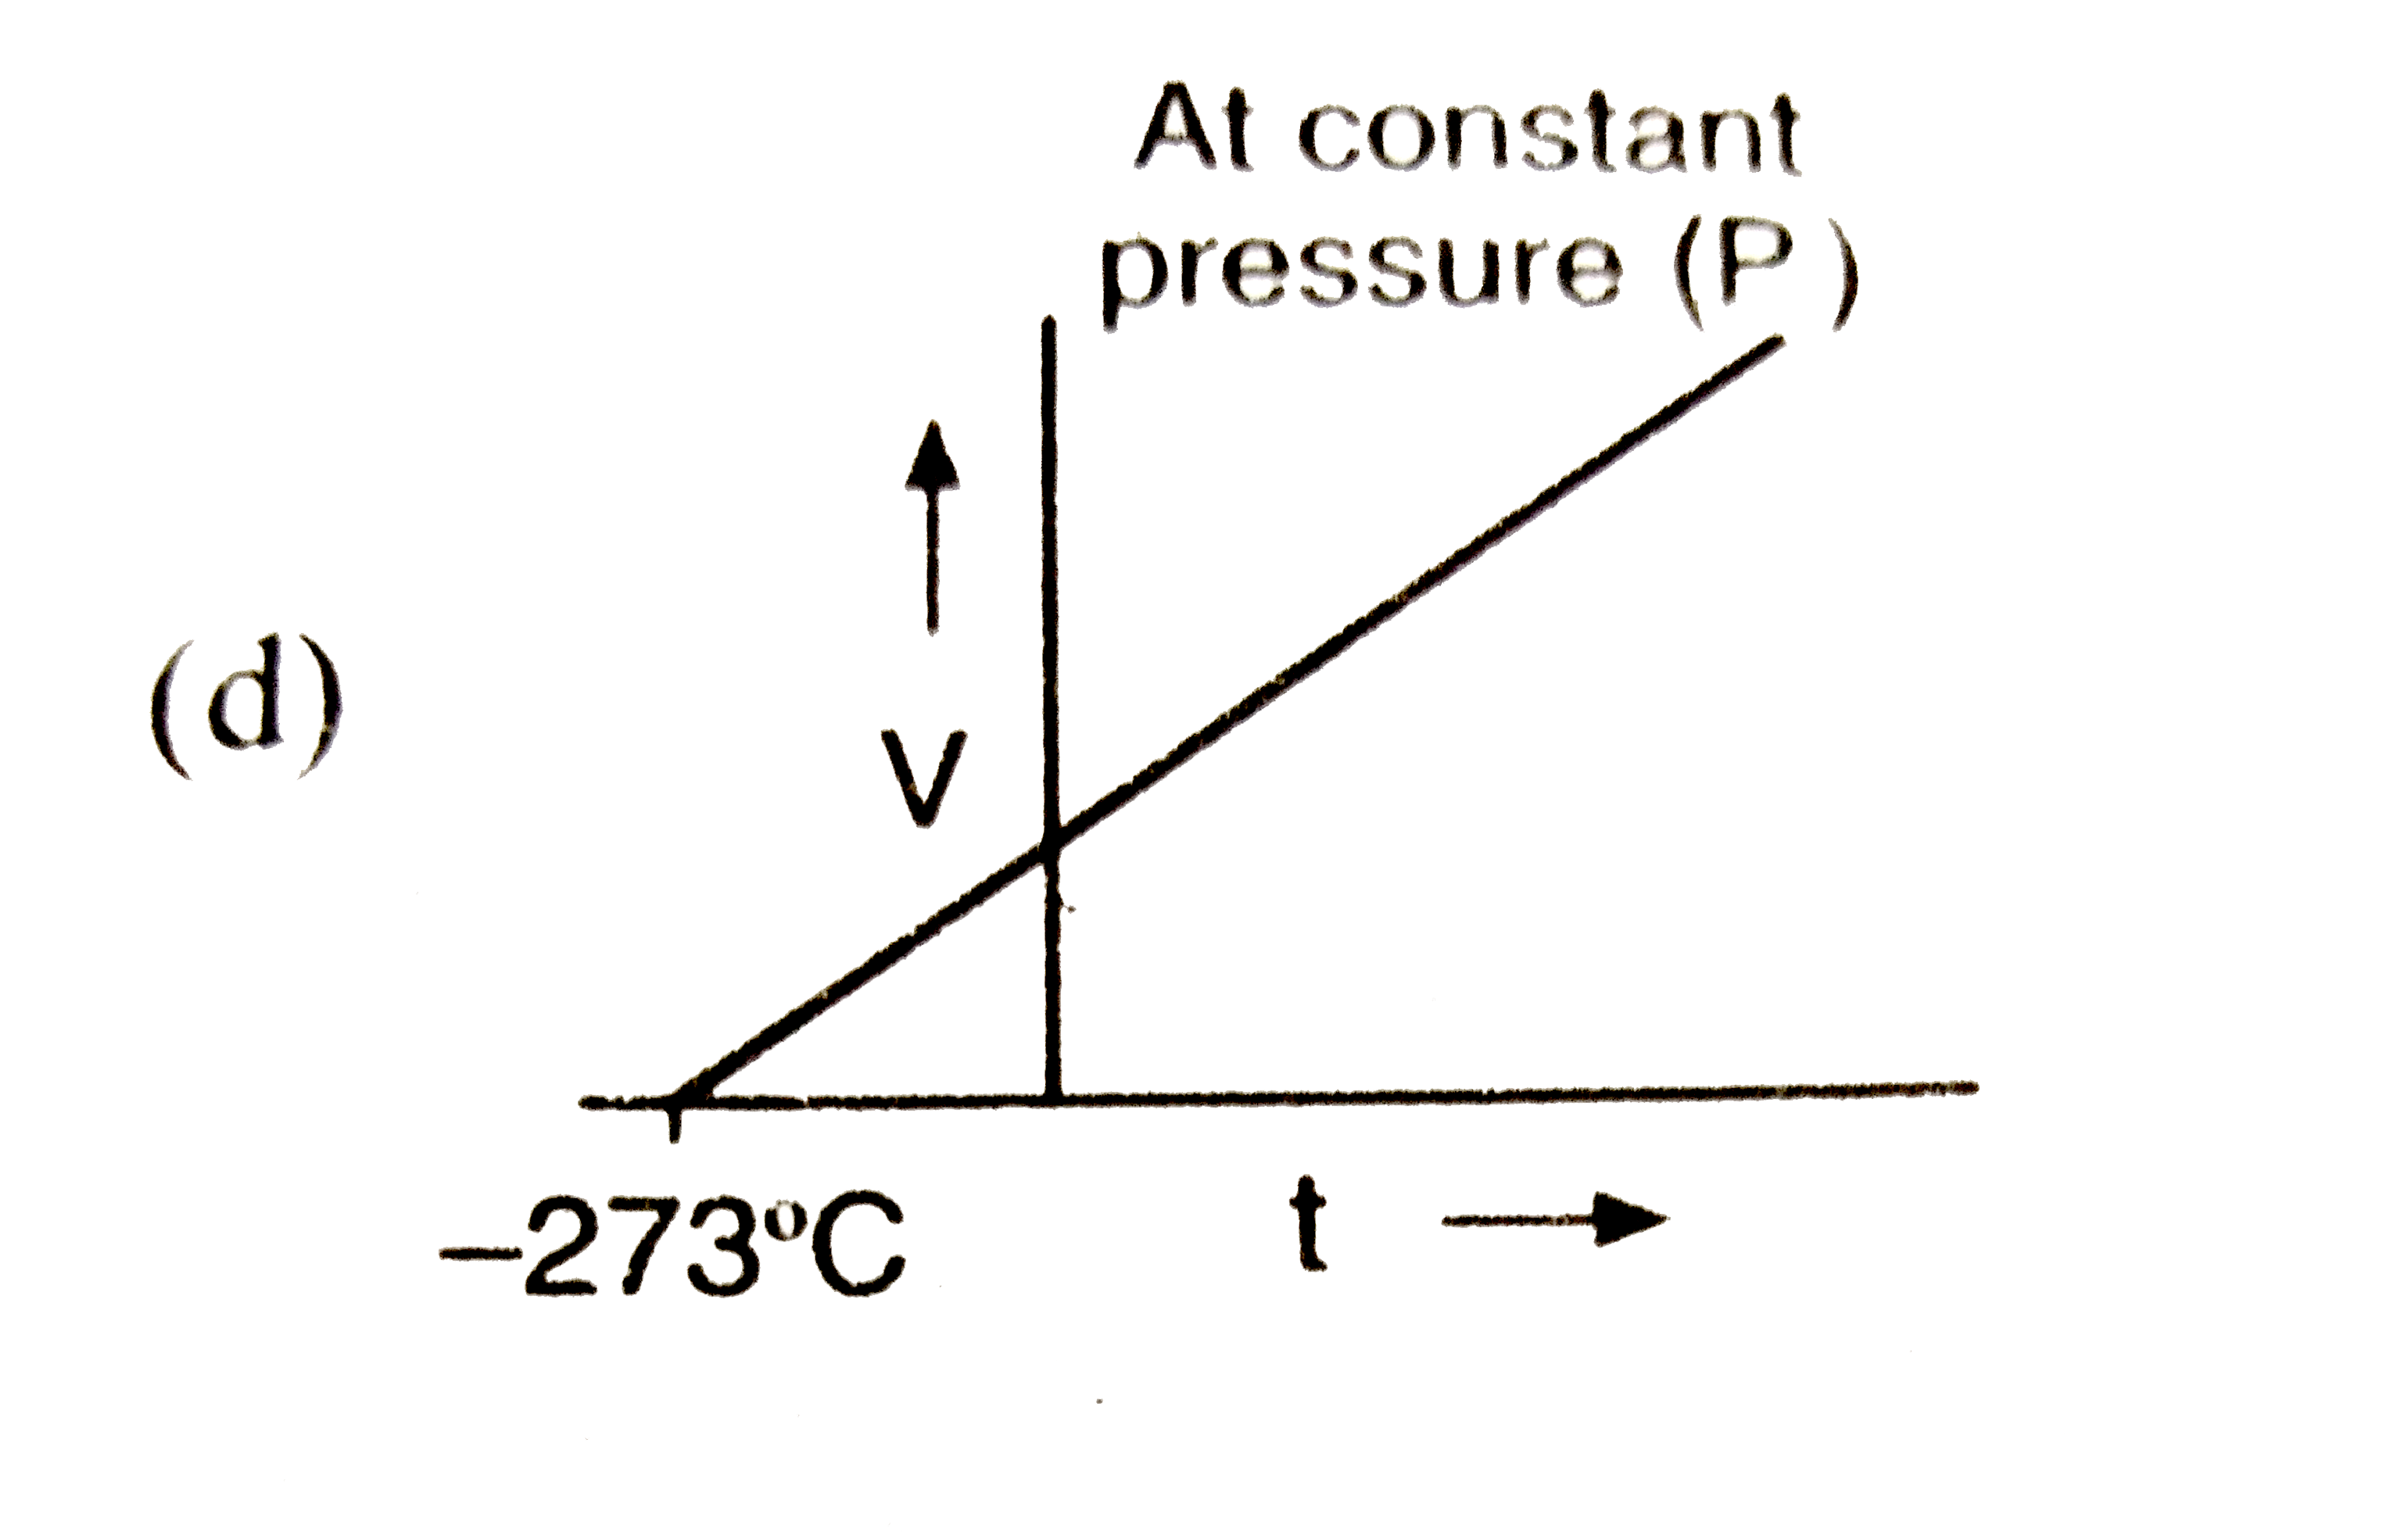
The graph that does represent the behaviour of an ideal gas is :
A
B
C
D
Text Solution
The correct Answer is:B, C
|
Topper's Solved these Questions
- STATES OF MATTER (GASES AND LIQUIDS)BOOK - OP TANDONCHAPTER - STATES OF MATTER (GASES AND LIQUIDS)EXERCISE - Objective questions Level B
34 Videos
- STATES OF MATTER (GASES AND LIQUIDS)BOOK - OP TANDONCHAPTER - STATES OF MATTER (GASES AND LIQUIDS)EXERCISE - Assertion-Reason
10 Videos
- STATES OF MATTER (GASES AND LIQUIDS)BOOK - OP TANDONCHAPTER - STATES OF MATTER (GASES AND LIQUIDS)EXERCISE - Objective questions
105 Videos
- SOLUTIONS (GENERAL AND COLLIGATIVE PROPERTIES)BOOK - OP TANDONCHAPTER - SOLUTIONS (GENERAL AND COLLIGATIVE PROPERTIES)EXERCISE - Self Assessment
31 Videos
- STATES OF MATTER (SOLID STATE)BOOK - OP TANDONCHAPTER - STATES OF MATTER (SOLID STATE)EXERCISE - SELF ASSESSMENT Section VI
3 Videos
Similar Questions
Knowledge Check
The graph that does not repersent the behaviour of an ideal gas is-
A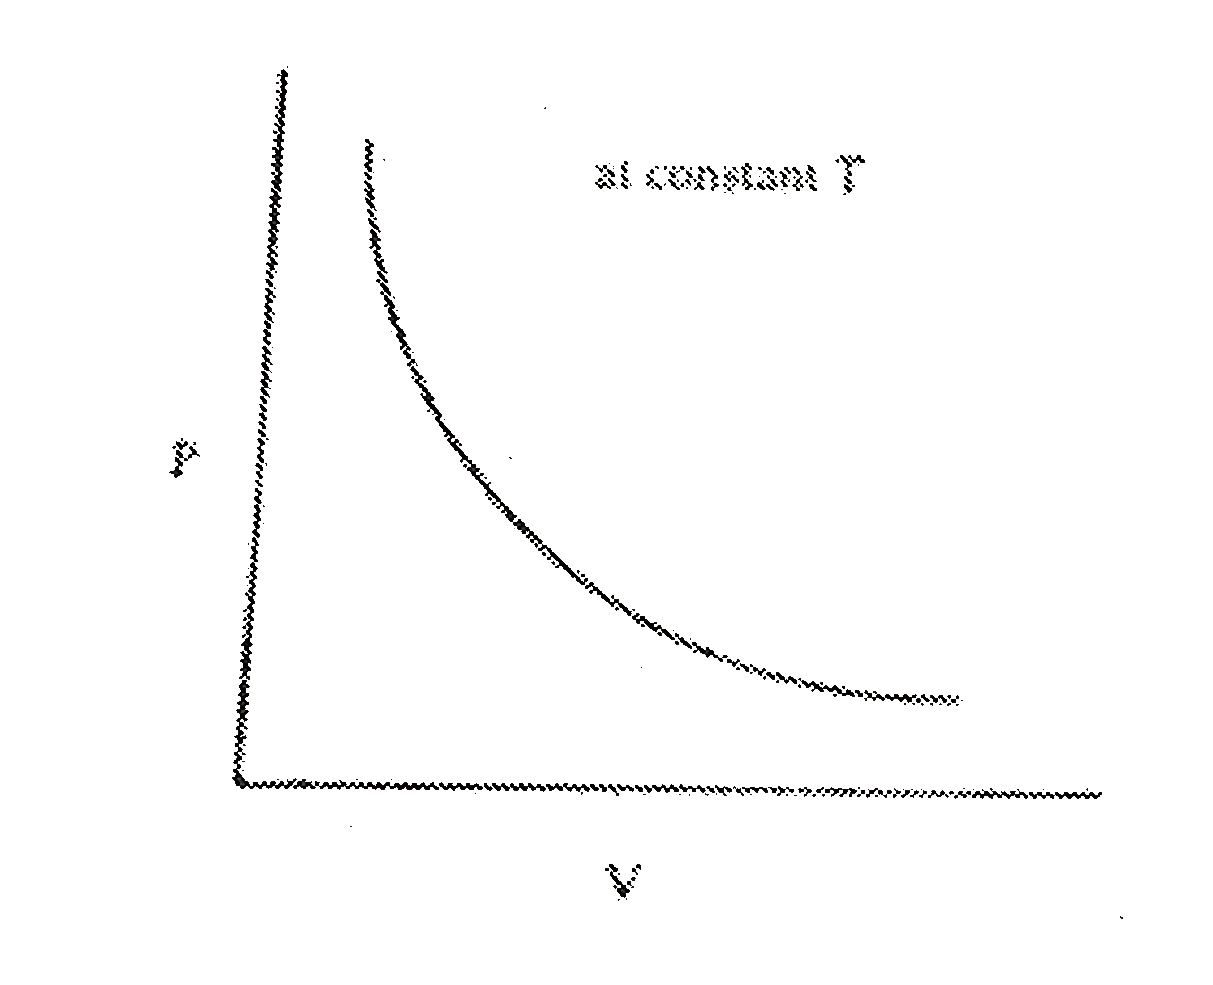 B
B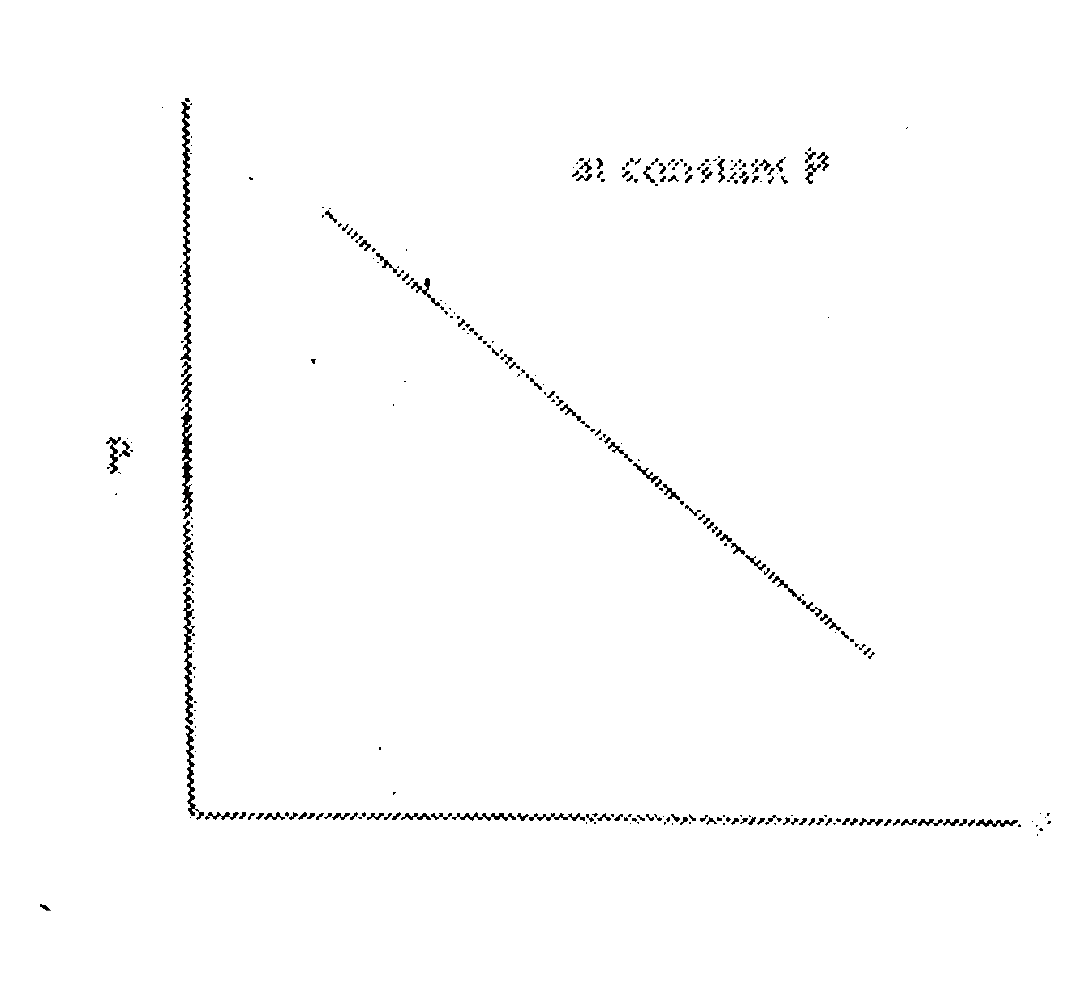 C
C D
D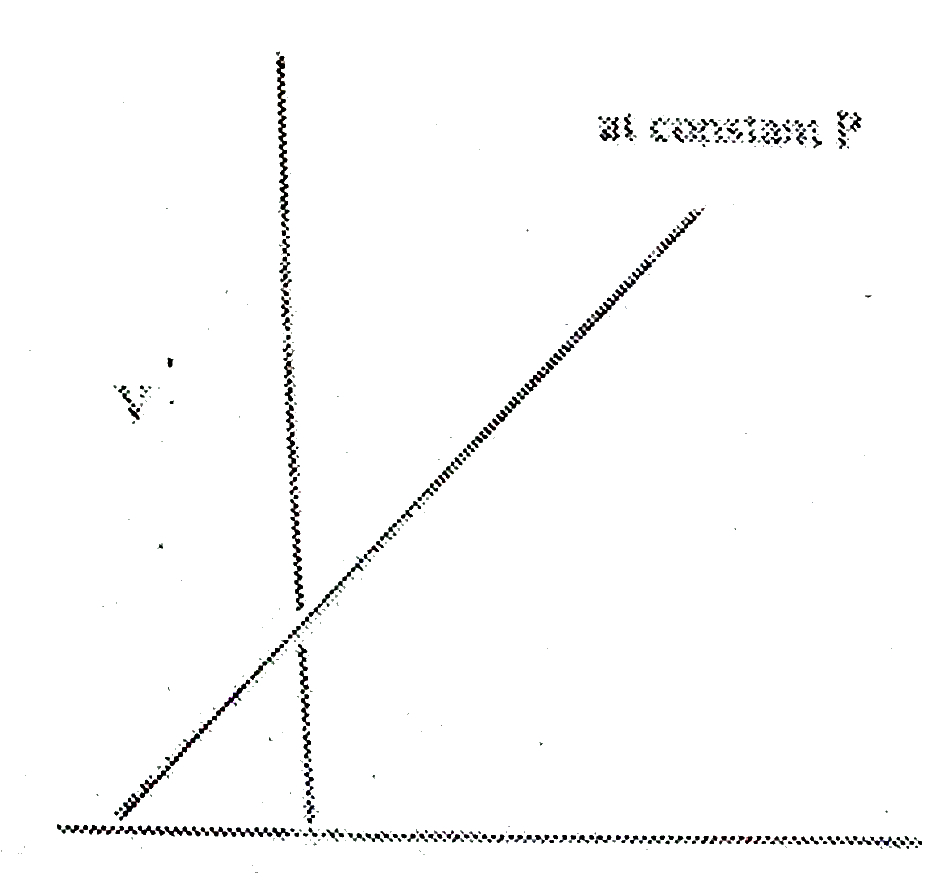
Which of the following graphs represent the behaviour of an ideal gas ?
A1.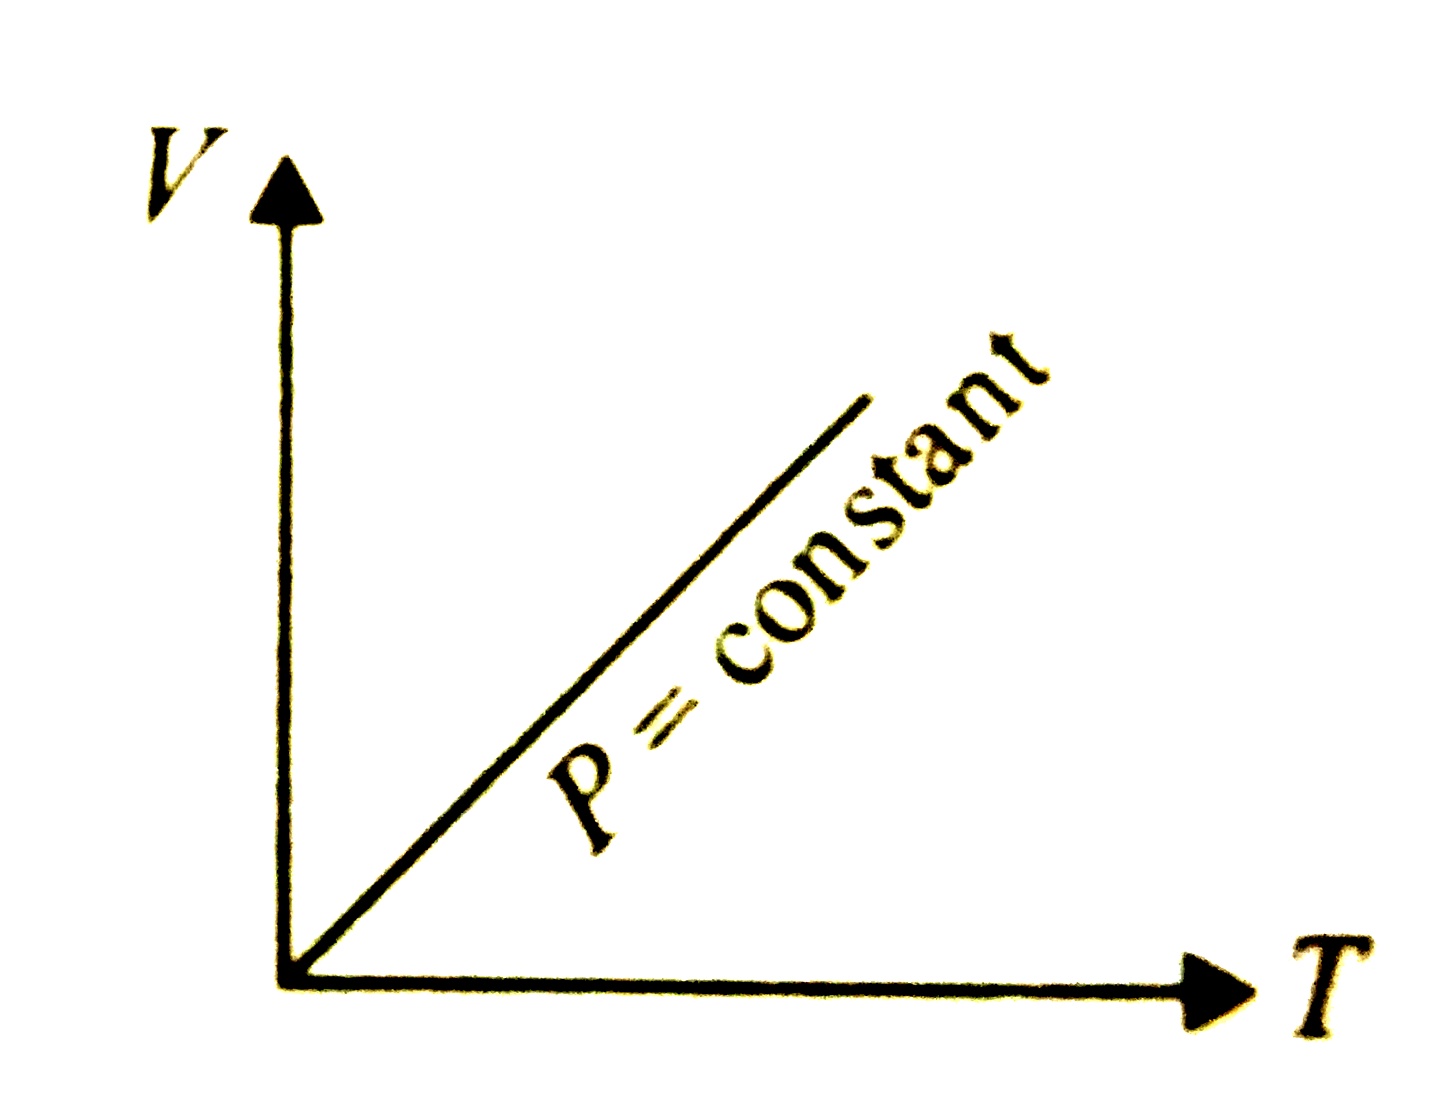 B2.
B2.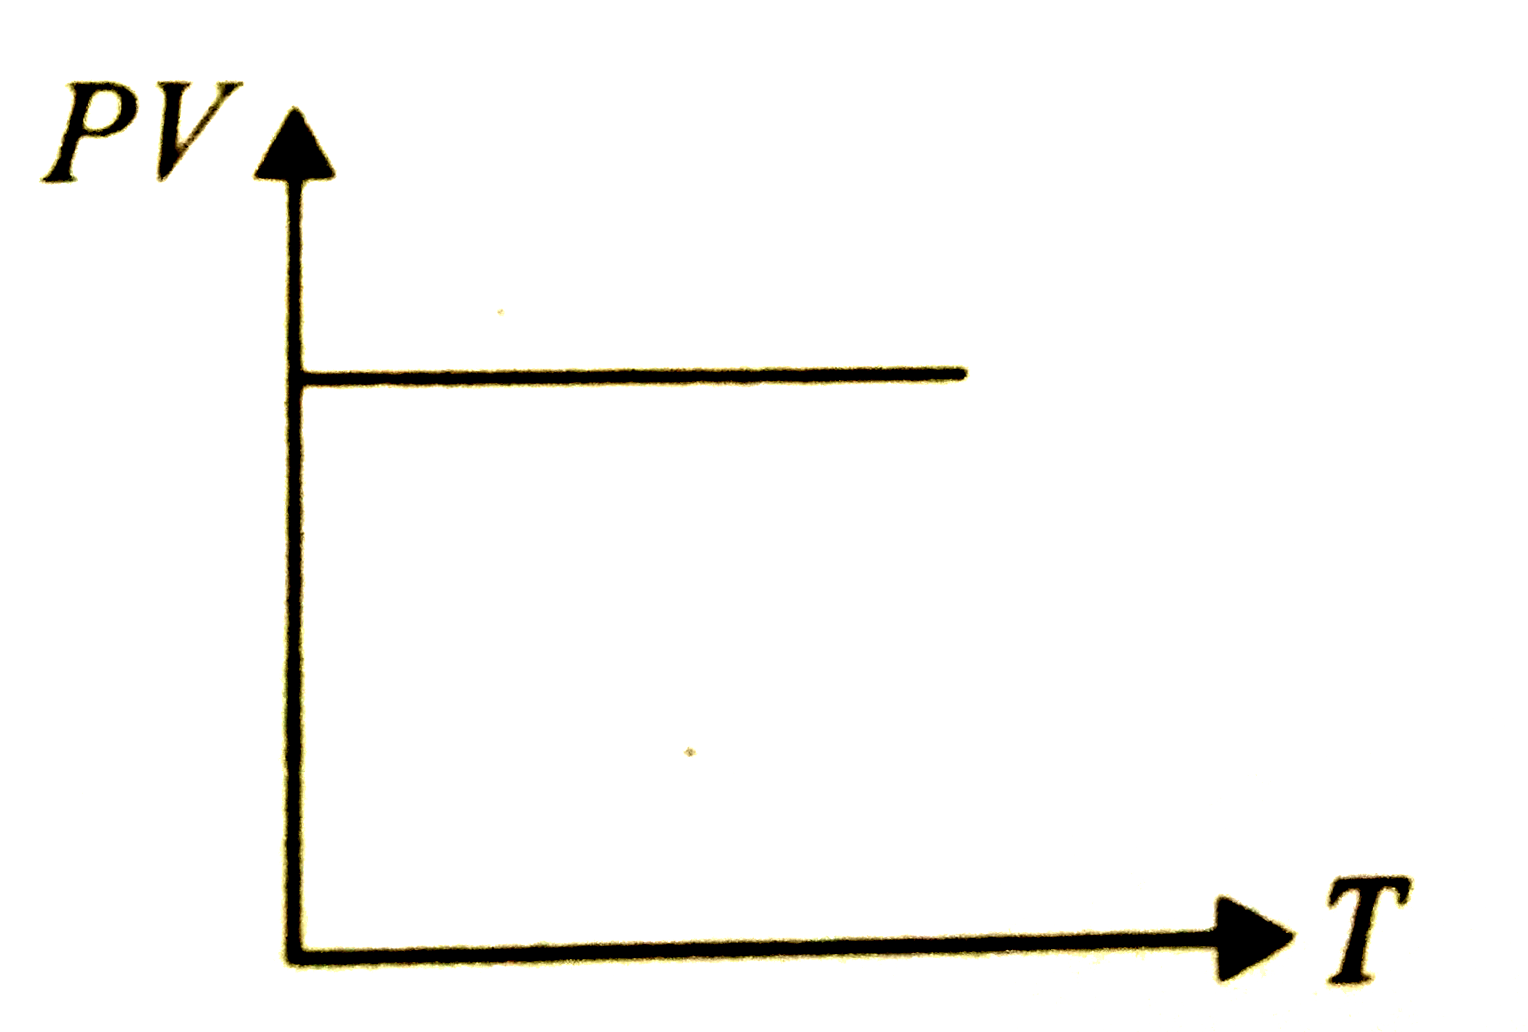 C3.
C3.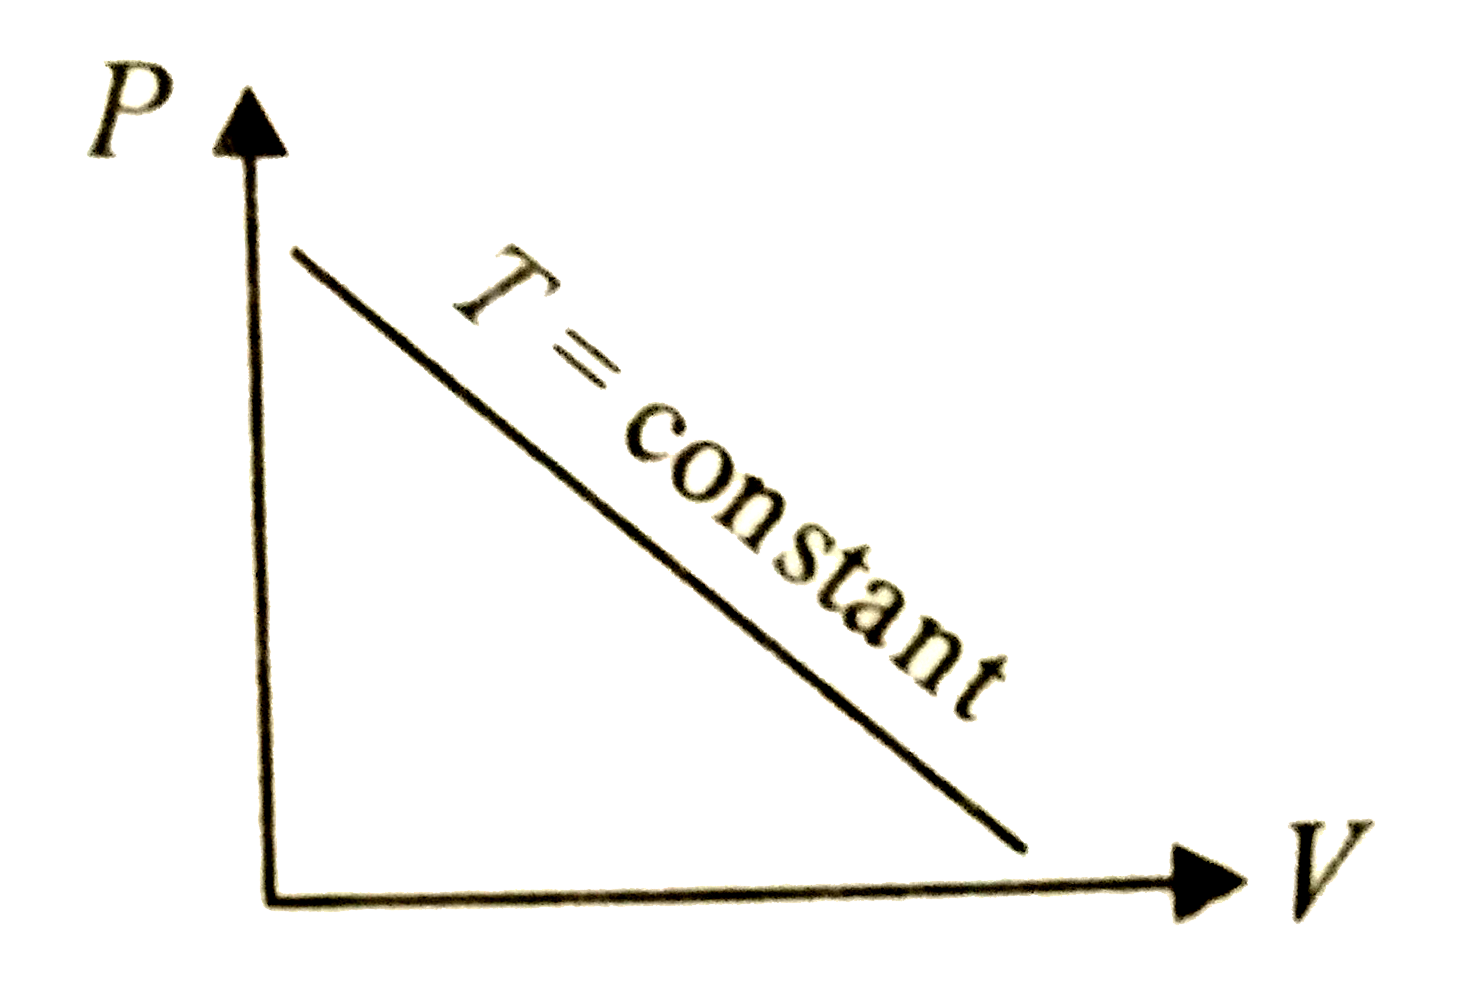 D4.
D4.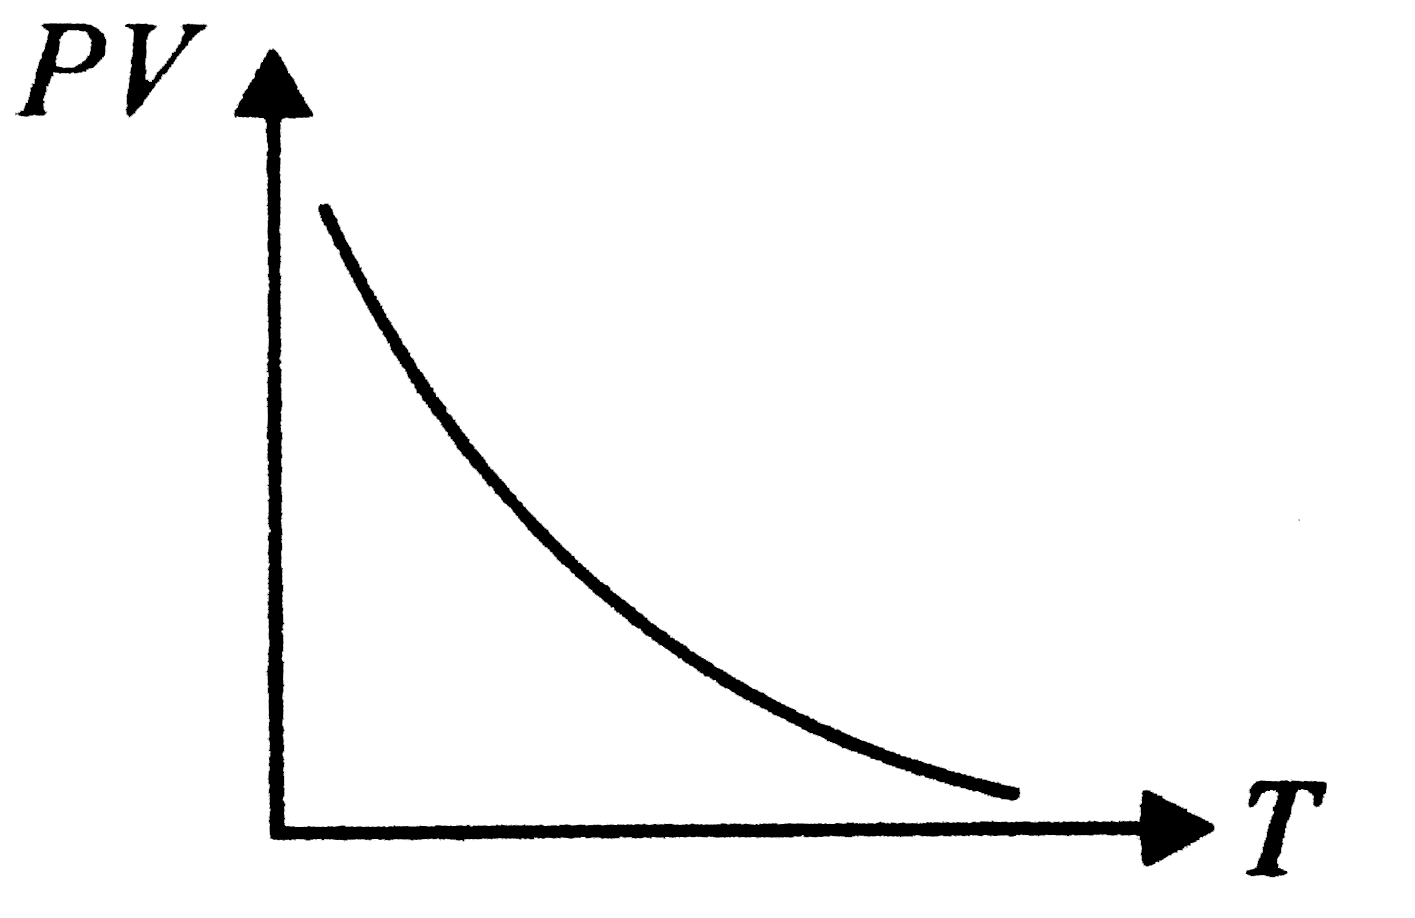
Which of the following graphs represent the behaviour of an ideal gas ?
A B
B C
C D
D
Which of the following plots does not represent the behaviour of an ideal binary liquid solution?
View SolutionWhich of the following plots does not represent the behaviour of an ideal binary liquid solution of A and B?
View SolutionThe combination of plots which does not represent isothermal expansion of an ideal gas is :
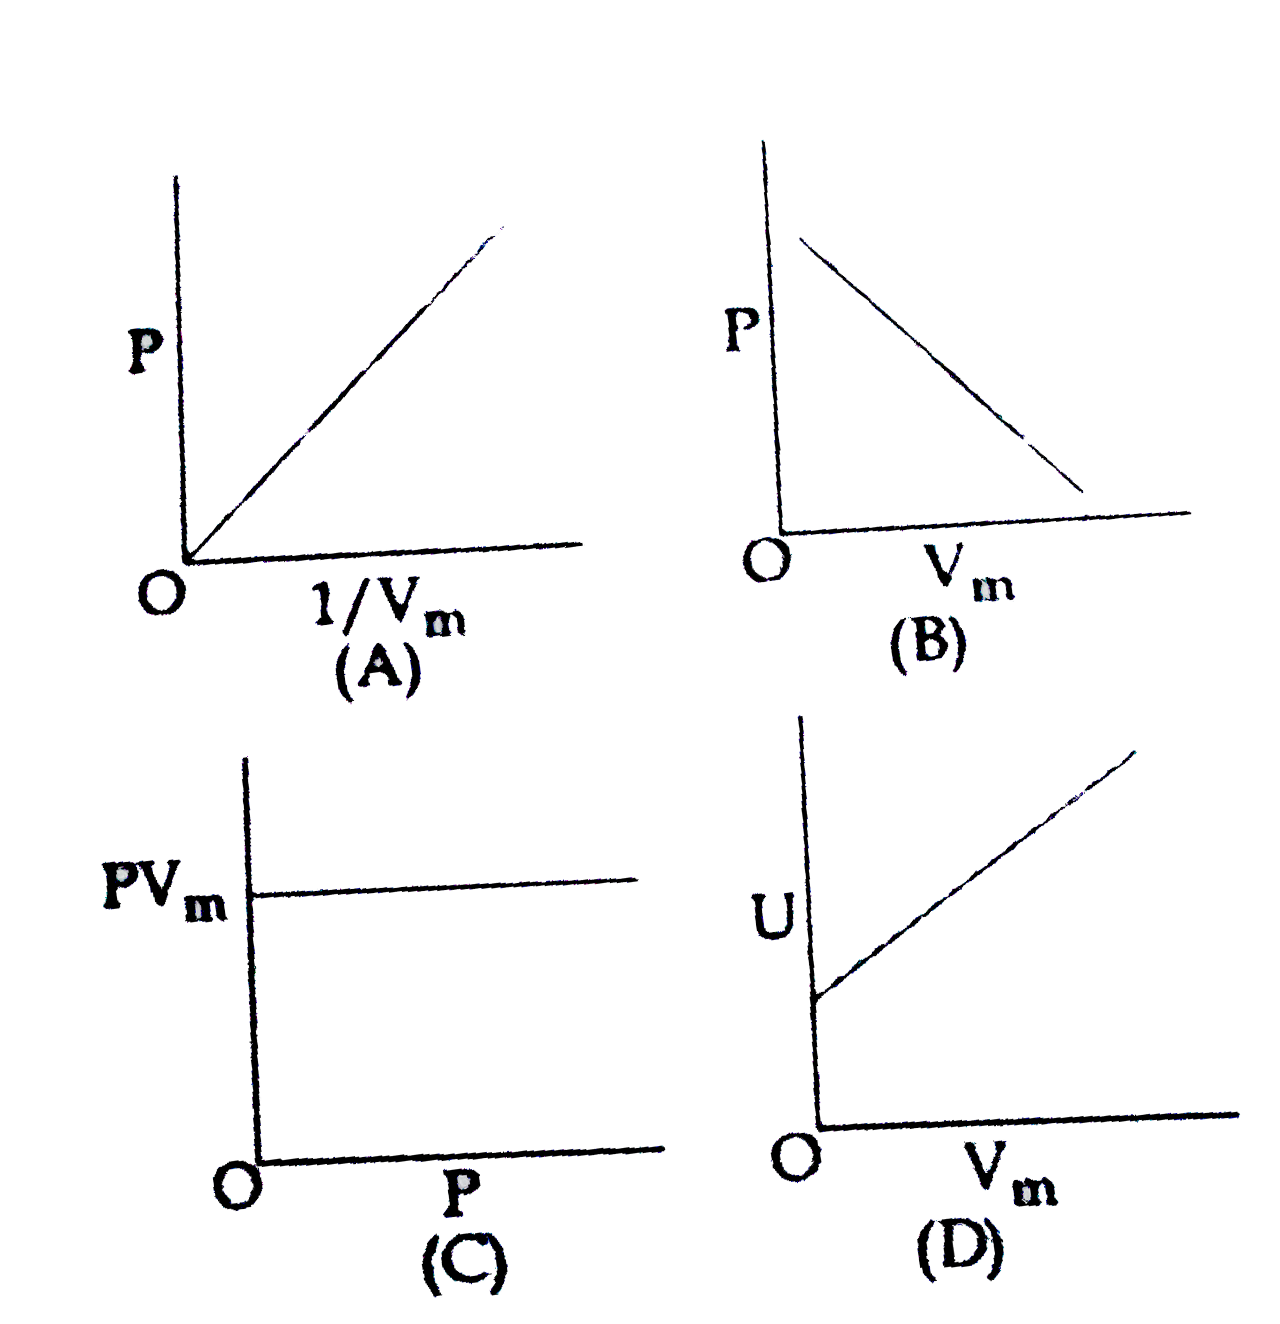
View SolutionThe combination of plots which does not represent isothermal expansion of an ideal gas is :
View SolutionWhich one of the following volume (V)- temperature (T) plots represents the behaviour of one mole of an ideal gas at one atmosphere?
View Solution
