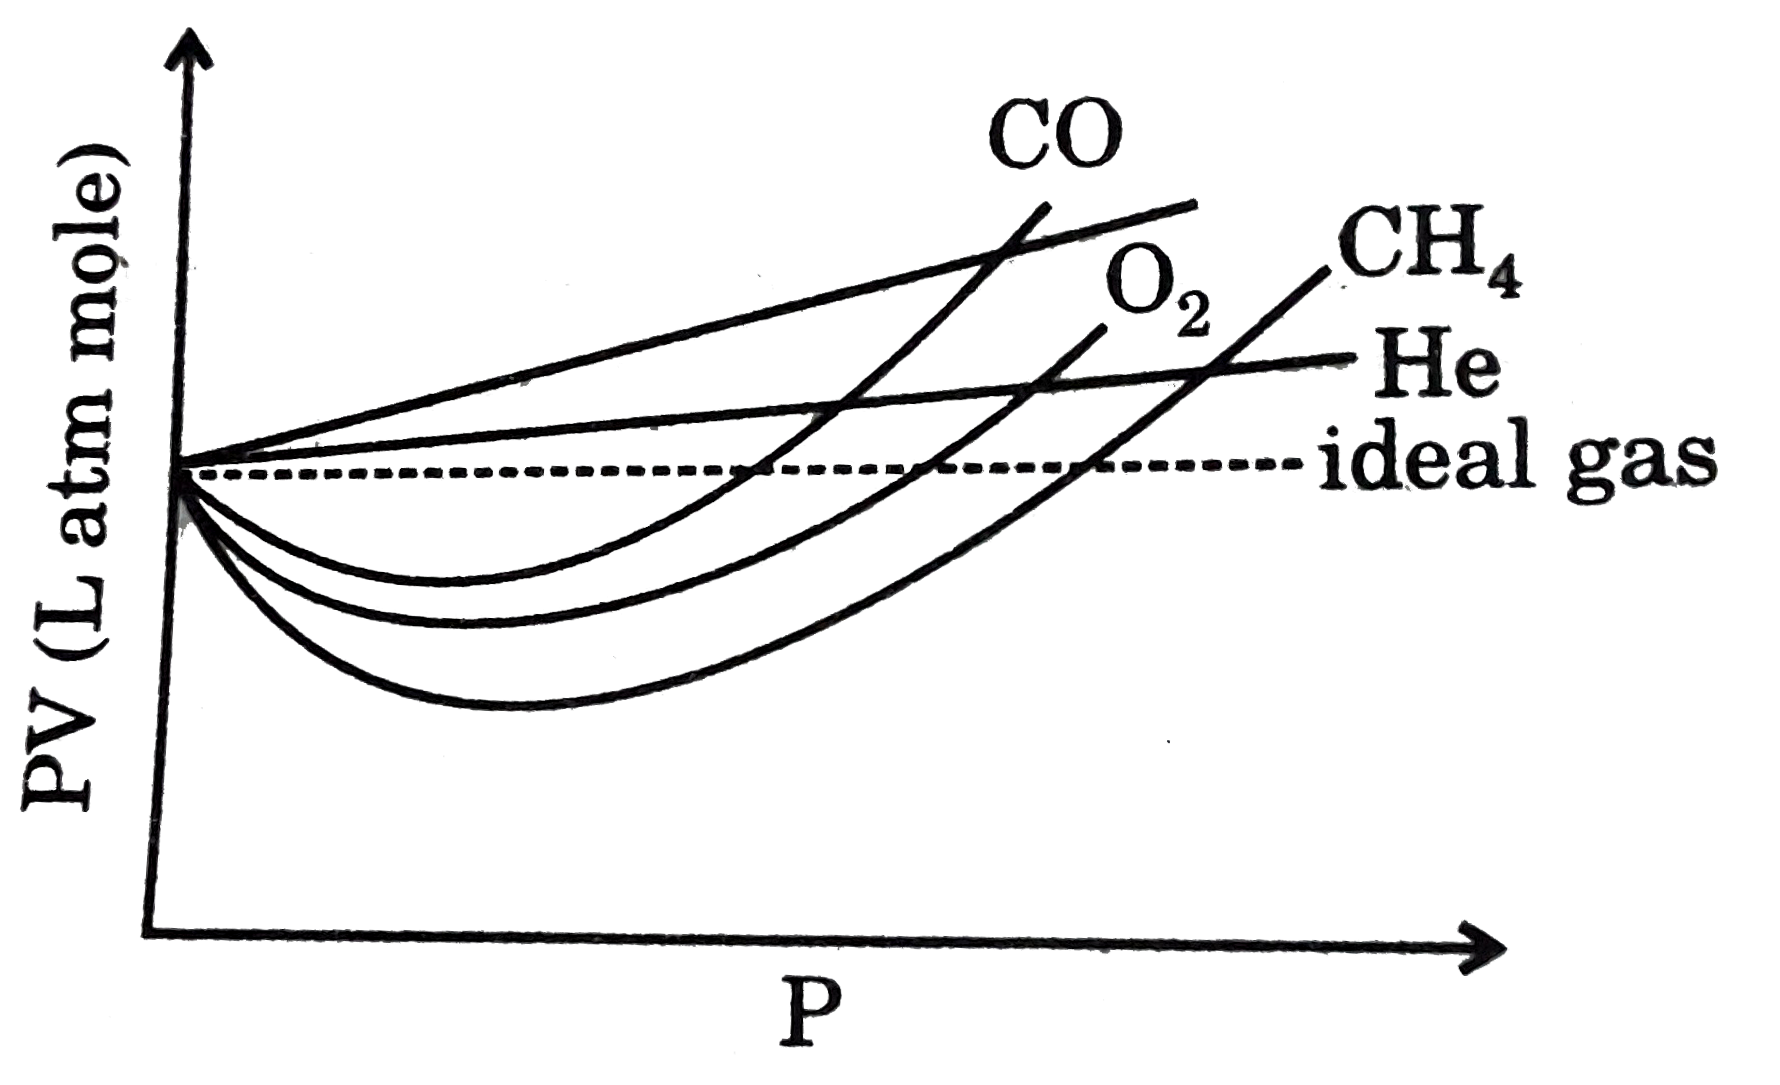
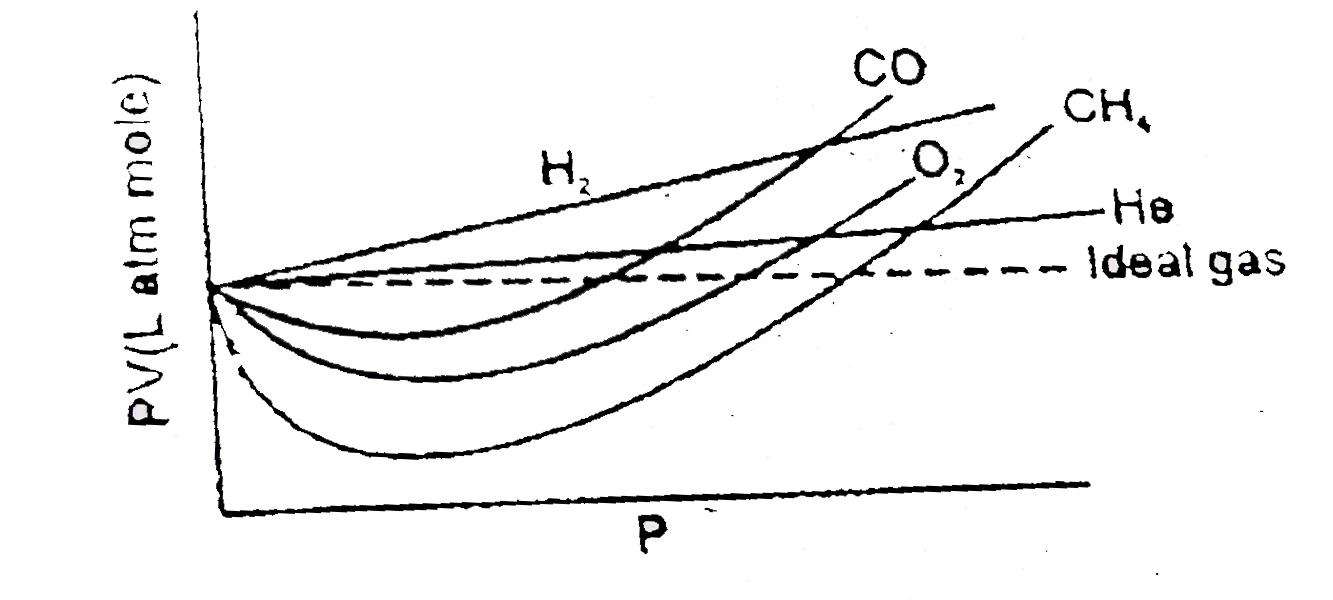
The plot of PV vs P at particular temperature is called isovbar.
Video Solution
Text Solution
1
|
Topper's Solved these Questions
- STATES OF MATTERBOOK - CENGAGE CHEMISTRYCHAPTER - STATES OF MATTEREXERCISE - Exercises (Fill In The Blanks)
25 Videos
- SOME BASIC CONCEPTS AND MOLE CONCEPTBOOK - CENGAGE CHEMISTRYCHAPTER - SOME BASIC CONCEPTS AND MOLE CONCEPTEXERCISE - Archives Subjective
11 Videos
- STOICHIOMETRYBOOK - CENGAGE CHEMISTRYCHAPTER - STOICHIOMETRYEXERCISE - Archives Subjective
33 Videos
Similar Questions
Knowledge Check
The curve of pressure volume (PV) against pressure (P) of the gas at a particular temperature is as shown, according to the graph. Which of the following is incorrect (in the low pressure region)?
 AH2 and He shows +ve deviation from ideal gas equationBCO,CH4 and O2 show negative deviation from ideal gas equation.CH2 and He show negative deviation while CO2,CH4 and O2 show positive deviationDH2 and He are less compressible than that of an ideal gas while CO2,CH4 and O2 more compressible than that of ideal gas.
The curve of pressure volume (PV) against pressure (P) of the gas at a particular temperature is as shown, according to the graph which of the following is incorrect (in the low pressure region):
 AH2 and He shows +ve deviation from ideal gas equation.BCO,CH4 and O2 show negative deviation from ideal gas equation.CH2 and He show negative deviation while CO,CH4 and O2 show positive deviation.DH2 and He are less compressible than that of an ideal gas while CO,CH4 and O2 more compressible than that of ideal gas.
The curve of pressure volume (PV) against pressure (P) of the gas at a particular temperature is as shown, according to the graph which of the following is/are incorrect (in low pressure region):
 AH2 and He show positive deviation from ideal gas equationBCO, CH4 and O2 show negative deviation from ideal gas equationCH2 and He show negative deviation while CO2,CH4 and O2 show positive deviationDH2 and He are less compressible than that of an ideal gas while CO2,CH4 and O2 more compressible than that of ideal gas.
A solution in which more solute can be dissolved at a particular temperature is called
View SolutionMicelles are formed above a particular temperature called
View Solution
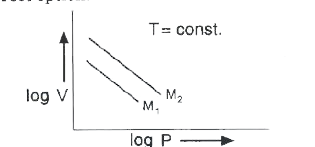
For same mass of two different ideal gases of molecular weights M1 and M2 plots oflog V vs lot P at a given constant temperature are shown. Identify the correct option
View SolutionThe plot of √v vs Z is
View SolutionFor same mass of two different ideal gases of molecular weights M1andM2 plots of log V vs log P at a given constant temperature are shown. Identify the correct option.

View Solution
