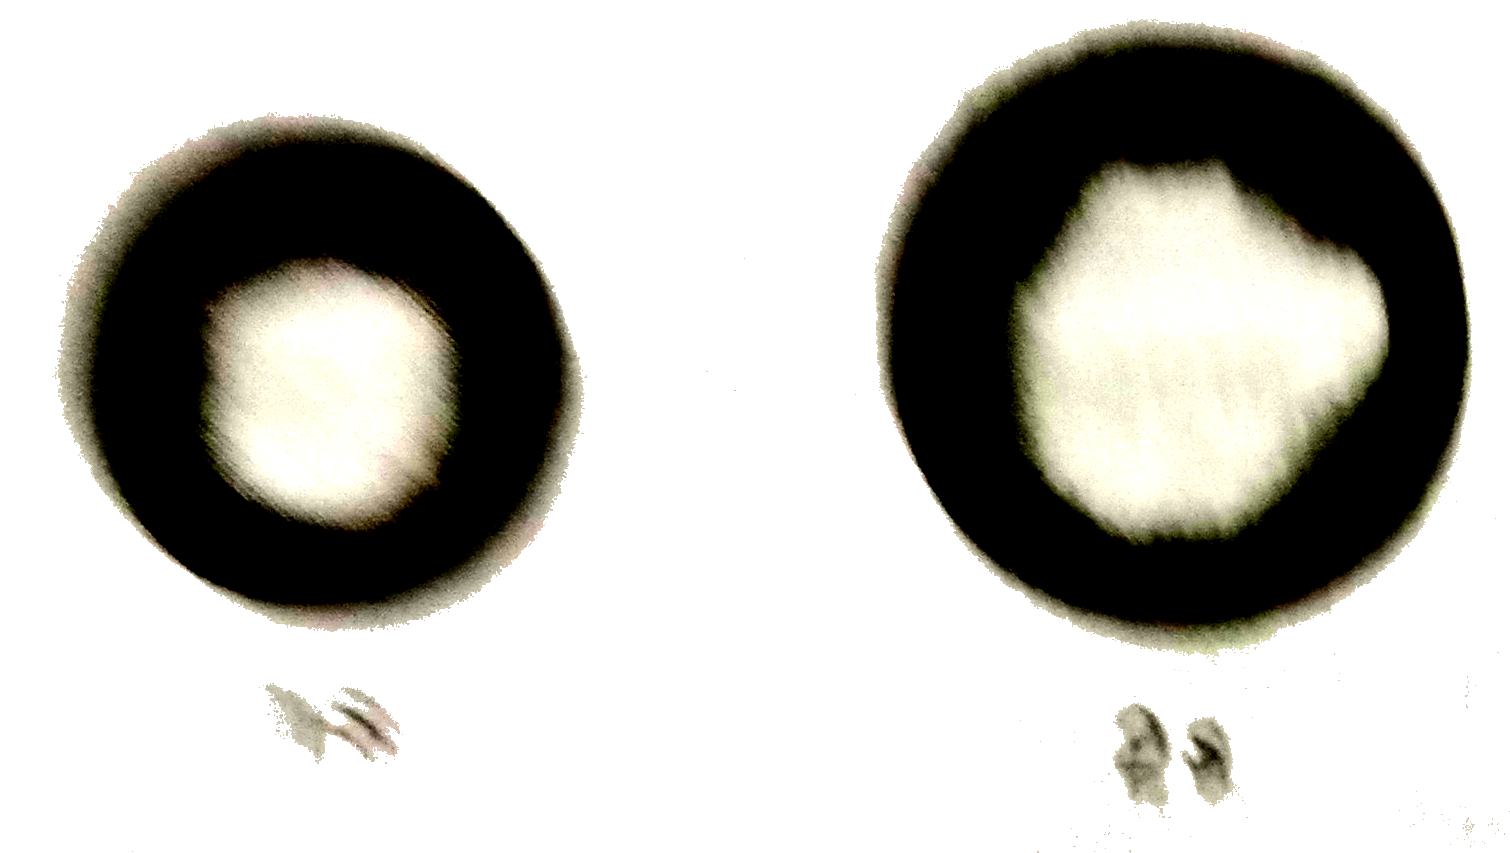
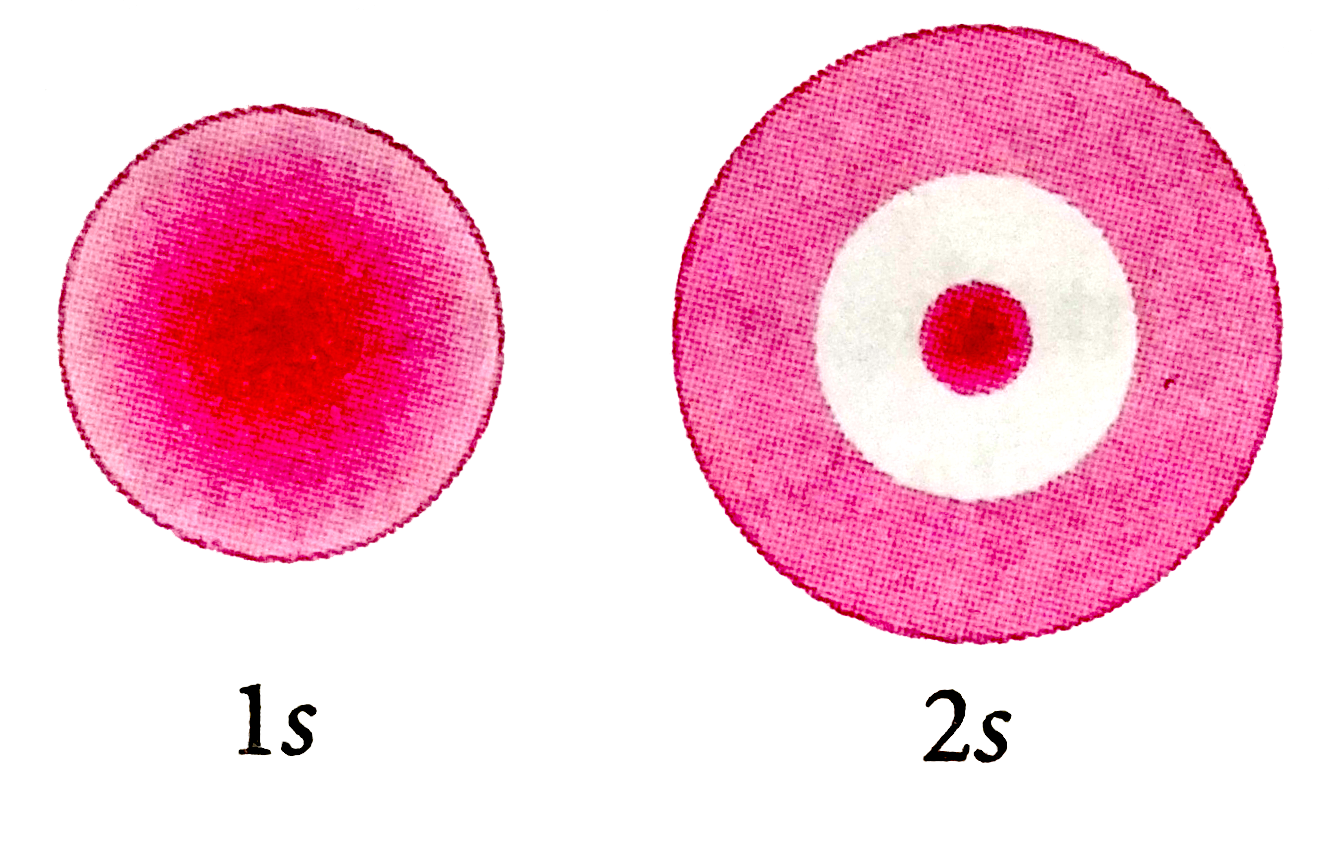
The probabilty density plotes of 1s and 2s Orbitals are given in Fig. 1 :

The density of dots in a region represents the probabilty density of finding electrons in the region.
on the basis of above digram which of the following statements is incorrect?
1s and 2s orbitals are sphericlal in shape .
The probabilty of finding the electron is maximum near the nucleus.
The probabiltyof finding the electron at a given distance is equal in all direction is equal in all directions .
The probabilty density of electrons for 2s orbital decreases uniformly as distance frome the nucleus increases .
The correct Answer is:D
The probability density of electrons in 2s orbit first increases, then decreases and after that it begins to increases again.
Topper's Solved these Questions
- STRUCTURE OF ATOMBOOK - MODERN PUBLICATIONCHAPTER - STRUCTURE OF ATOMEXERCISE - NCERT (Exemplar Problems) (Multiple Choice Questions (Type-II)
5 Videos
- STRUCTURE OF ATOMBOOK - MODERN PUBLICATIONCHAPTER - STRUCTURE OF ATOMEXERCISE - NCERT (Exemplar Problems) (Short Answer Questions)
20 Videos
- STRUCTURE OF ATOMBOOK - MODERN PUBLICATIONCHAPTER - STRUCTURE OF ATOMEXERCISE - NCERT FILE SOLVED (TEXT BOOK EXERCISES)
67 Videos
- STATES OF MATTER : GASES AND LIQUIDSBOOK - MODERN PUBLICATIONCHAPTER - STATES OF MATTER : GASES AND LIQUIDSEXERCISE - UNIT PRACTICE TEST
13 Videos
- THERMODYNAMICSBOOK - MODERN PUBLICATIONCHAPTER - THERMODYNAMICSEXERCISE - Unit Practice Test
12 Videos
Similar Questions
The probability density plots of 1 s and 2s orbitals are given in figure.

The density of dots in a region represetns the probability density of finding electrons in the region. On the basis of above diagram which of the following statements is incorrect?
View SolutionThe probability density plots of 1s and 2s atomic orbitals are given in figures.

The density of dots in a region represents the probability density of finding electrons in the region. On the basis of the above diagram, which of the following statements is incorect?
View Solution
Knowledge Check
The probability density plots of 1 s and 2s orbitals are given in figure.

The density of dots in a region represetns the probability density of finding electrons in the region. On the basis of above diagram which of the following statements is incorrect?A1s and 2s orbitals are spherical in shapeBThe probability of finding the electron is maximum near the nucleusCThe probability of finding the electron at a given distance is equal in all directionsDThe probability density of electrons for 2s orbital dec reases uniformly as distance from the nucleus increases.The electron density between 1s and 2s is
AHighBLowCZeroDAbnormalWhich of the following statements is incorrect for 1s orbital of hydrogen atom?
AIt is possible to find an electron at a distance 2a0 (a0= Bohr radius)BThe magnitude of potential energy is twice of kinetic energy for a given orbitCThe total energy of an electron is maximum in its first orbit.DThe probality density of finding an electron is maximum at the nucleus
Energy density in the region between 1s and 2s orbital is …………
View SolutionEnergy density in the region between 1s and 2s orbital is …………
View SolutionPredict which of the following statements are true or false.
Ψ2 represents probability density .
View SolutionThe number of nodal regions for an 's' orbital is given by (n - 1). How do you account for this
View SolutionWhich of the following compound/s have more electron density than

View Solution
