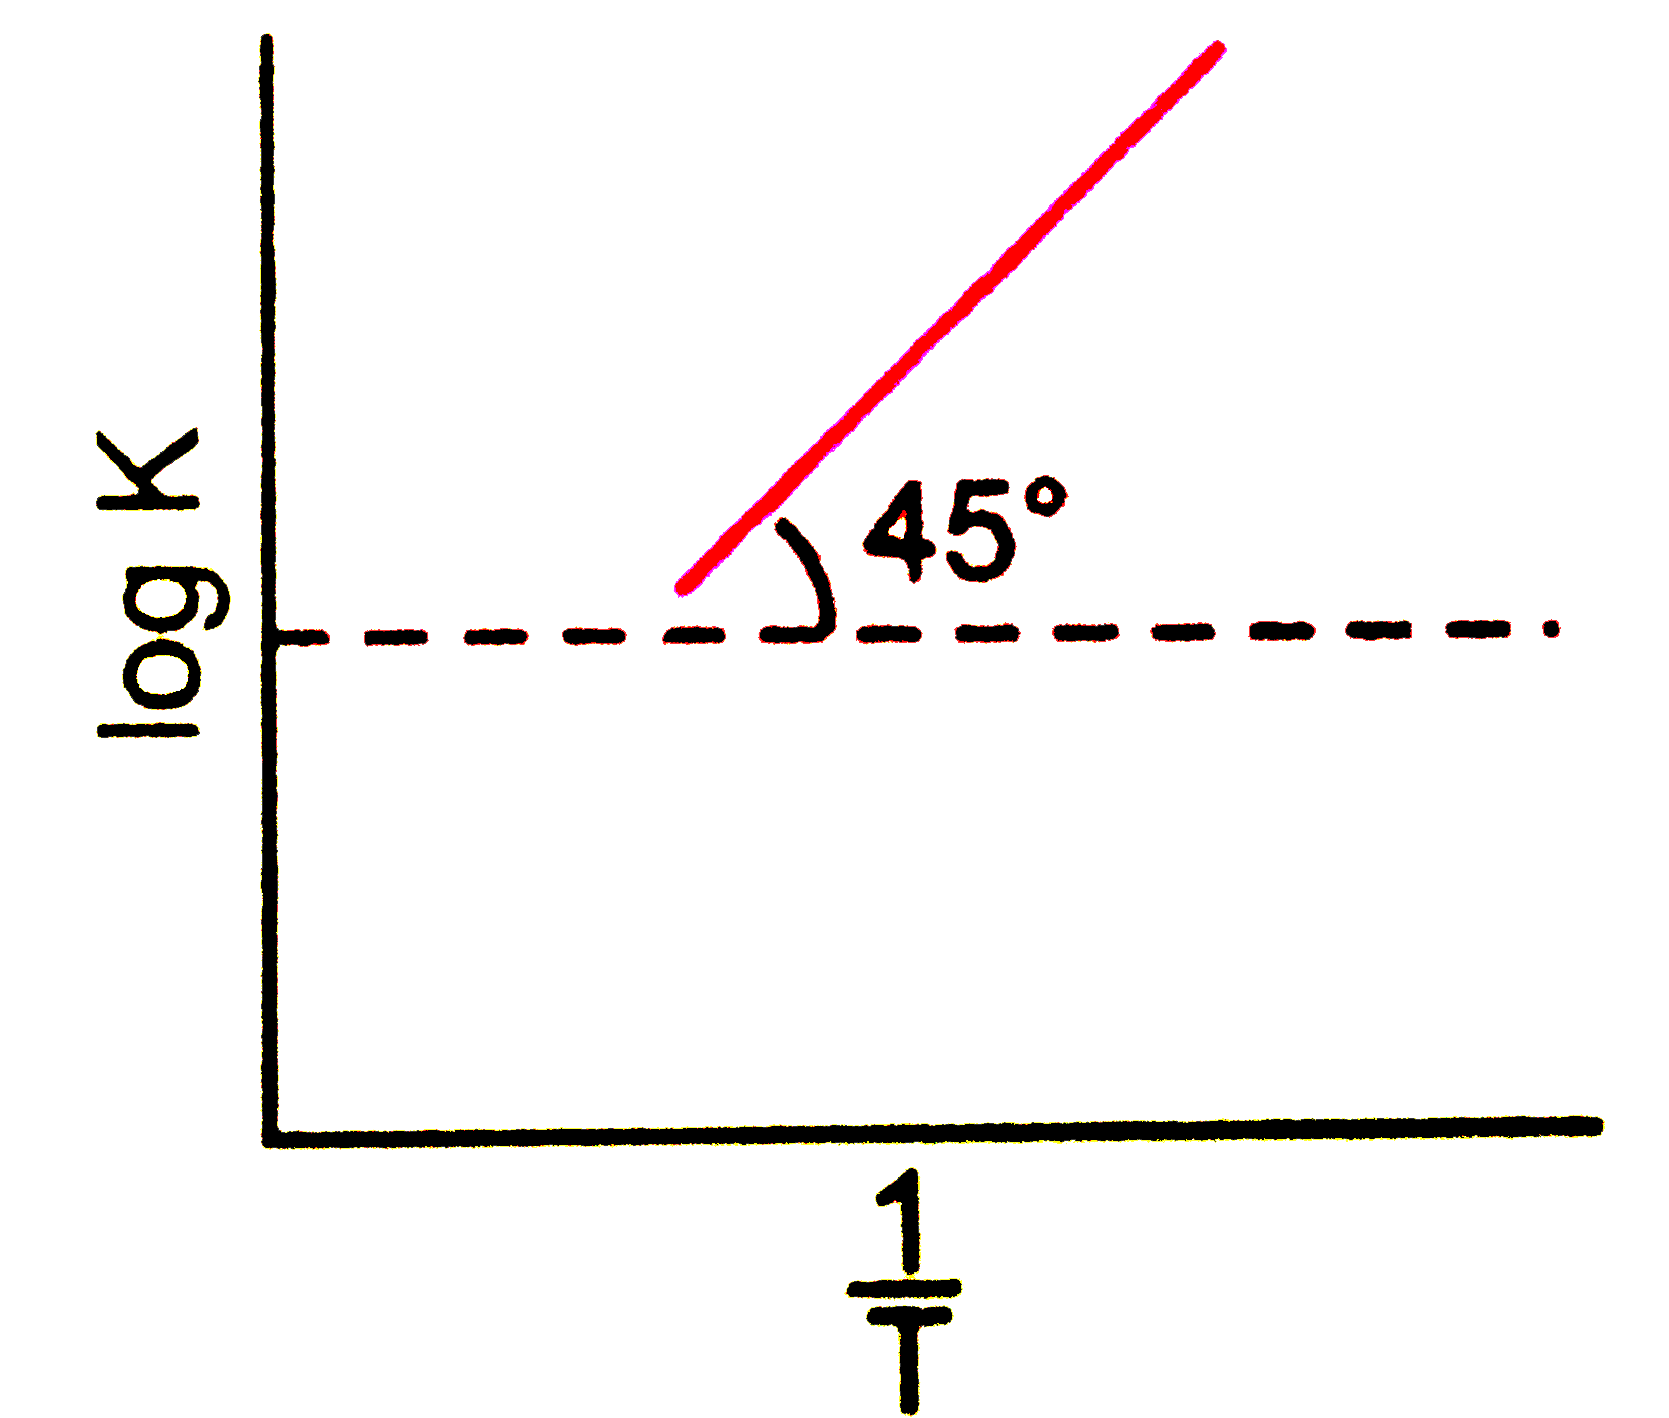
The variation of equilibrium constant ( K) with temperature ( T) was stupied by plotting log K versus 1/T The plot obtained is shown iin the Fig . Hence, enthalpy change (ΔH∘) of the reaction is
+2cal
−2cal
+4.606cal
−4.606cal
The correct Answer is:D
According to van't Hoff equation ,
logK=ΔH∘2.303RT+constant
∴PlotoflogKvs1/Tisl∈earwithslope
=ΔH∘2.303R
Slope = tanθ=tan45∘=1 . Hence , ΔH∘=−2.303R
=−2.303×2cal=−4.606cal
Topper's Solved these Questions
- BOOK - PRADEEPCHAPTER - EQUILIBRIUM IN PHYSICAL AND CHEMICAL PROCESSESEXERCISE - Competition Focus (Jee(Main and advanced)/Medical Entrance) II. MULTIPLE CHOICE QUESTIONS (with one or More One correct answer)6videos
EQUILIBRIUM IN PHYSICAL AND CHEMICAL PROCESSES
- BOOK - PRADEEPCHAPTER - EQUILIBRIUM IN PHYSICAL AND CHEMICAL PROCESSESEXERCISE - Competition Focus (Jee(Main and advanced)/Medical Entrance) III. MULTIPLE CHOICE QUESTIONS (Based on the given Passage/Comprehension)7videos
EQUILIBRIUM IN PHYSICAL AND CHEMICAL PROCESSES
- BOOK - PRADEEPCHAPTER - EQUILIBRIUM IN PHYSICAL AND CHEMICAL PROCESSESEXERCISE - ANALYTICAL QUESTIONS AND PROBLEMS WITH ANSWER/SOLUTIONS (PROBLEMS)20videos
EQUILIBRIUM IN PHYSICAL AND CHEMICAL PROCESSES
- BOOK - PRADEEPCHAPTER - EQUILIBRIUMEXERCISE - Competition Focus (VIII. Assertion-Reason Type Questions)16videos
EQUILIBRIUM
- BOOK - PRADEEPCHAPTER - HYDROCARBONSEXERCISE - Competition Focus (JEE(main and advanced)/Medical Entrance) VIII. ASSERTION - REASON TYPE QUESTIONS31videos
HYDROCARBONS
Similar Questions
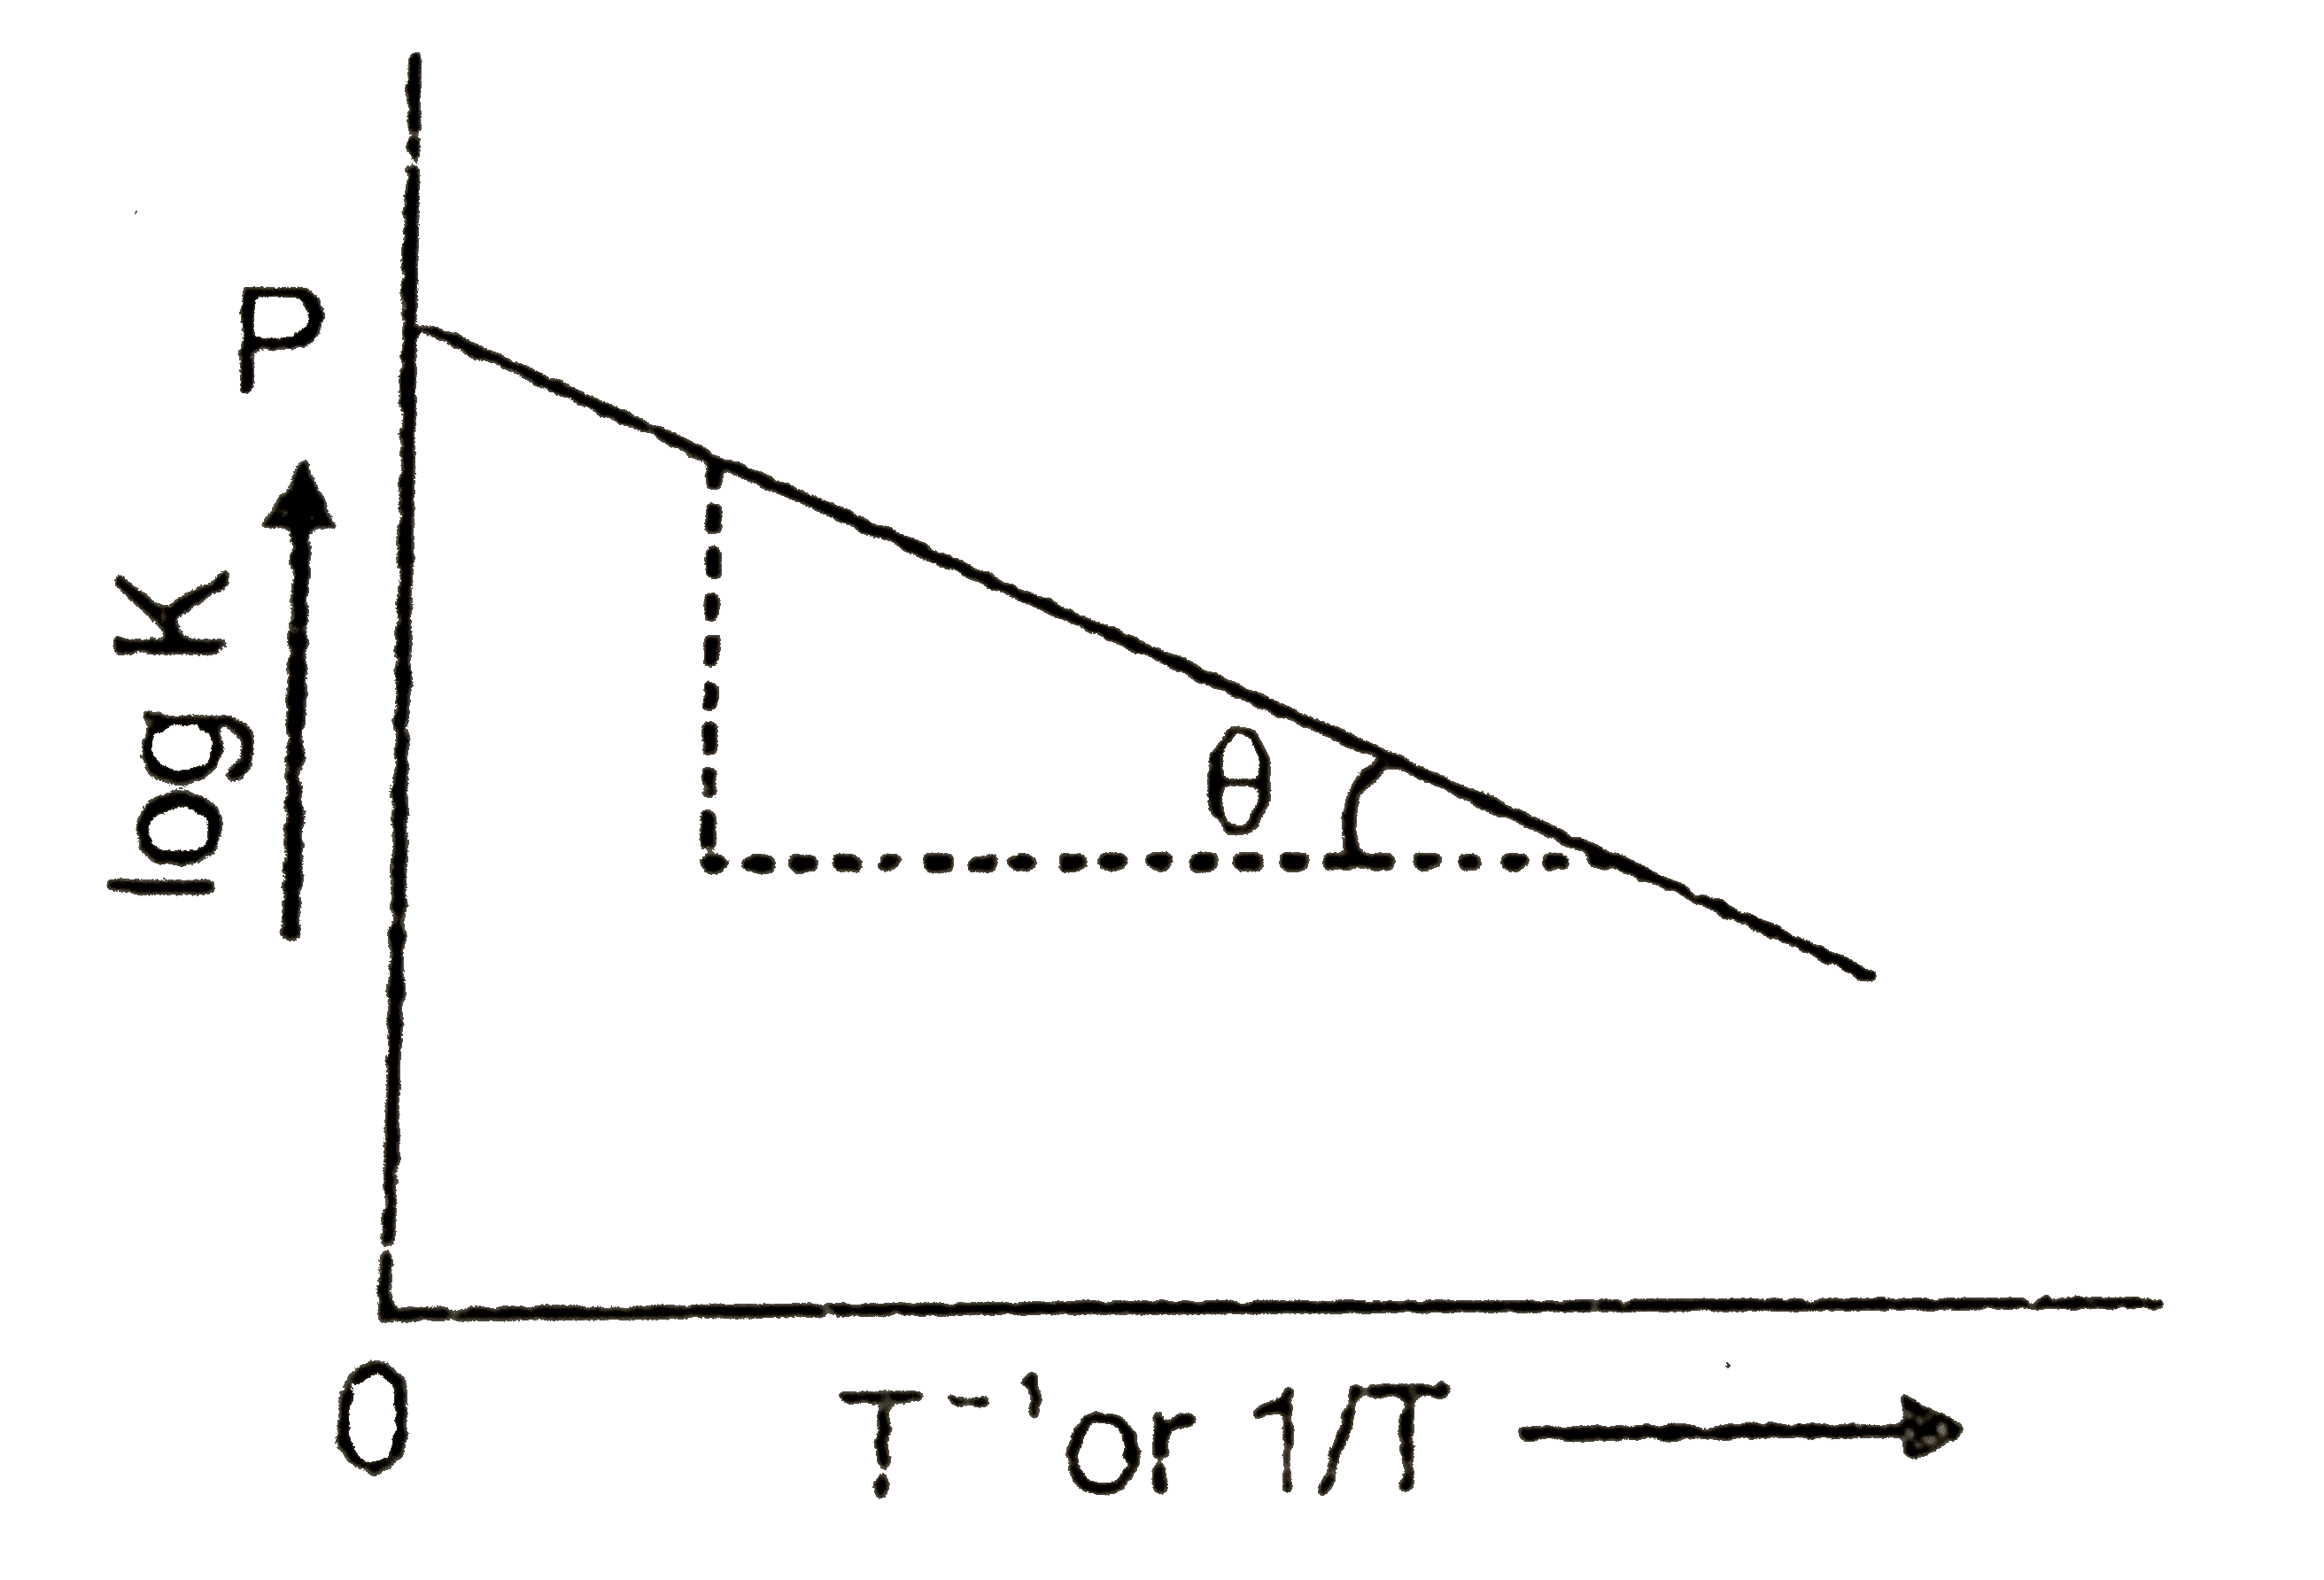
Variation of equiibrium constant K with temperature T is given by van 't Holf equation,
logK=logA−ΔH∘2.303RT
A graph between log K and T−1 was a straight line as shown in the figure and having θ=tan−1(0.5)andOP=10. Calculate:
(a) ΔH∘ (standard heat of reaction)when T=300K,
(b) A (pre-exponetial factor),
(c) Equilibrium constant K at 300K,
(d) Kat900KifΔH∘ is independent of temperature.
 View Solution
Plots showing the variation of the rate constant (k) with temperature (T) are given below. The plot that follows Arrhenius equations is
View Solution
Knowledge Check
- Question 1 - Select One
Plots showing the variation of the rate constant (k) with temperature (T) are given below. The plot that follows the Arrhenius equation is
A B
B C
C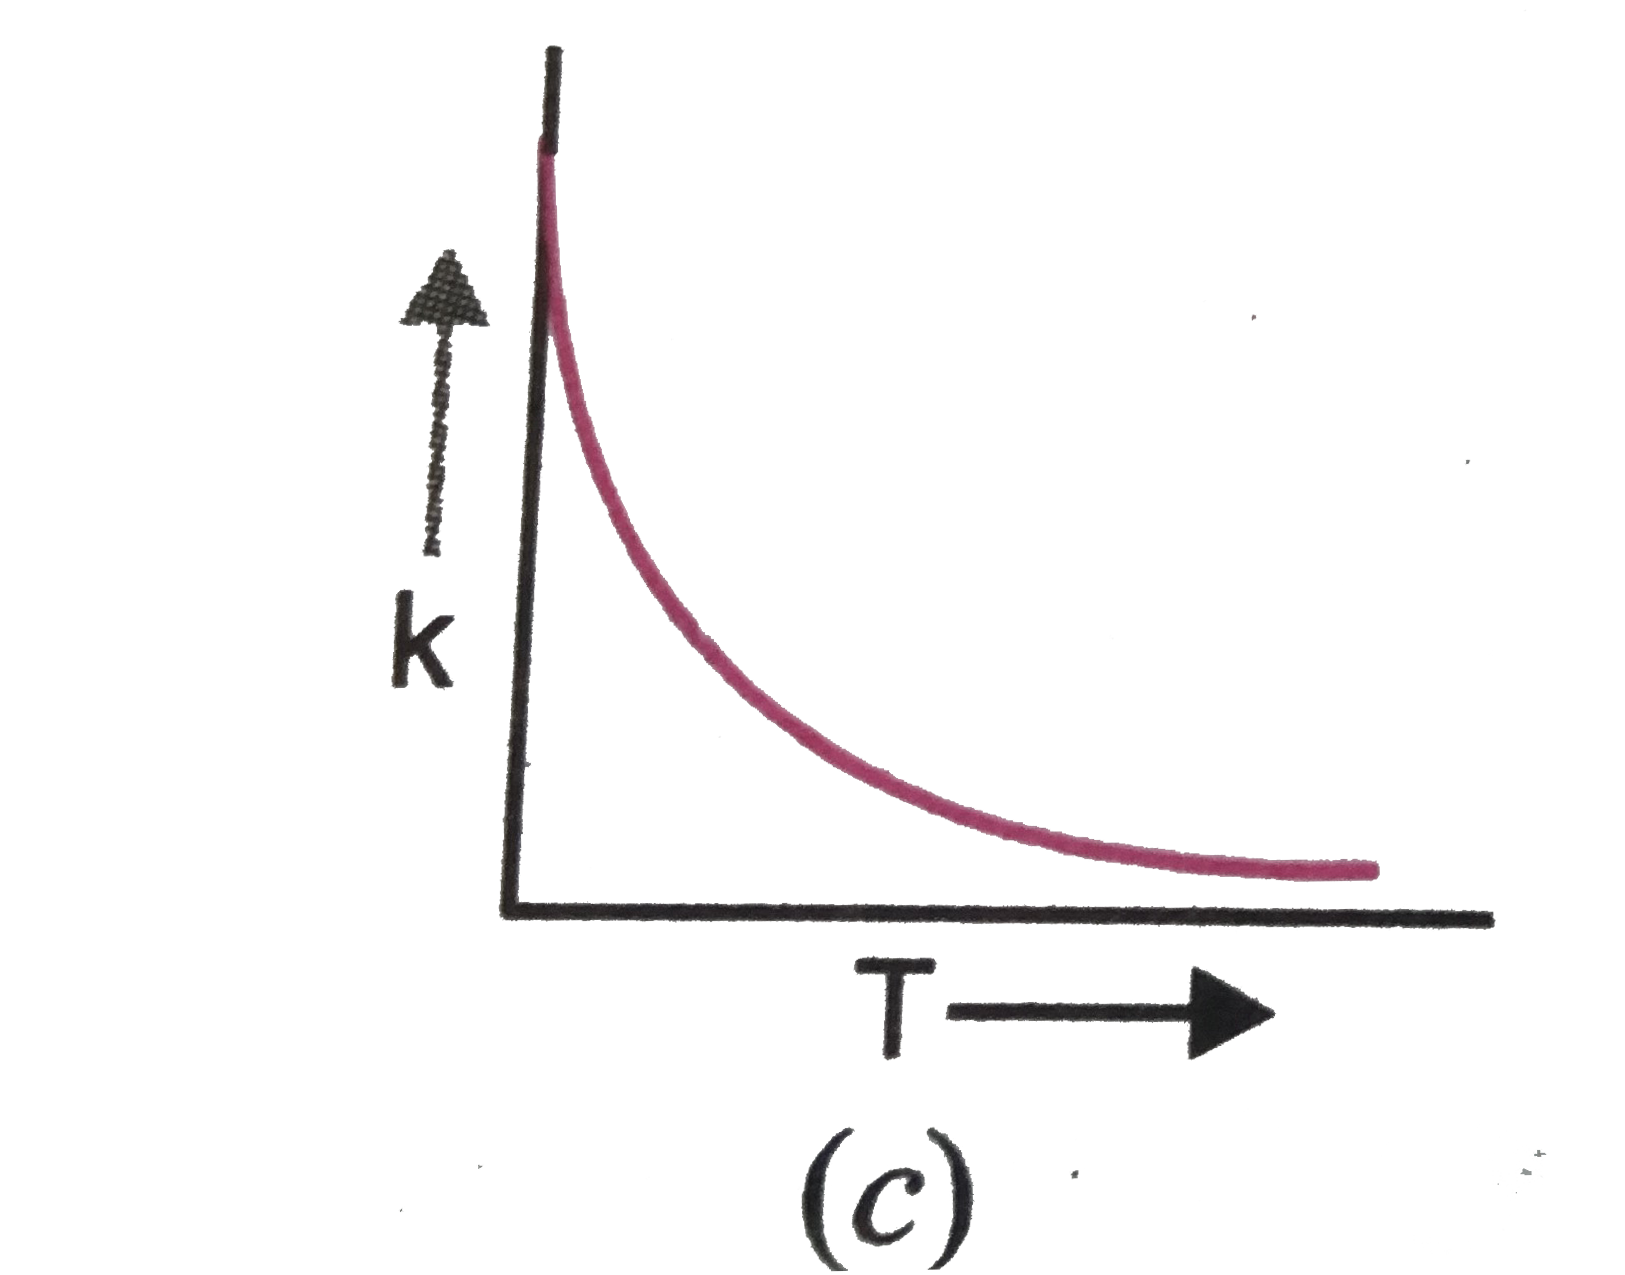 D
D
- Question 2 - Select One
Plots showing the variation of the rate constant (k) with temperature (T) are given below. The plot that follows the Arrhenius equation is
A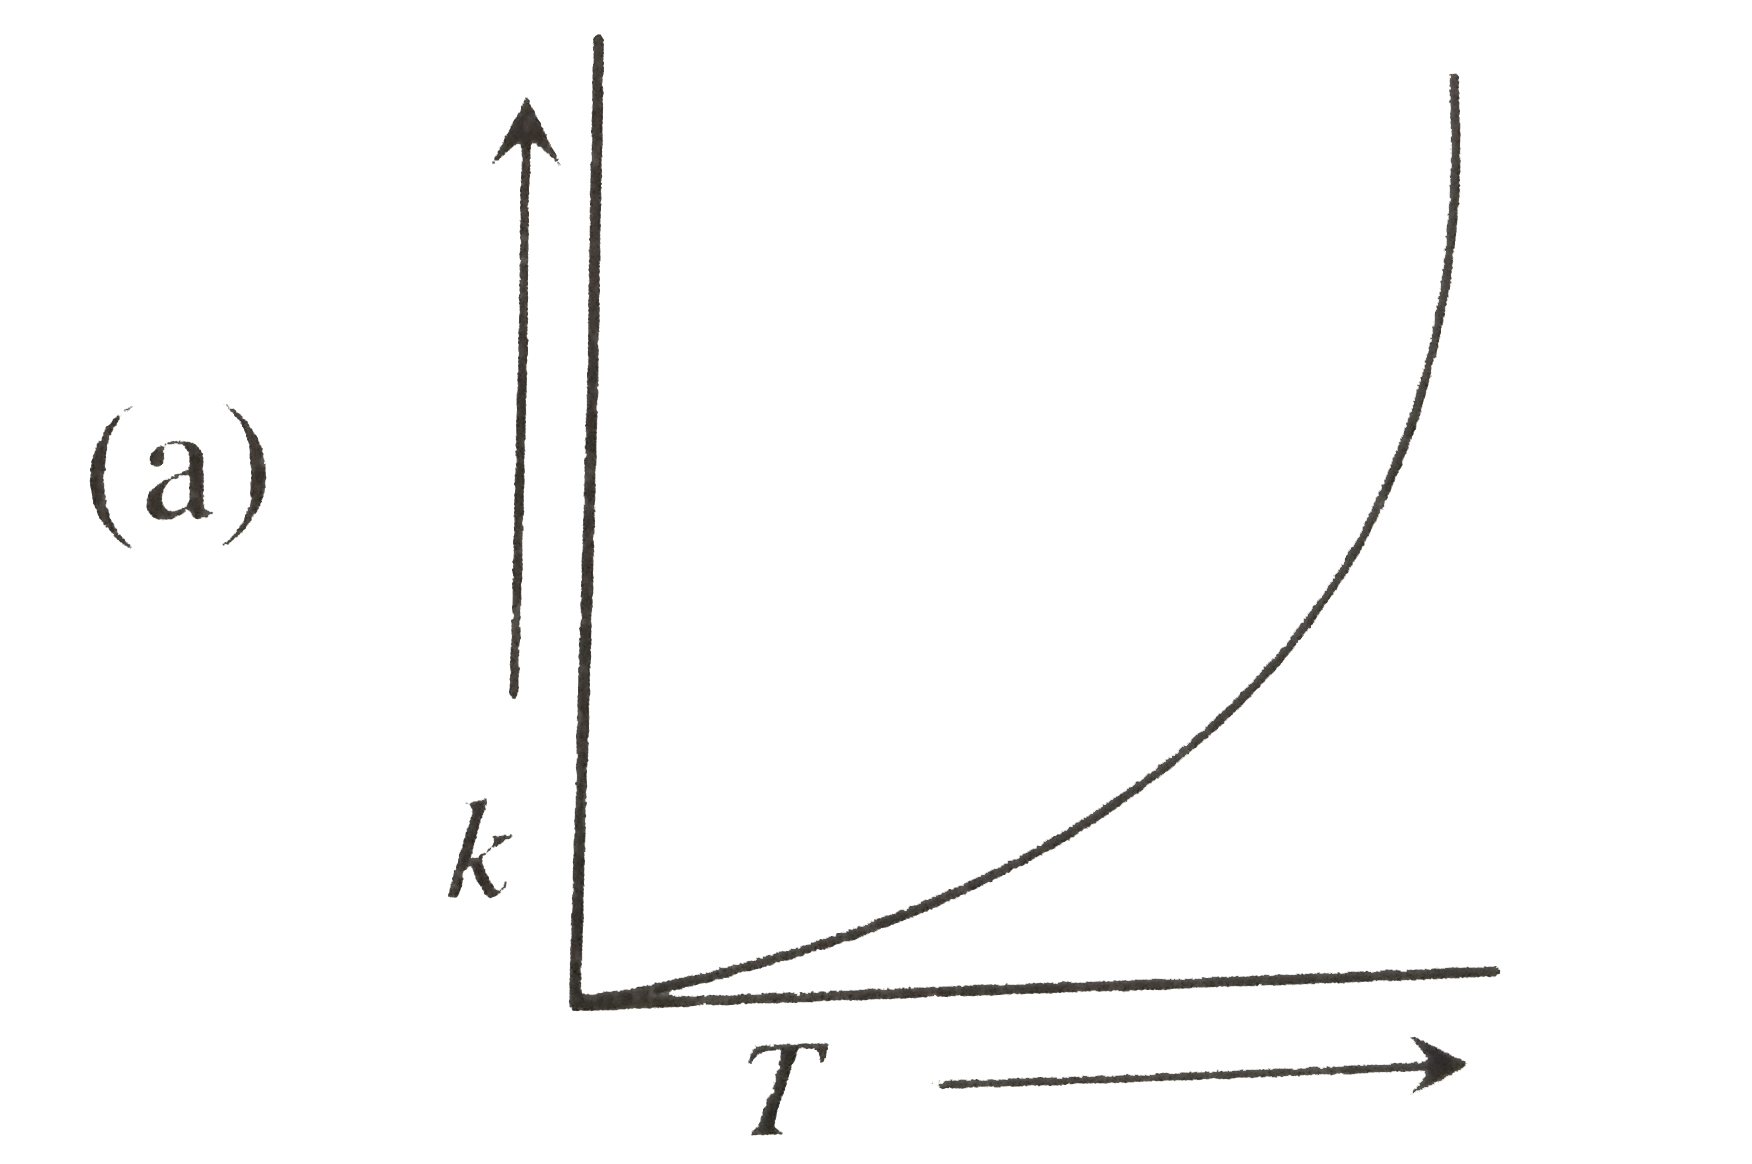 B
B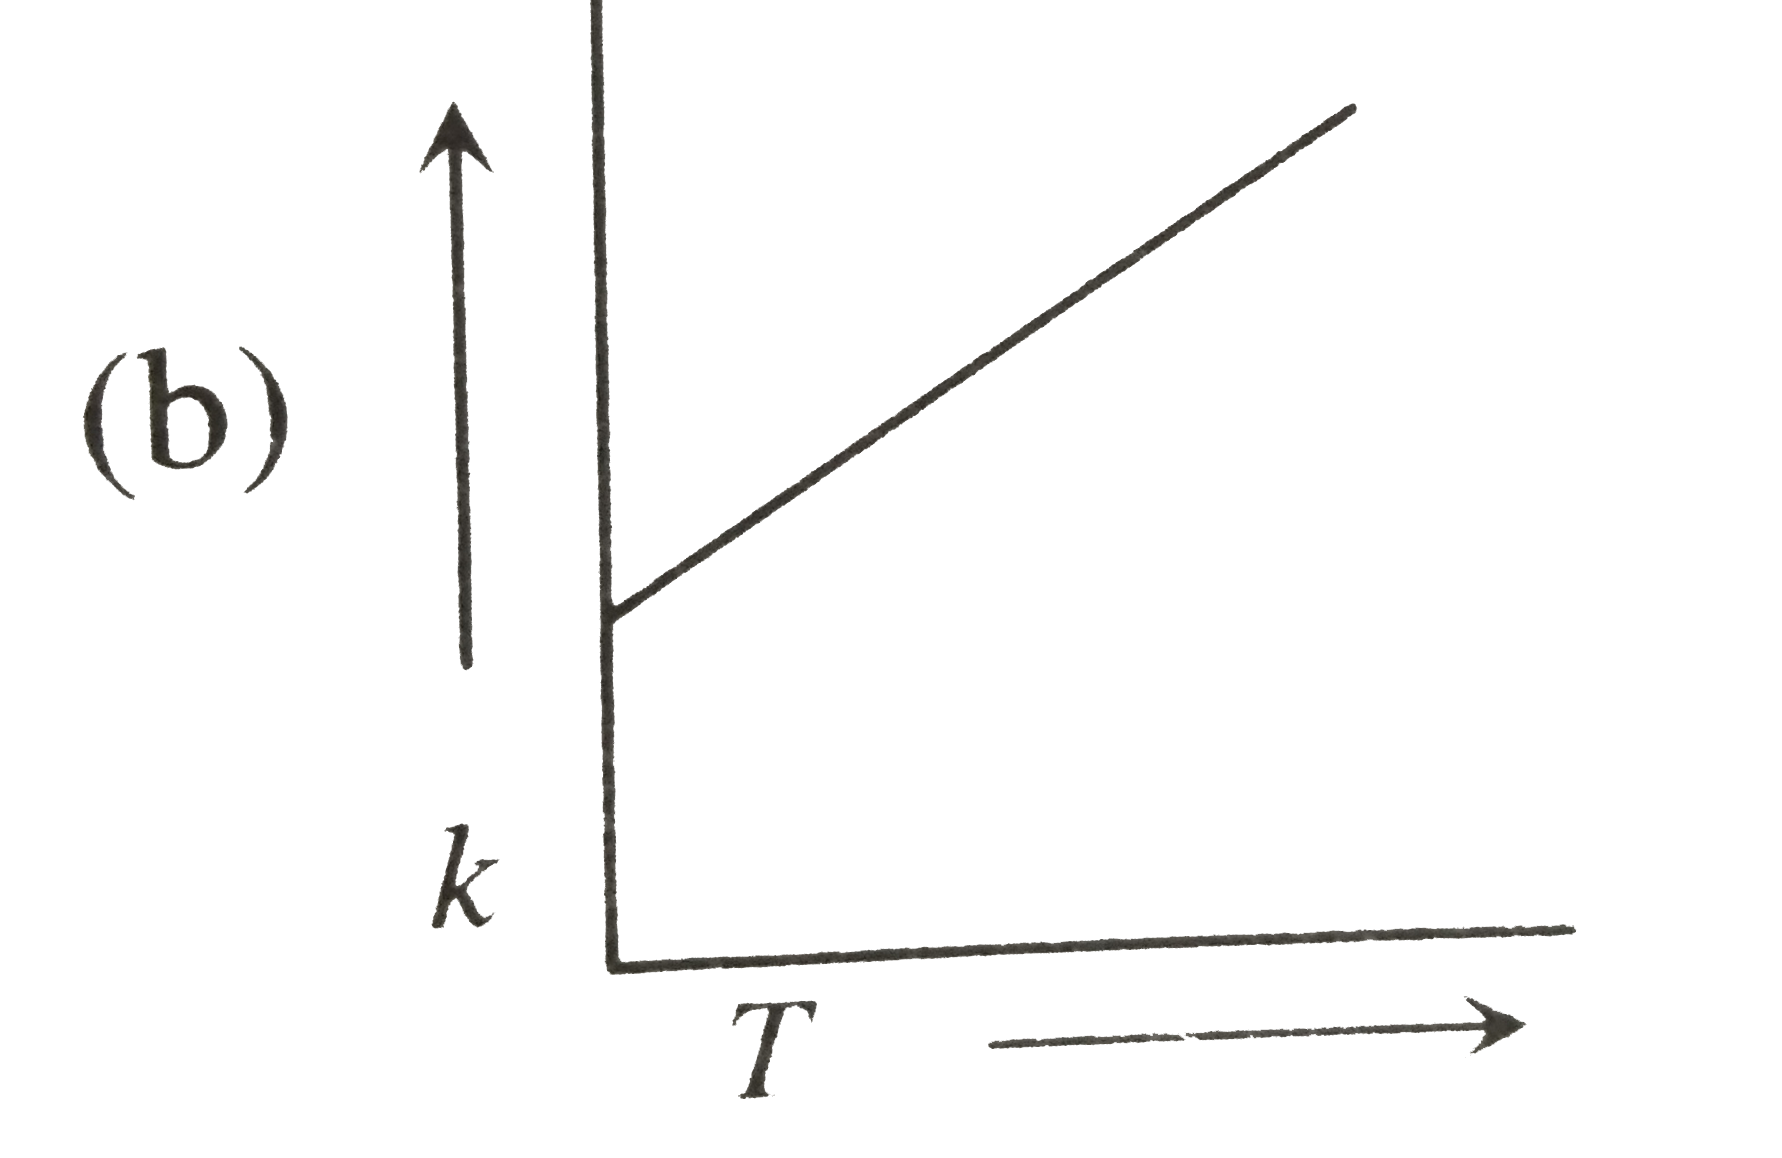 C
C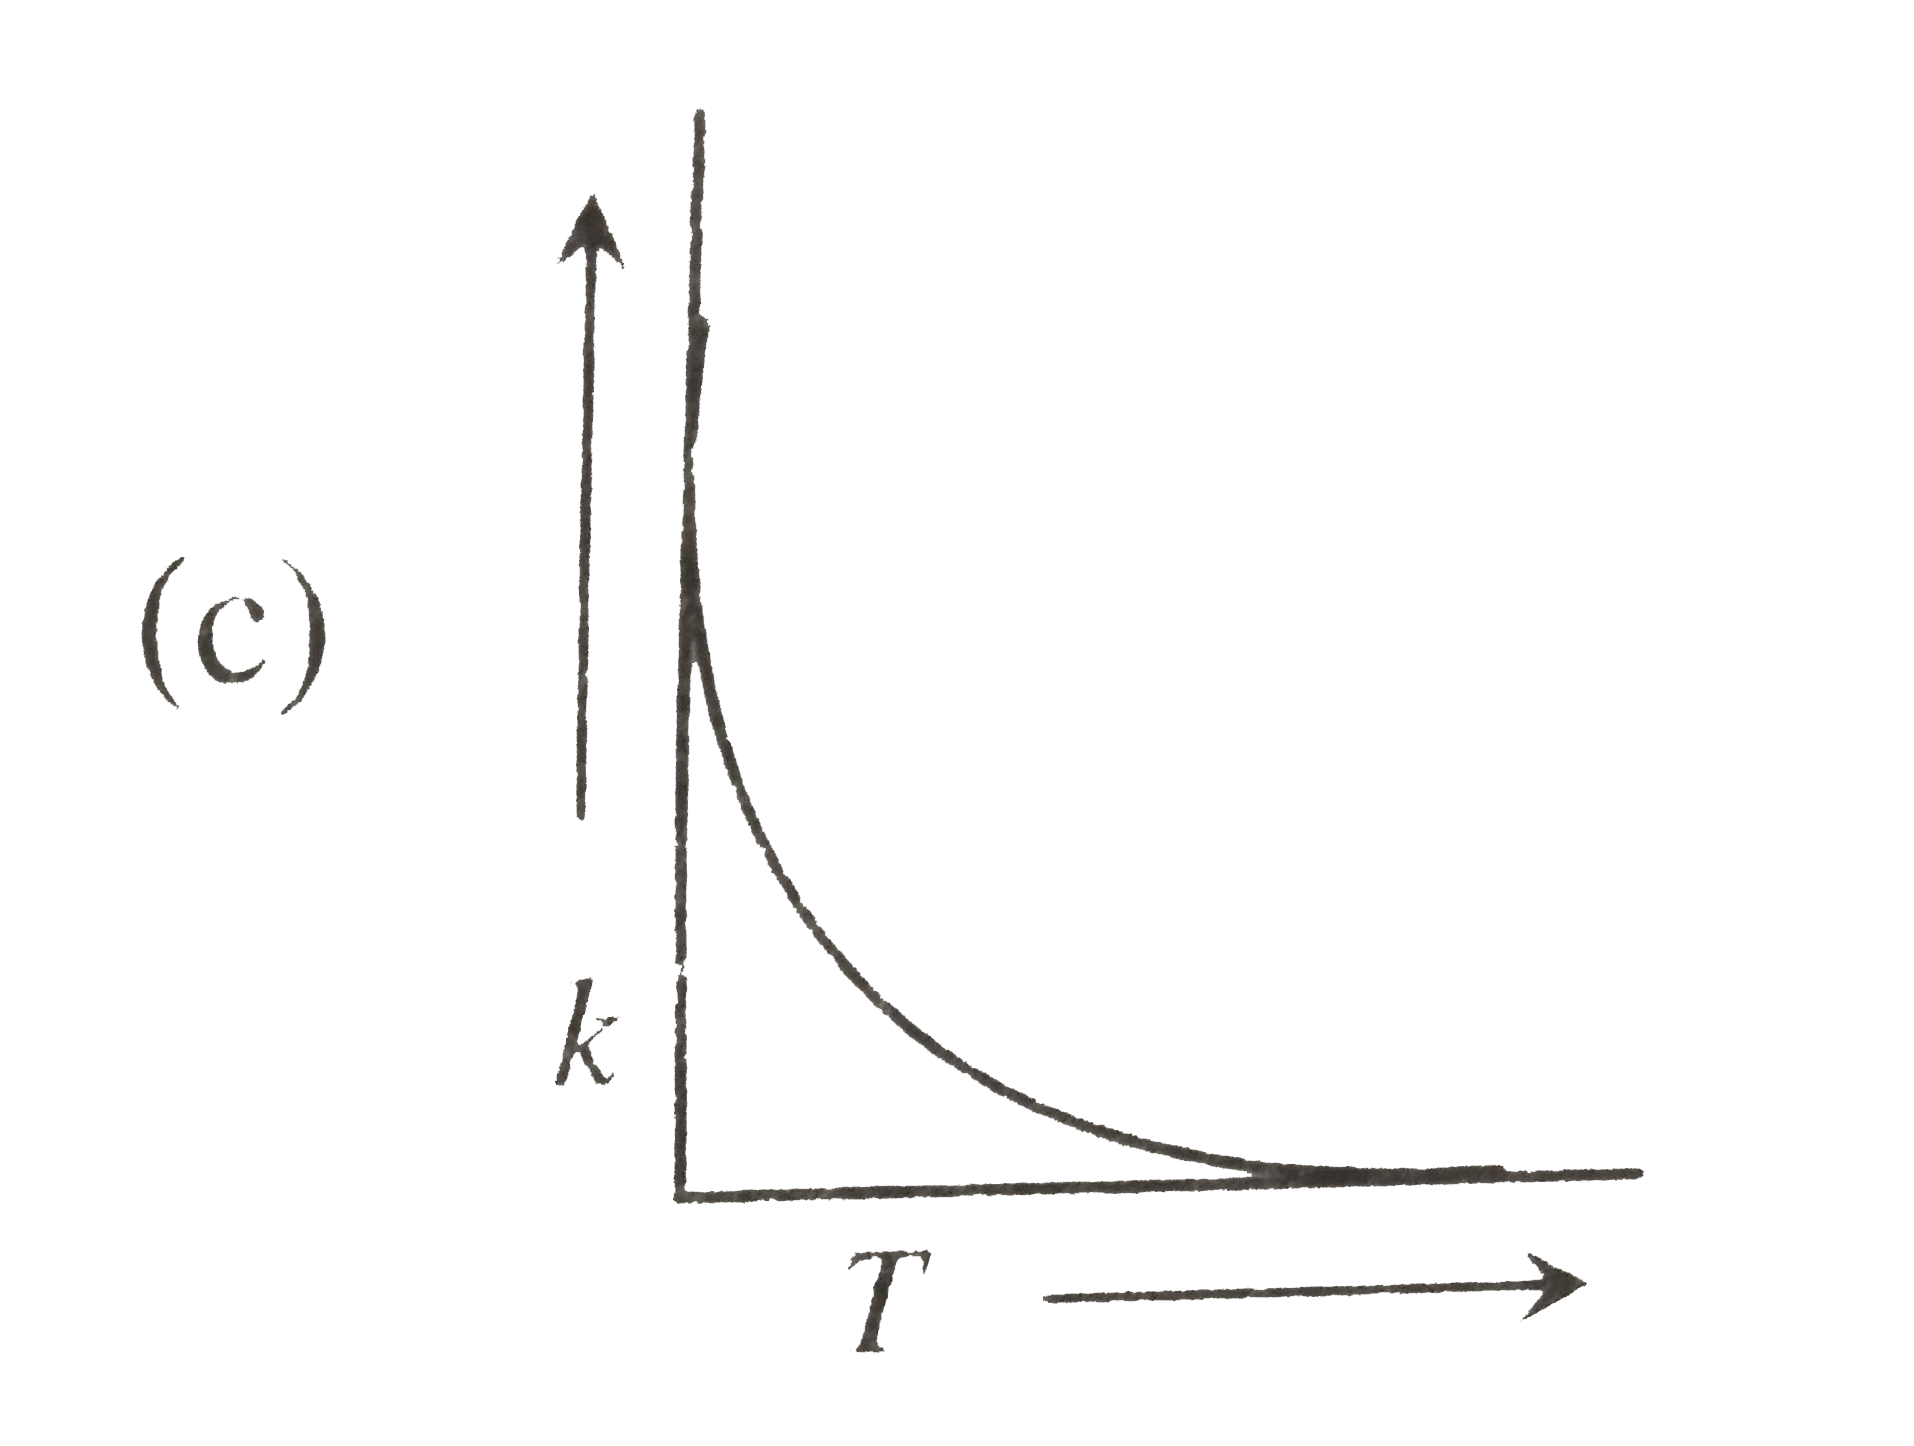 D
D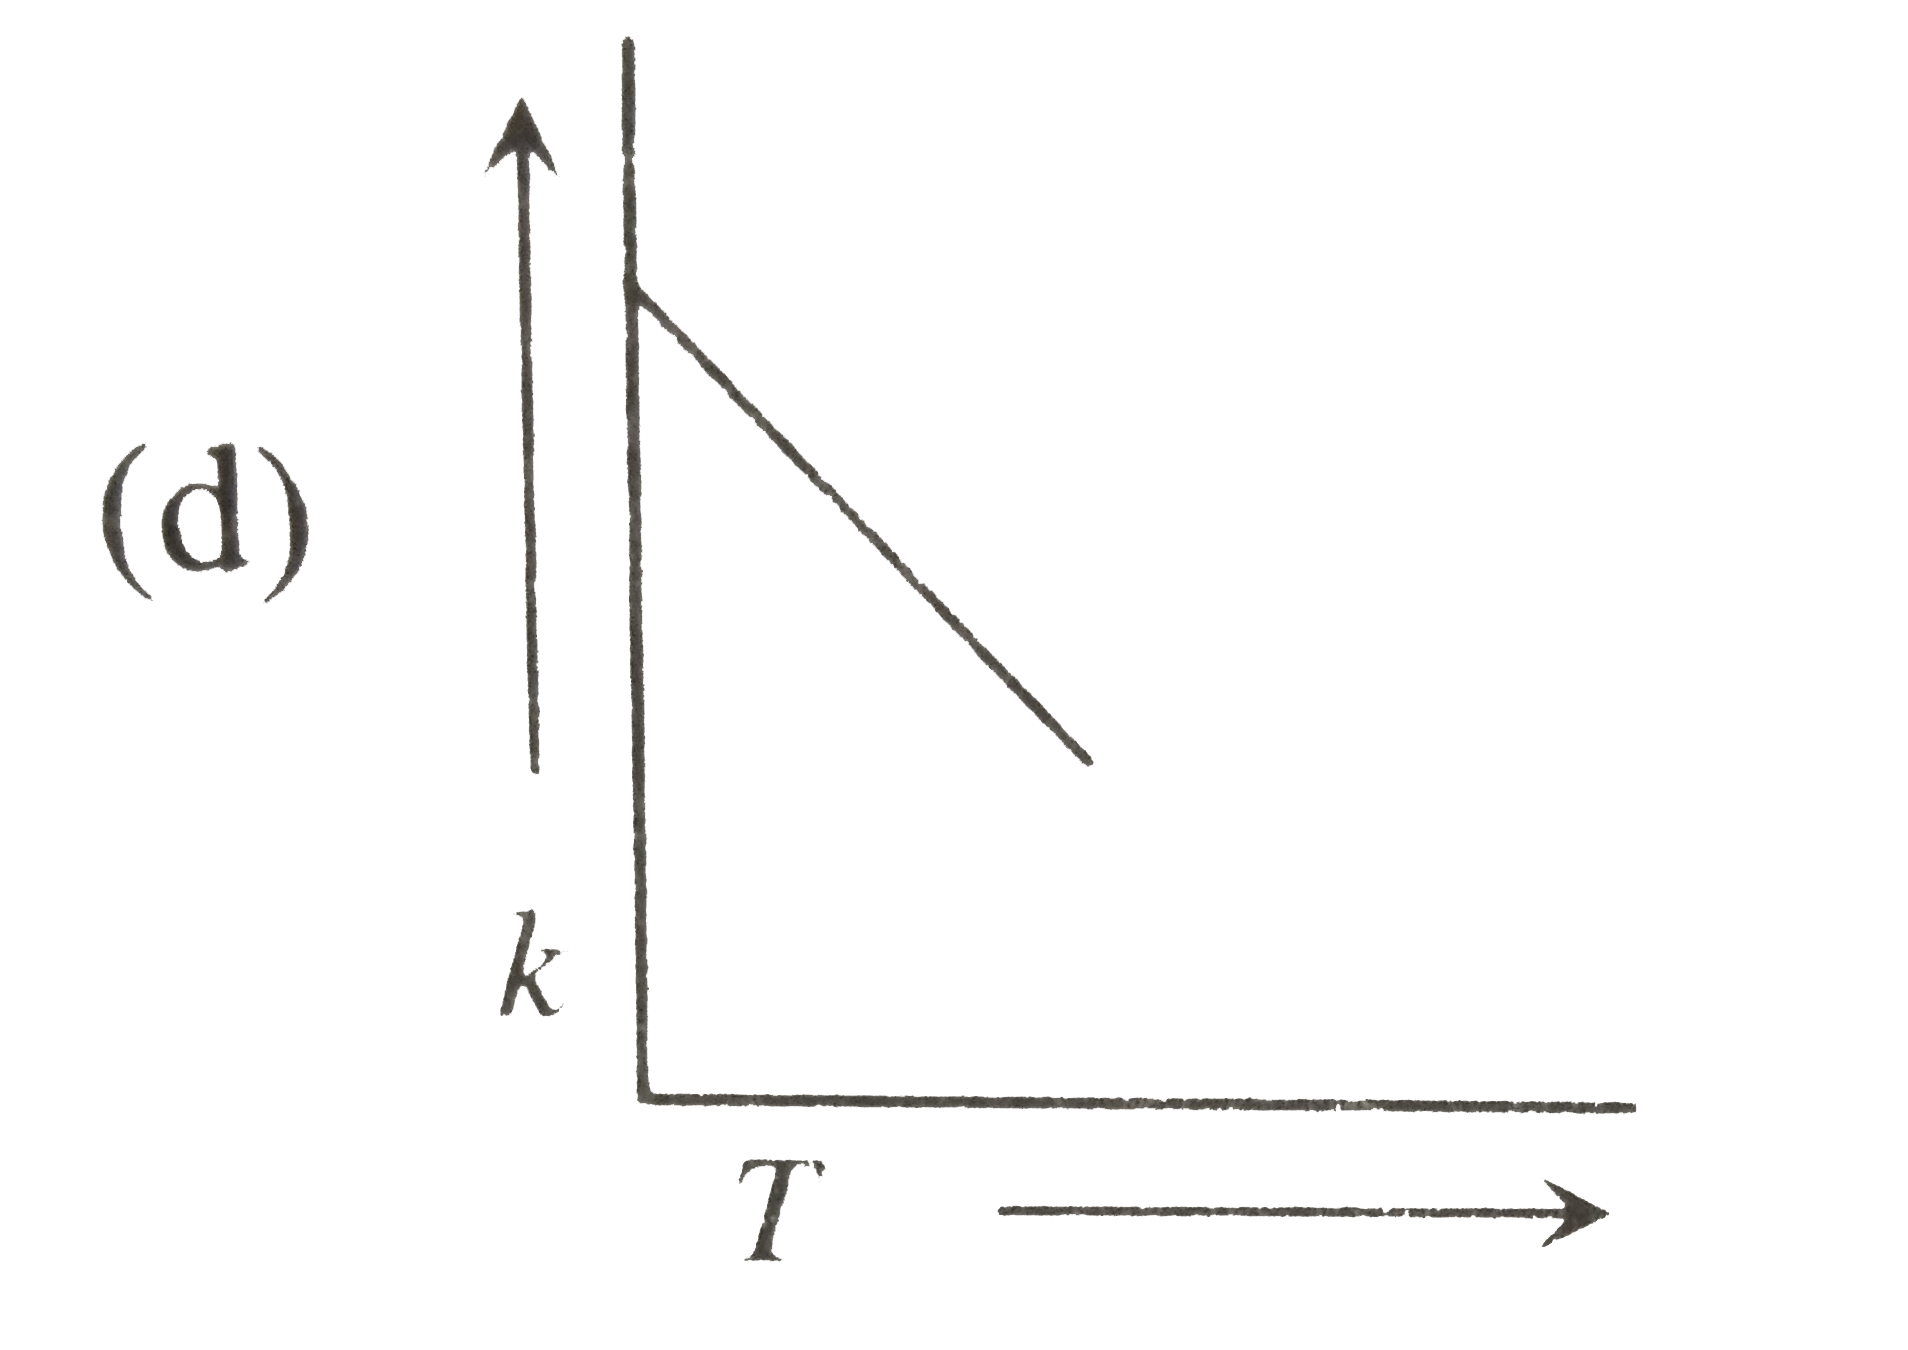
- Question 3 - Select One
Plots showing the variation of the rate constant (k) with temperature (T) are given below. The plot that follows the Arrhenius equation is
A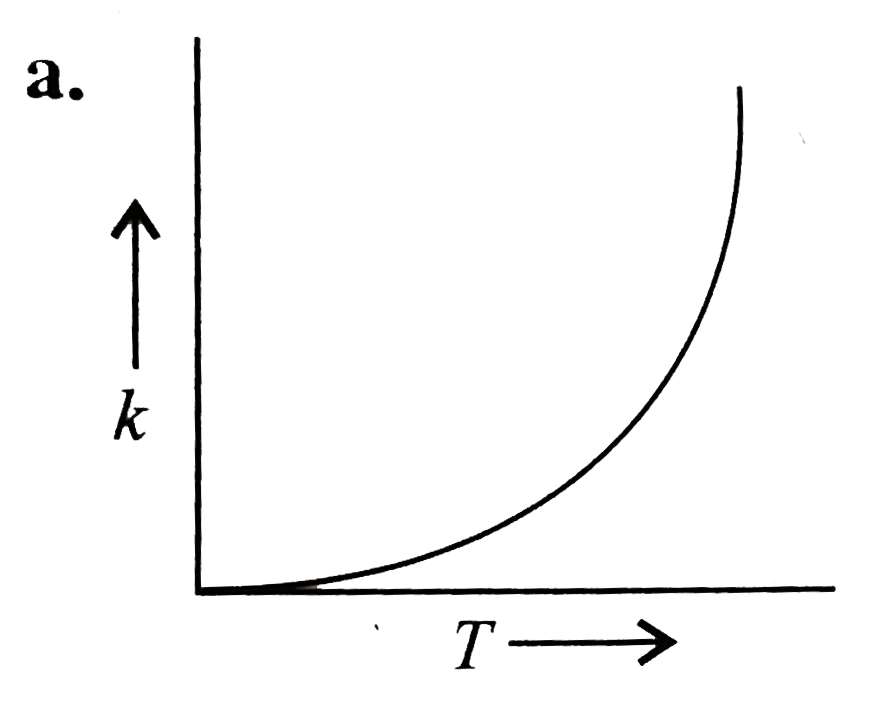 B
B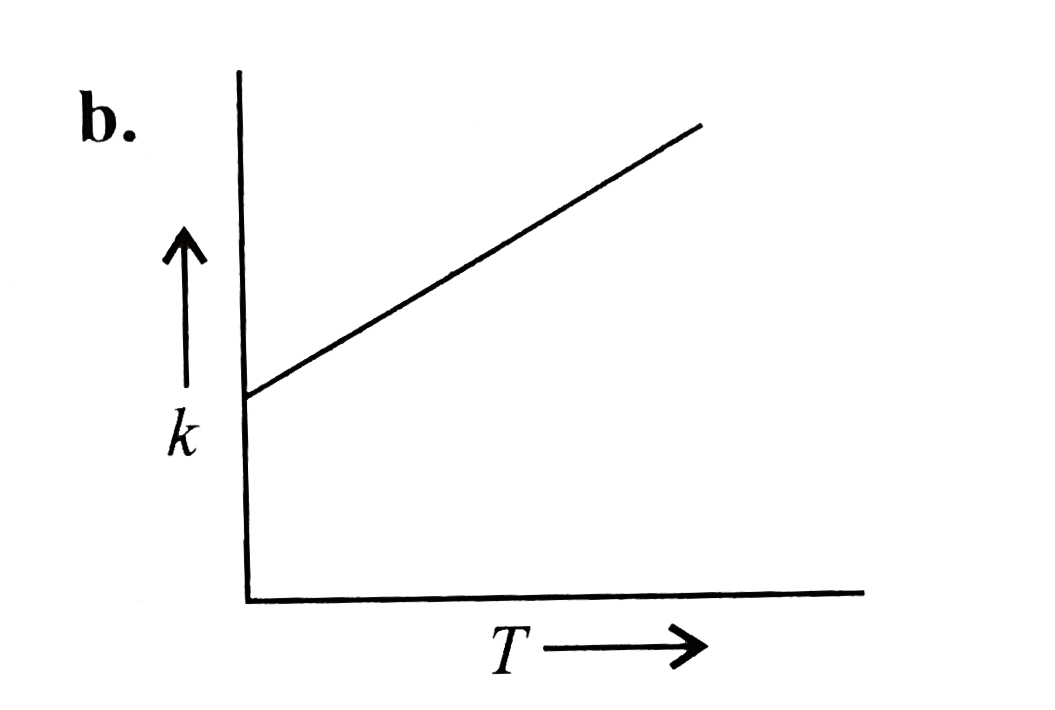 C
C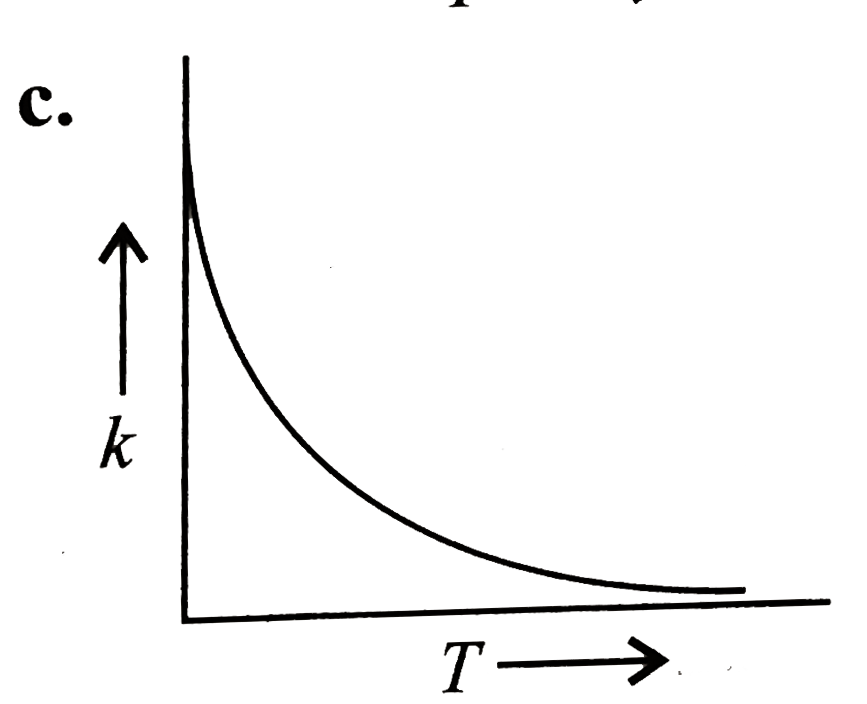 D
D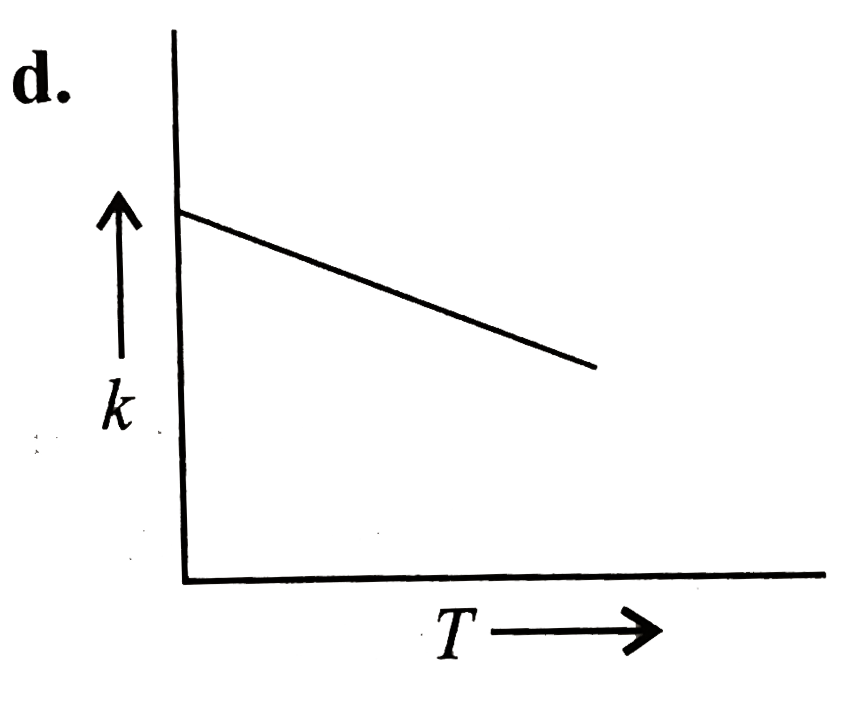
Variation of KH (Henry's law constant) with temperature T is shown by following graphs I−IV

correct representation isView SolutionThe plot of In k versus 1T is liner with slope of
View SolutionThe plot og logk vs 1/T helps to calculate
View SolutionThe plot of log k vs 1/T helps to calculate
View SolutionA graph plotted between logk versus 1/T for calculating activation energy is shown by
View Solution

