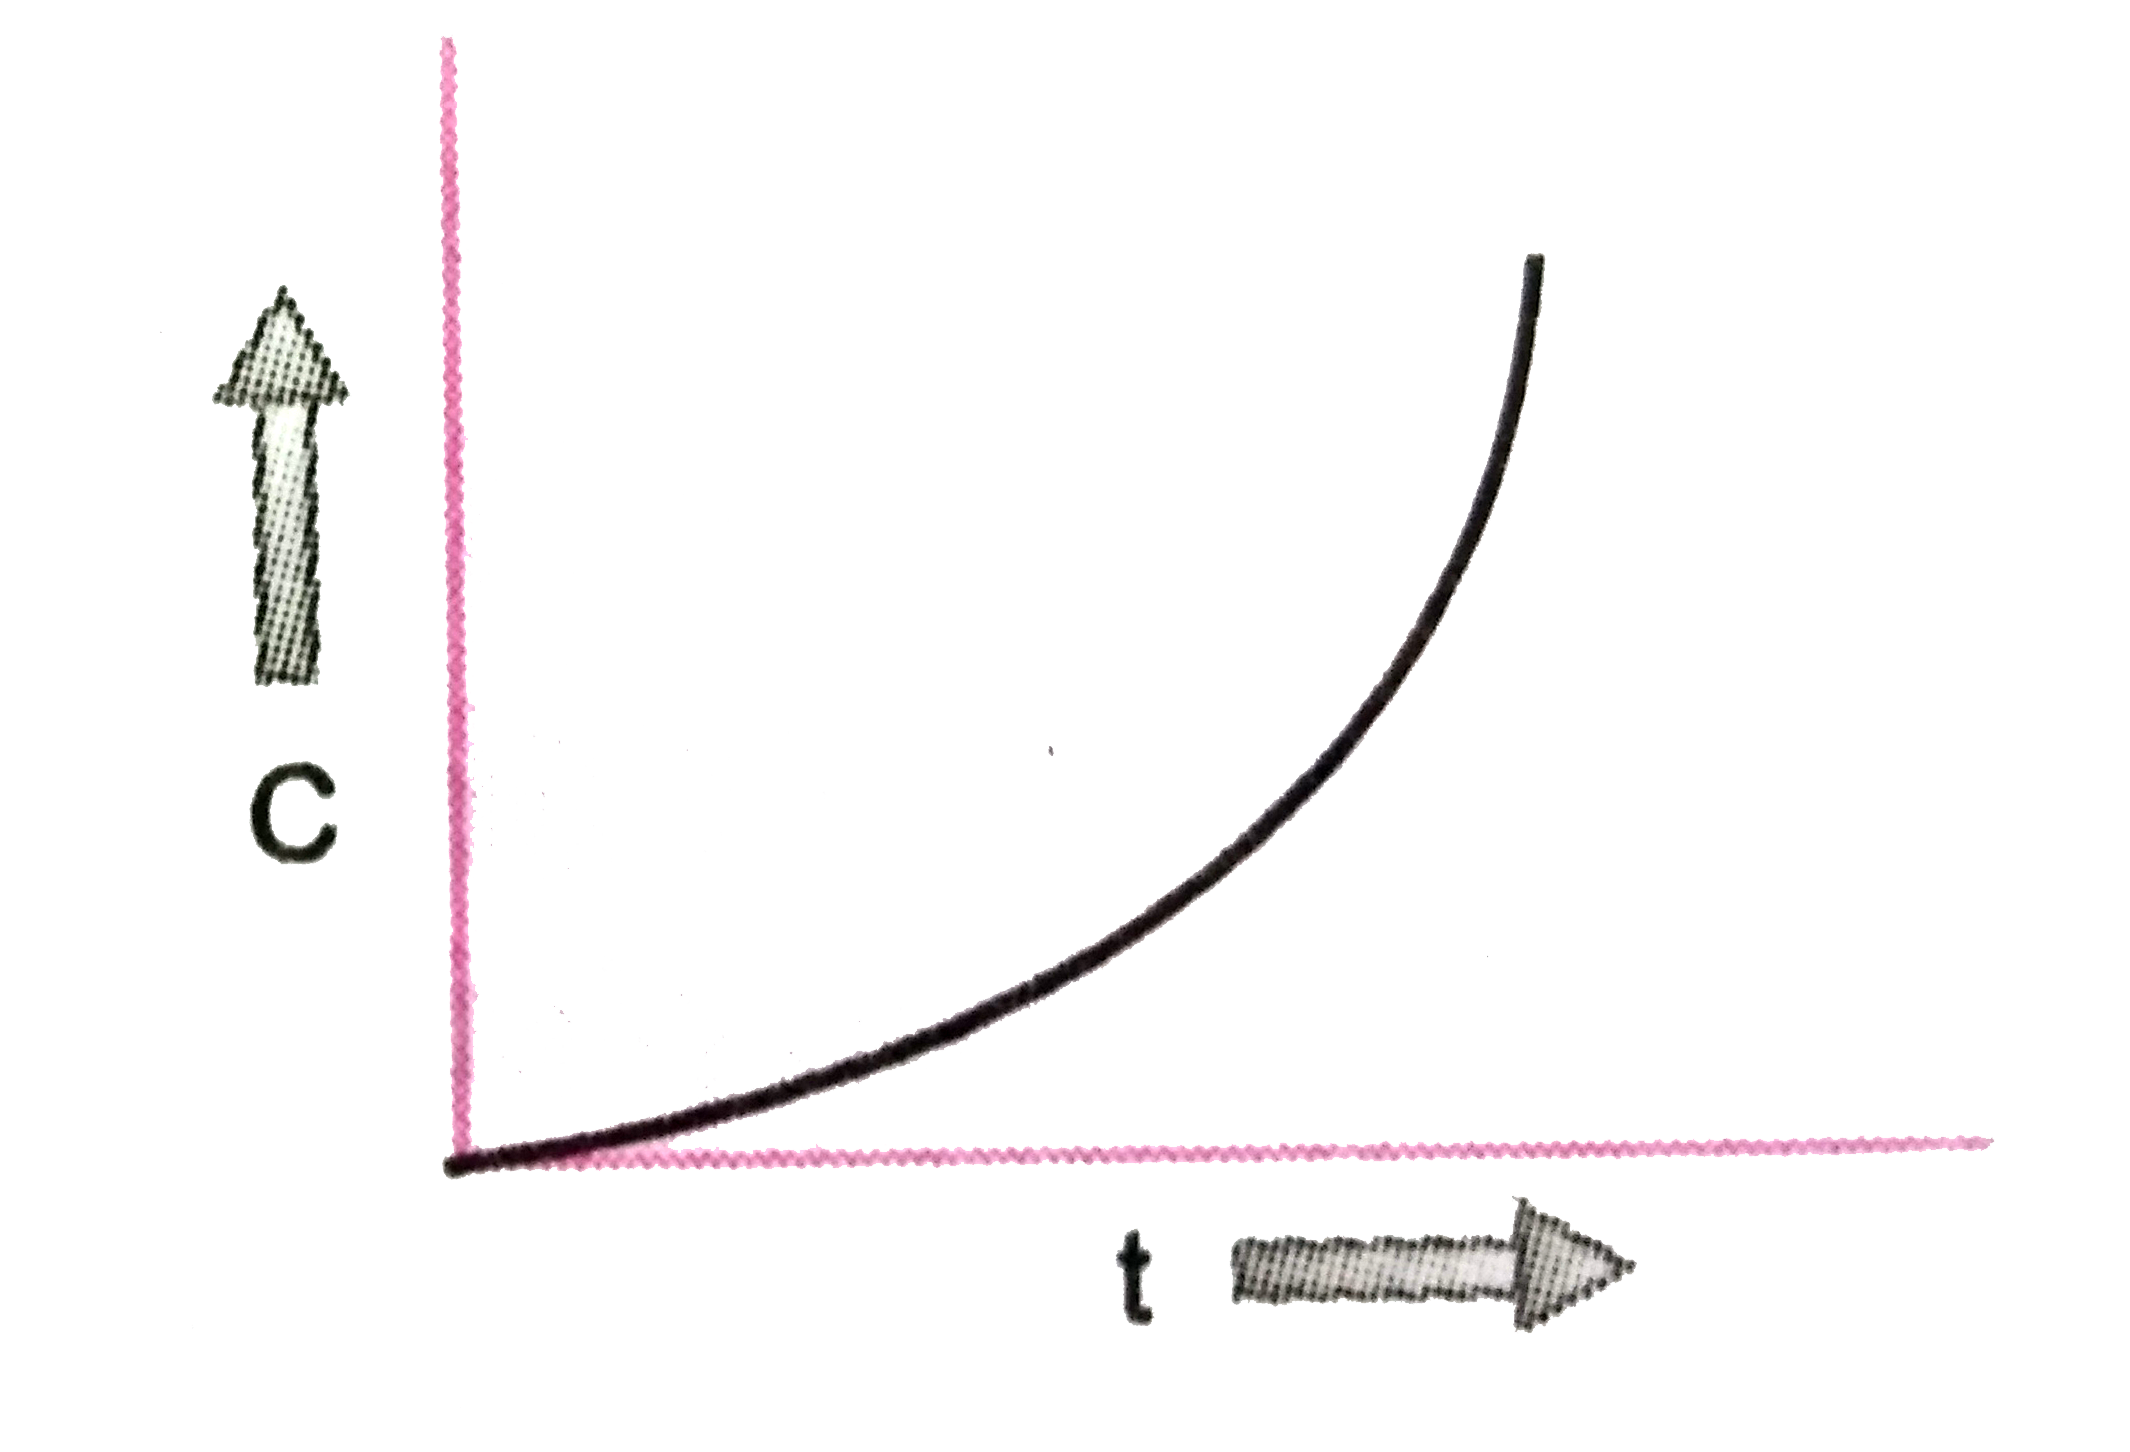
What is the value of slope of graph of concentration of R versus time for zero order reaction?
A
K2.303R
B
−Ea2.303
C
−K
D
−Ea2.303R
Text Solution
The correct Answer is:D
|
Topper's Solved these Questions
- CHEMICAL KINETICSBOOK - KUMAR PRAKASHANCHAPTER - CHEMICAL KINETICSEXERCISE - Section-E(MCQs asked in JEE/NEET/AIEEE)
34 Videos
- BOARD EXAM QUESTION PAPER MARCH - 2020 BOOK - KUMAR PRAKASHANCHAPTER - BOARD EXAM QUESTION PAPER MARCH - 2020 EXERCISE - PART -B
23 Videos
- CHEMISTRY IN EVERYDAY LIFEBOOK - KUMAR PRAKASHANCHAPTER - CHEMISTRY IN EVERYDAY LIFEEXERCISE - SECTION - E (MCQs ASKED IN GUJCET/BOARD EXAM)
37 Videos
Similar Questions
Knowledge Check
The plote between concentration versus time for a zero order reaction is represented by :
A B
B C
C D
D
The plote between concentration versus time for a zero order reaction is represented by :
A B
B C
C D
D
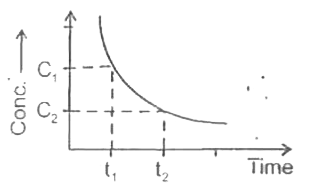
The graph plotted between concentration versus time
 AIt gives rate of disappearance of reactantBRate =(d[C2−C1)])t2−t1CBoth (1) & (2)DIt predicts the order of reaction
The graph plotted between concentration versus time

View SolutionThe plote between concentration versus time for a zero order reaction is represented by :
View SolutionPlot the graph of t t1/2 vs concentration for first order and zero order reaction.
View SolutionThe plote between concentration versus time for a zero order reaction is represented by :
View SolutionAssertion (A) : In zero order reaction, the concenration of reactants is reduced to zero after its half life.
Reason (R) : The concentration-time graph for zero order reactions is a straight line.
View Solution
