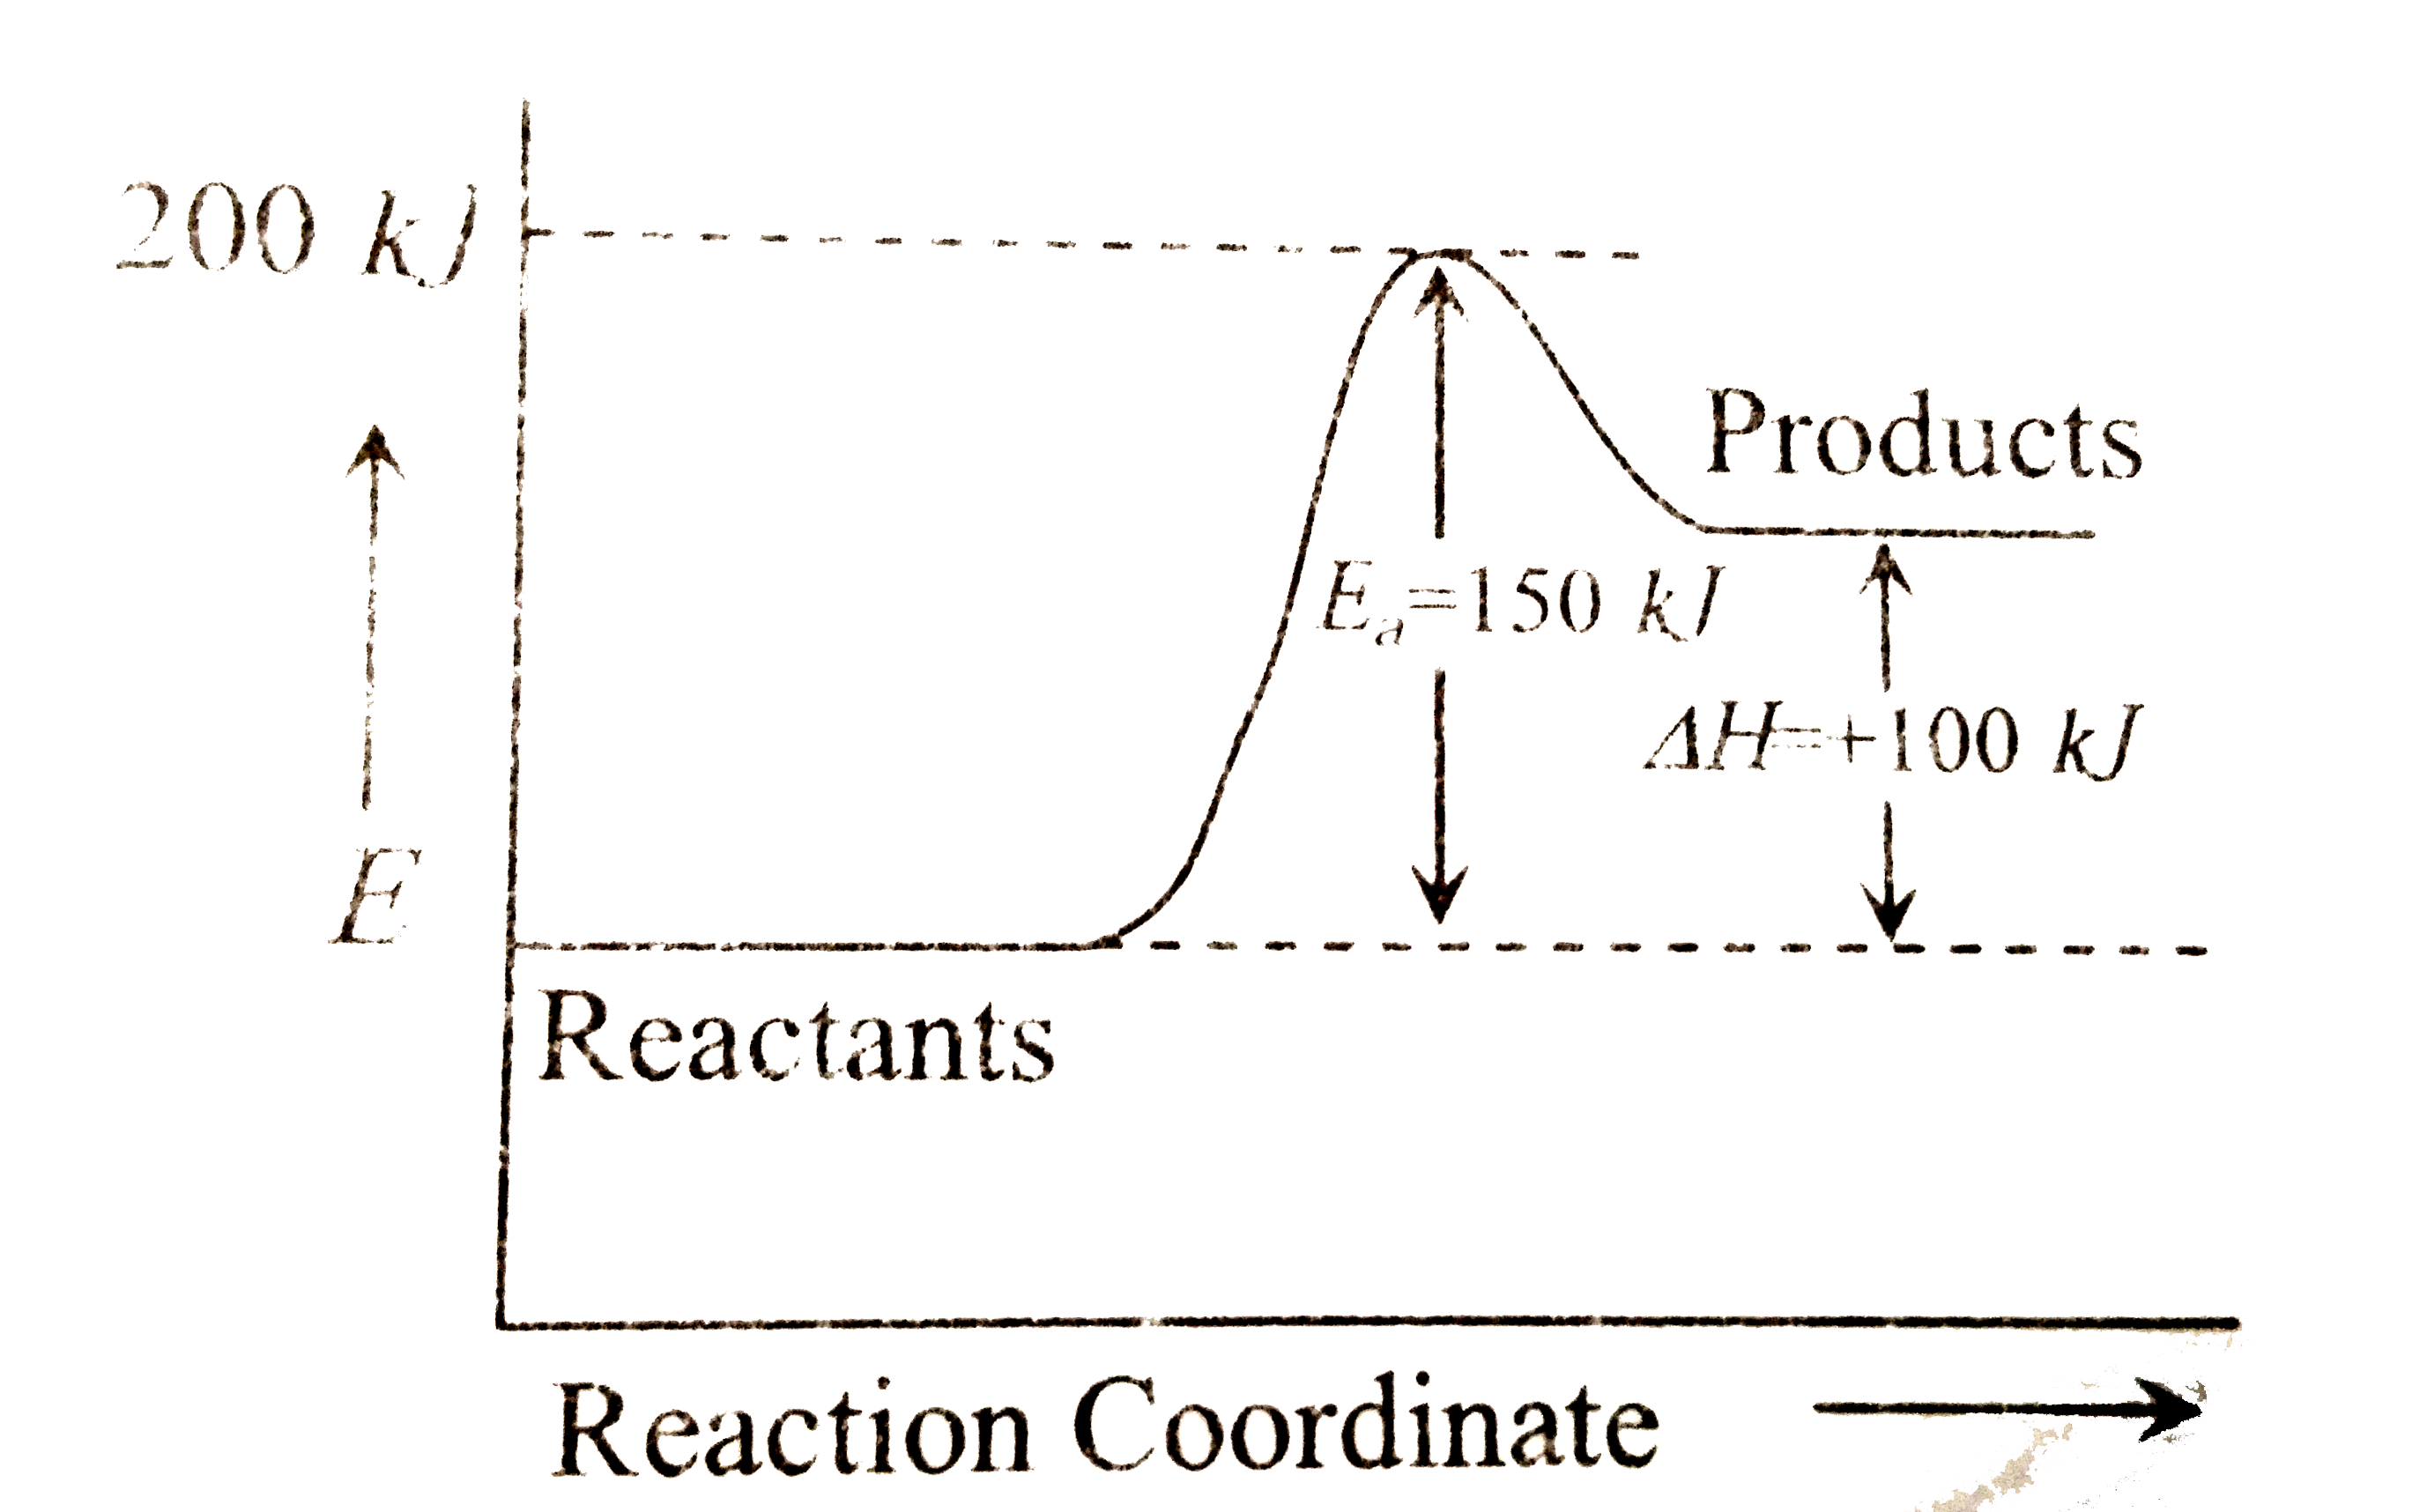
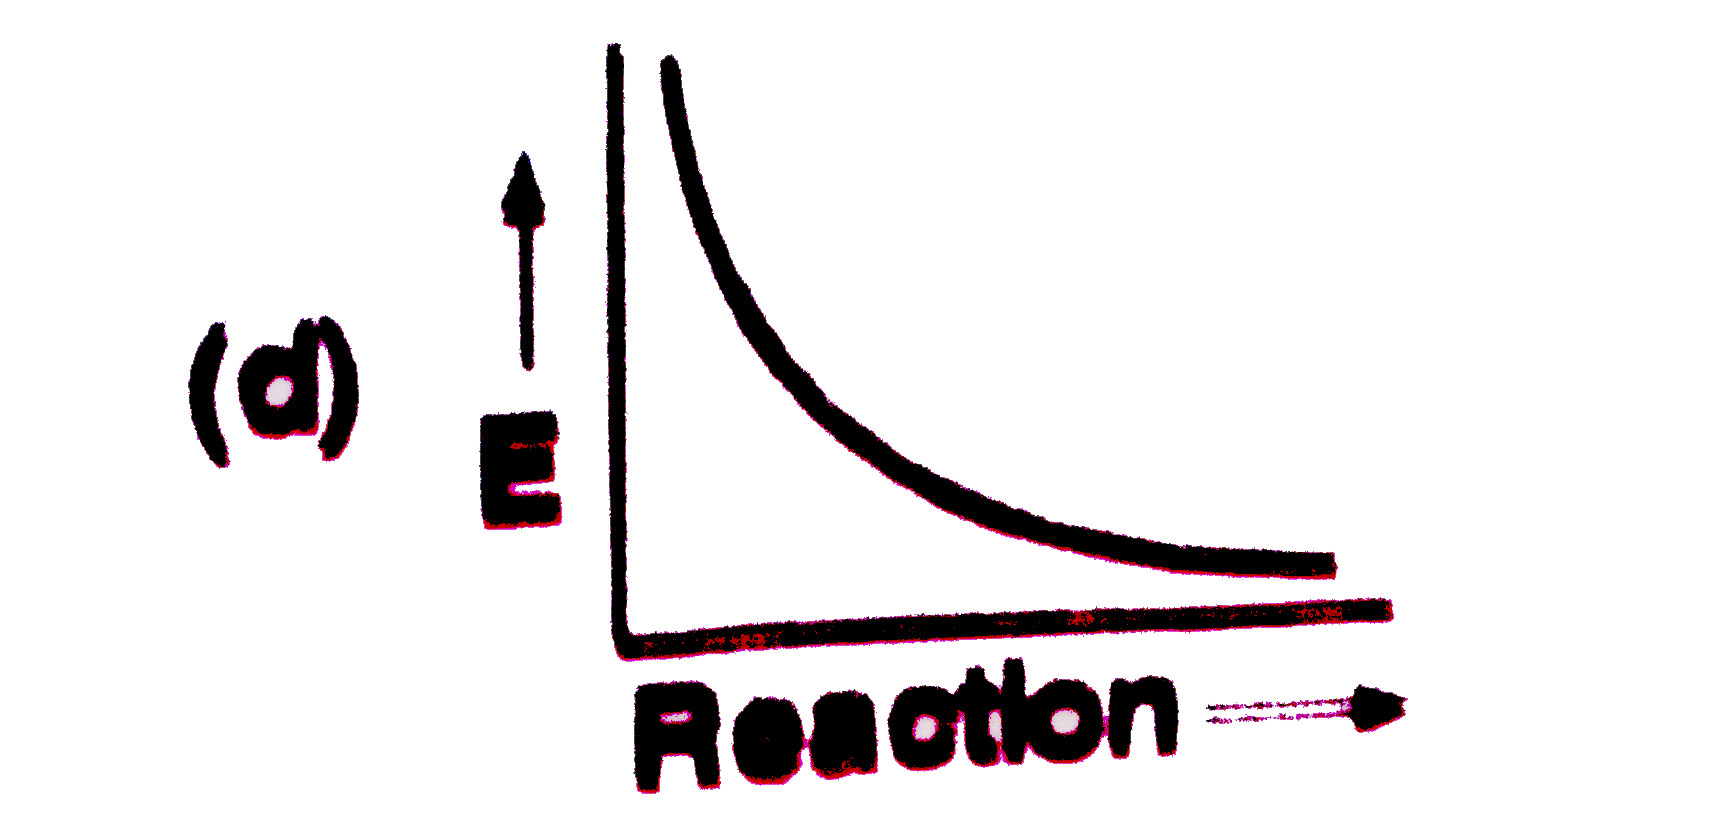
Which graph shows zero activation energy ?
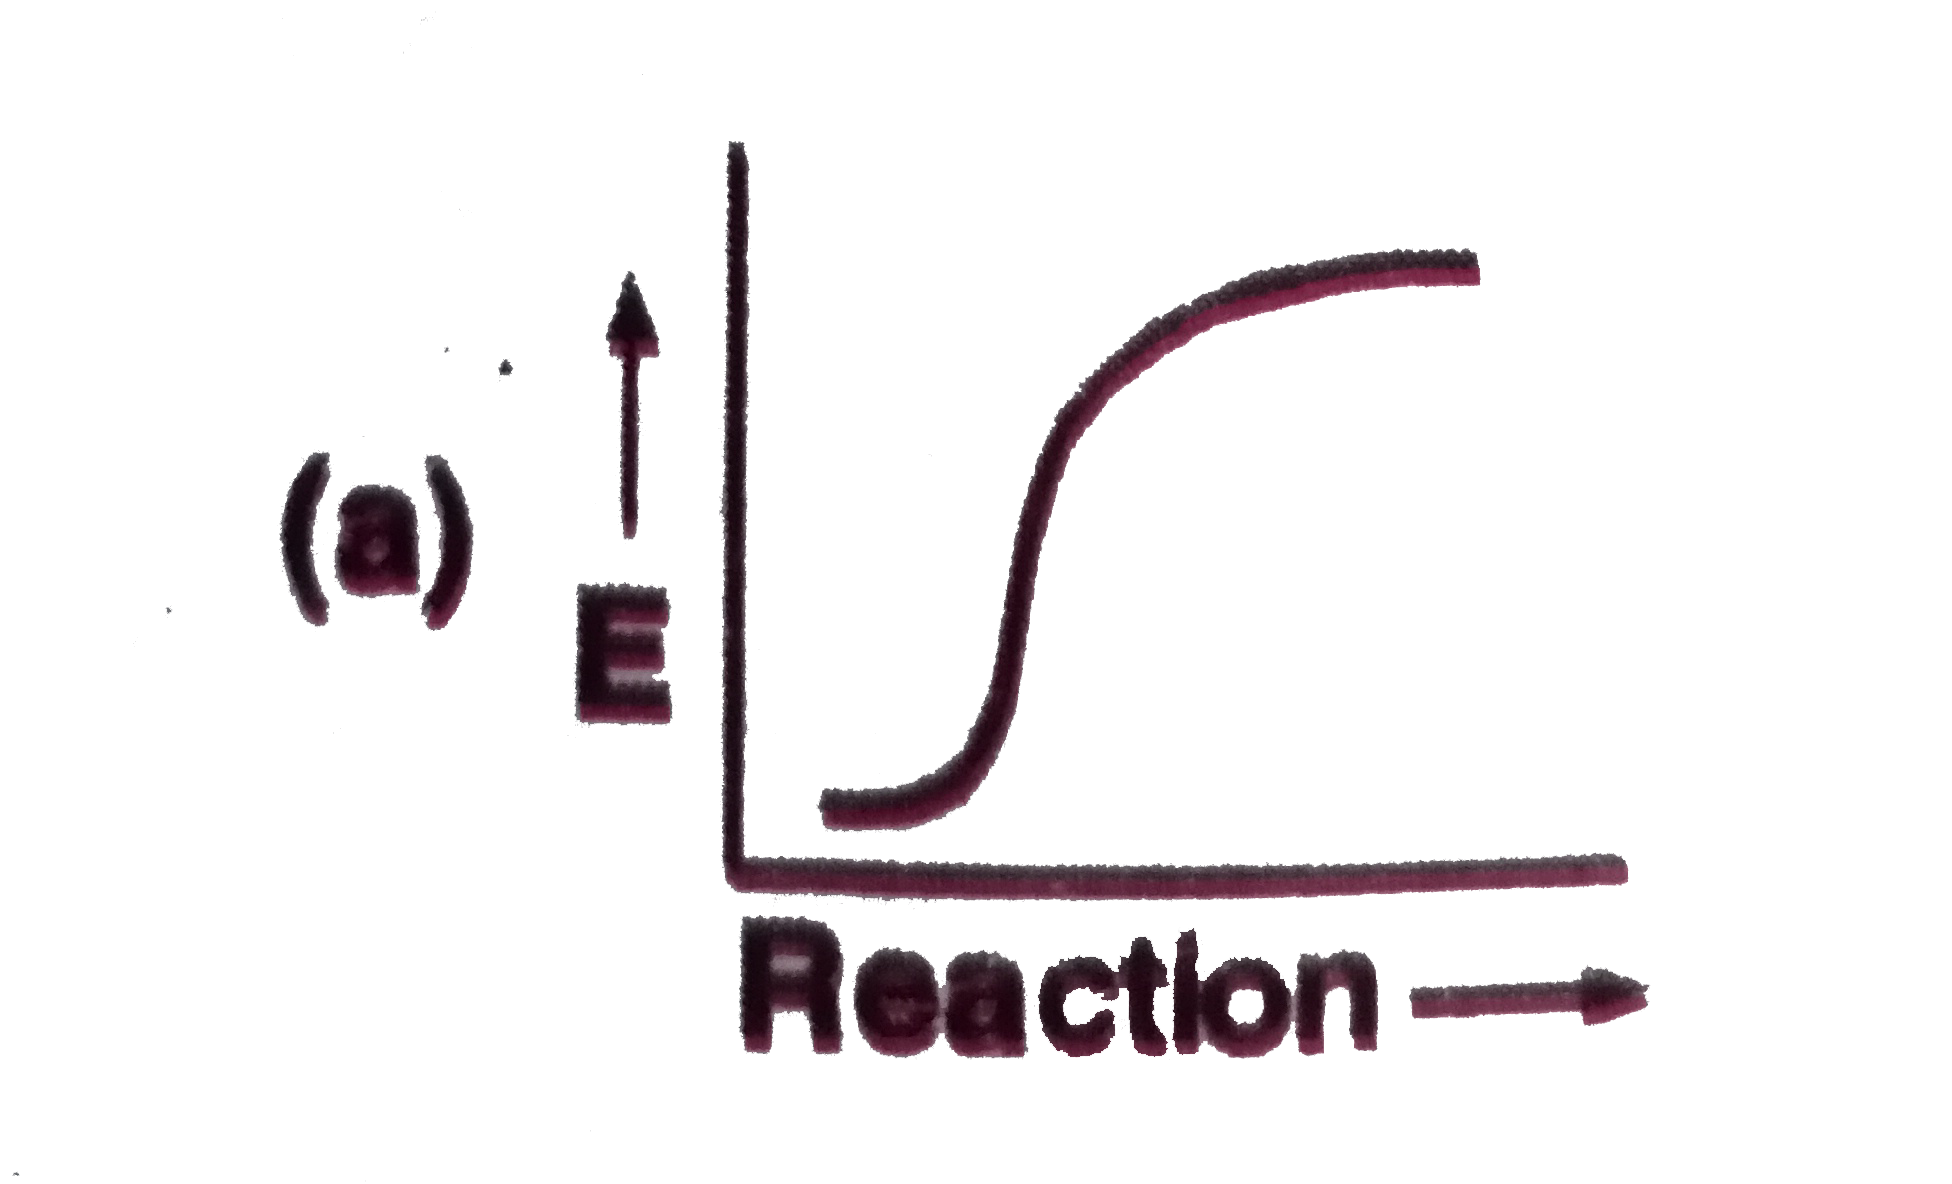
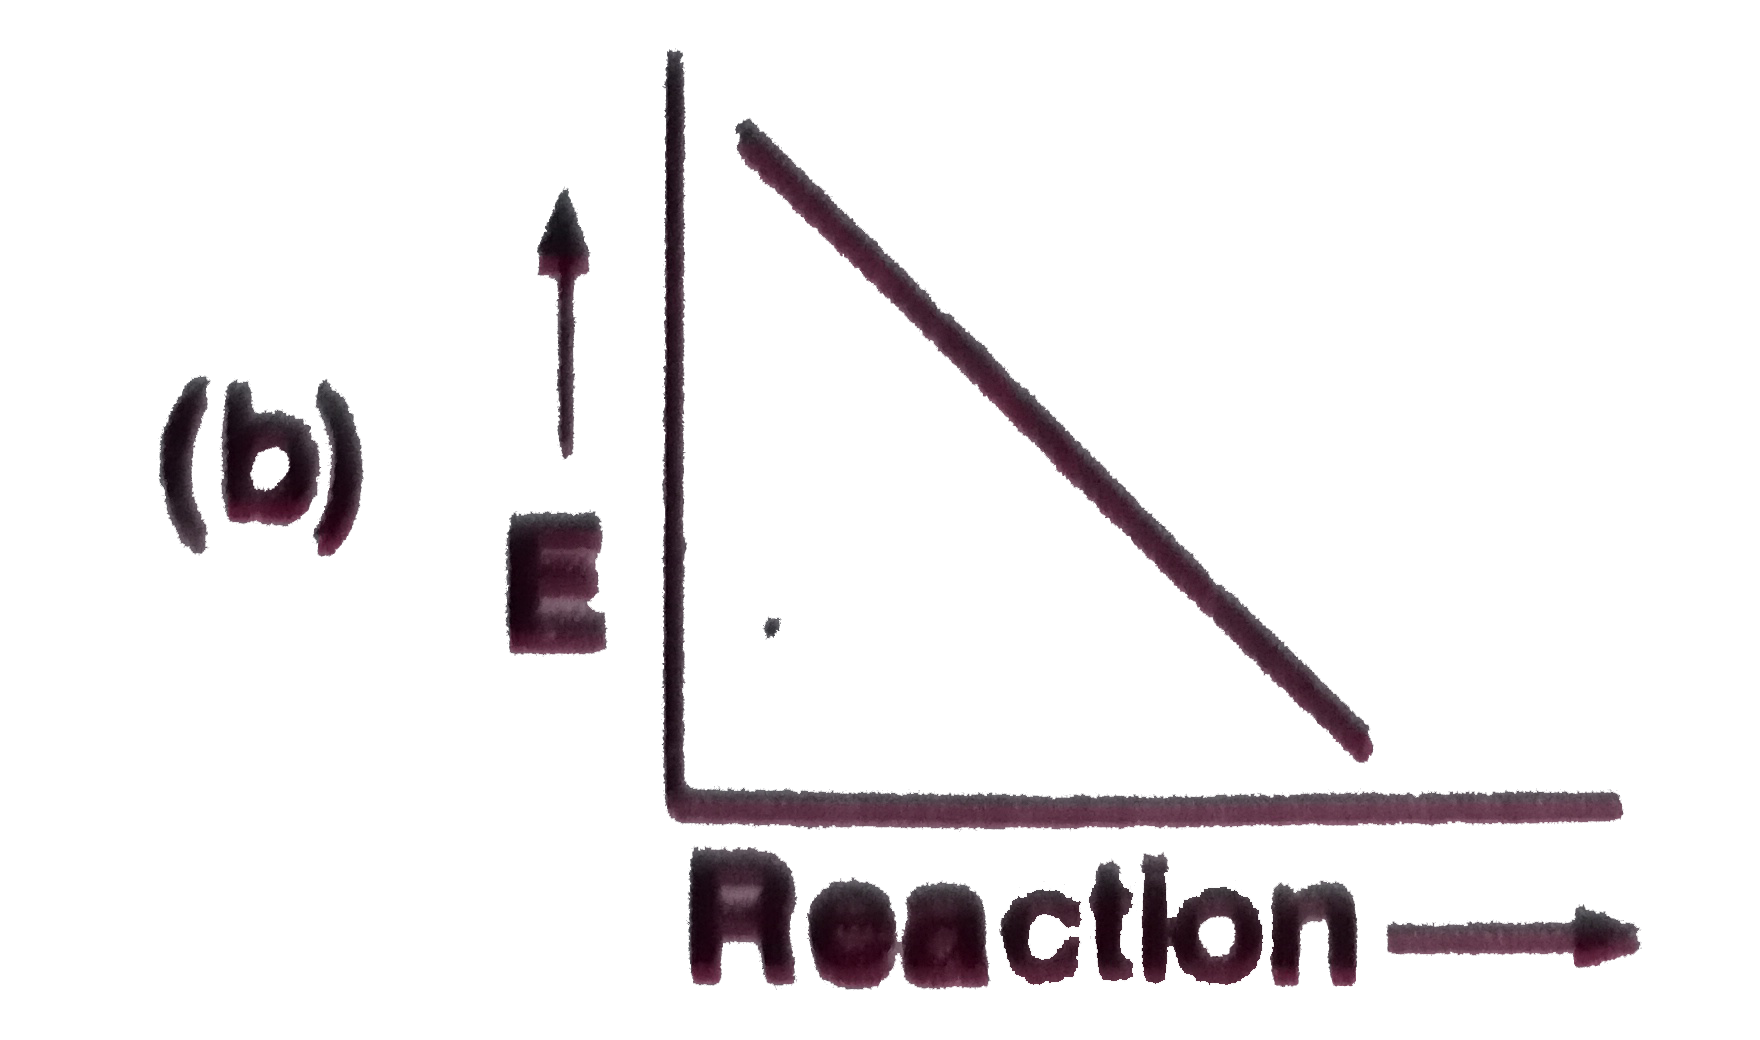
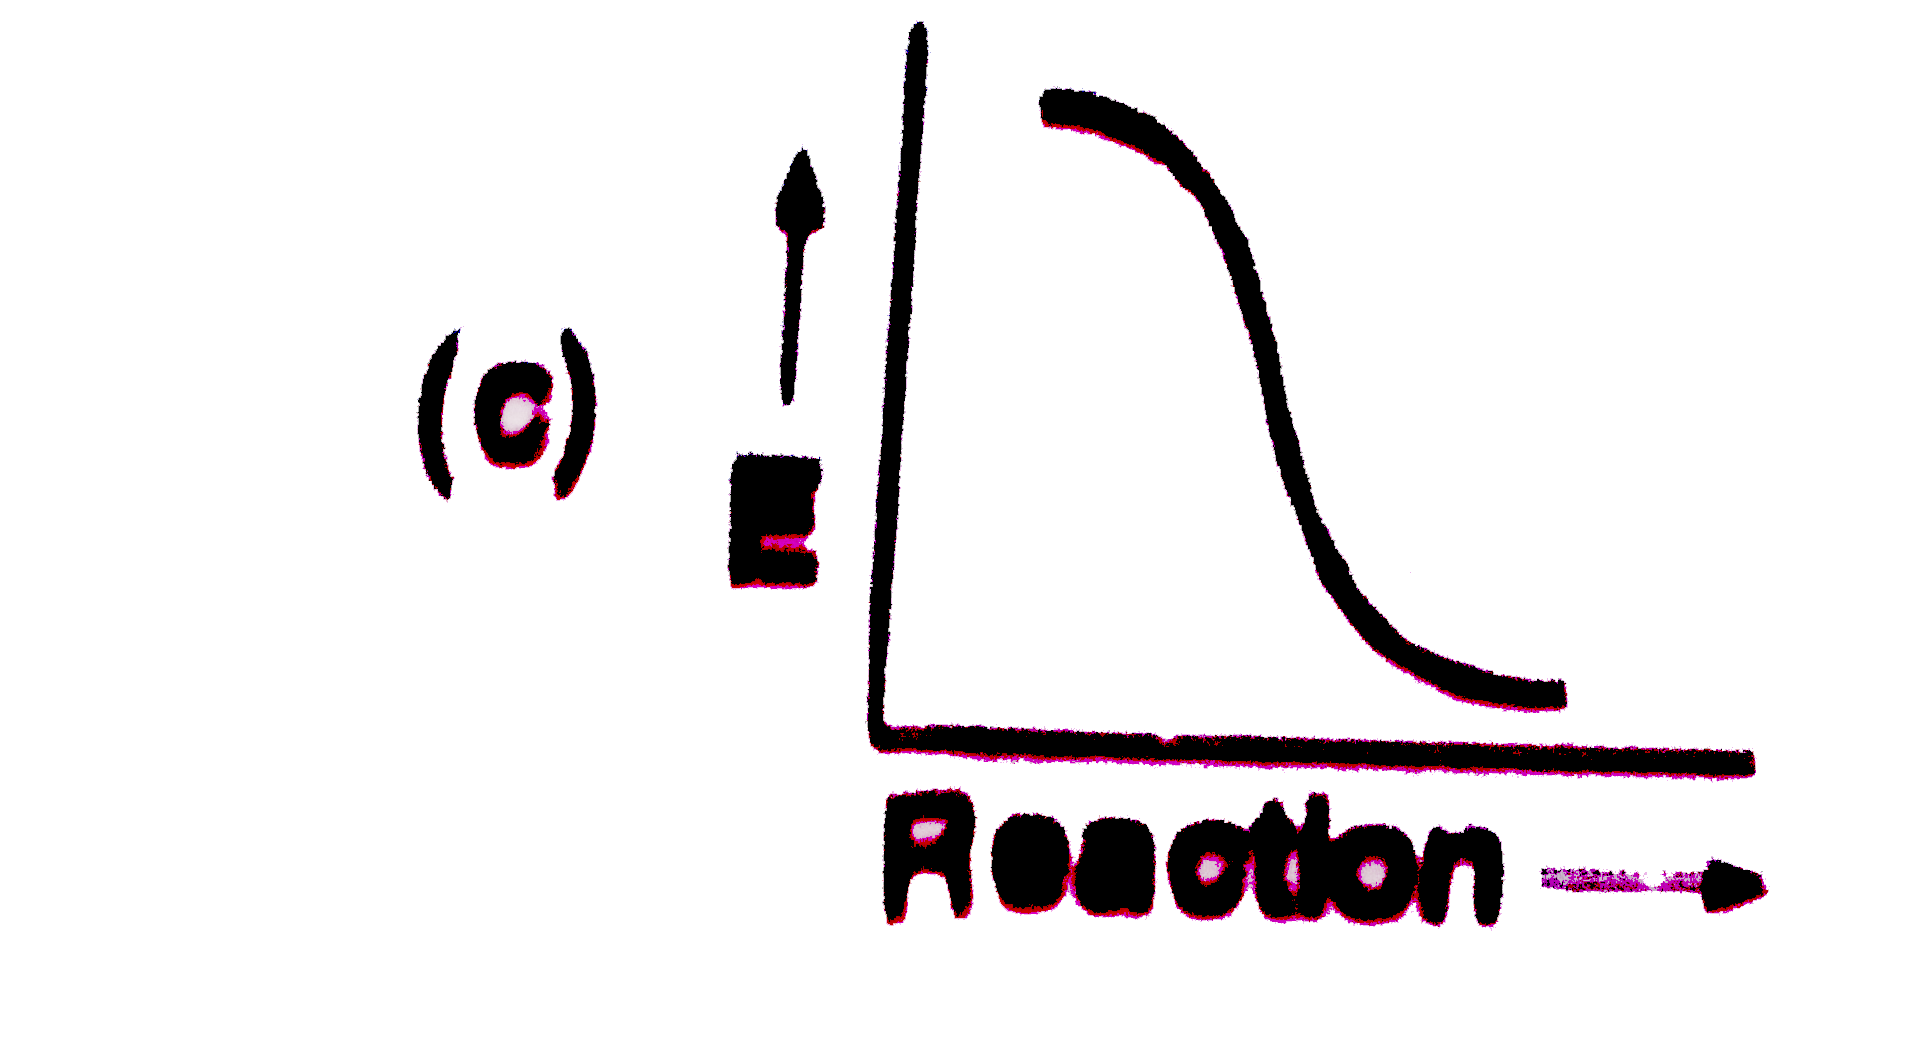
The correct Answer is:C
To determine which graph shows zero activation energy, we need to understand the concept of activation energy and how it is represented graphically.
1. Understand Activation Energy:
Activation energy (Ea) is the minimum energy required for a chemical reaction to occur. It is represented as the energy difference between the reactants and the transition state.
2. Graph Representation:
In a typical energy versus reaction progress graph:
- The x-axis represents the reaction progress.
- The y-axis represents the energy of the system.
- The reactants are at a certain energy level, and the transition state is at a higher energy level, creating an energy barrier (activation energy).
3. Identify Characteristics of Zero Activation Energy:
- For a reaction to have zero activation energy, there should be no energy barrier between the reactants and the transition state.
- This means that the energy level of the reactants and the transition state must be the same.
4. Analyze the Given Graph Options:
- Option 1: Shows a clear energy difference between reactants and transition state, indicating activation energy.
- Option 2: Similar to Option 1, shows an energy barrier.
- Option 3: Shows the reactants and transition state at the same energy level, indicating that the reaction can occur spontaneously without any energy input. This represents zero activation energy.
- Option 4: Similar to Options 1 and 2, shows an energy barrier.
5. Conclusion:
Based on the analysis, Option 3 is the graph that shows zero activation energy because it indicates that the reactants and transition state are at the same energy level, allowing the reaction to proceed spontaneously.
Final Answer:
The graph that shows zero activation energy is Option 3.
Activation energy (Ea) is the minimum energy required for a chemical reaction to occur. It is represented as the energy difference between the reactants and the transition state.
In a typical energy versus reaction progress graph:
- The x-axis represents the reaction progress.
- The y-axis represents the energy of the system.
- The reactants are at a certain energy level, and the transition state is at a higher energy level, creating an energy barrier (activation energy).
- For a reaction to have zero activation energy, there should be no energy barrier between the reactants and the transition state.
- This means that the energy level of the reactants and the transition state must be the same.
- Option 1: Shows a clear energy difference between reactants and transition state, indicating activation energy.
- Option 2: Similar to Option 1, shows an energy barrier.
- Option 3: Shows the reactants and transition state at the same energy level, indicating that the reaction can occur spontaneously without any energy input. This represents zero activation energy.
- Option 4: Similar to Options 1 and 2, shows an energy barrier.
Based on the analysis, Option 3 is the graph that shows zero activation energy because it indicates that the reactants and transition state are at the same energy level, allowing the reaction to proceed spontaneously.
The graph that shows zero activation energy is Option 3.
Topper's Solved these Questions
- CHEMICAL KINETICSBOOK - OP TANDONCHAPTER - CHEMICAL KINETICSEXERCISE - OBJECTIVE QUESTIONS (LEVEL-B) SET I
48 Videos
- CHEMICAL KINETICSBOOK - OP TANDONCHAPTER - CHEMICAL KINETICSEXERCISE - OBJECTIVE QUESTIONS (LEVEL-B) SET II
13 Videos
- CHEMICAL KINETICSBOOK - OP TANDONCHAPTER - CHEMICAL KINETICSEXERCISE - PRACTICE PROBLEMS
70 Videos
- CARBOXYLIC ACIDS AND THEIR DERIVATIVESBOOK - OP TANDONCHAPTER - CARBOXYLIC ACIDS AND THEIR DERIVATIVESEXERCISE - Integer
4 Videos
- Chemical Thermodynamics and ThermochemistryBOOK - OP TANDONCHAPTER - Chemical Thermodynamics and ThermochemistryEXERCISE - Self Assessment (Integer type).
3 Videos
Similar Questions
Knowledge Check
In the given graph the activation energy, Ea for the reverse reaction will be

Activation energy for the reverse reaction will beA100 kJ/moleB140 kJ/moleC60 kJ/moleD40 kJ/moleWhich graph shows how the energy E of a photon of light is related to its wavelengths (λ)?
A B
B C
C D
D
Study the following graph of the concept of activation energy given below. Select the correct option for stages labeled A to D
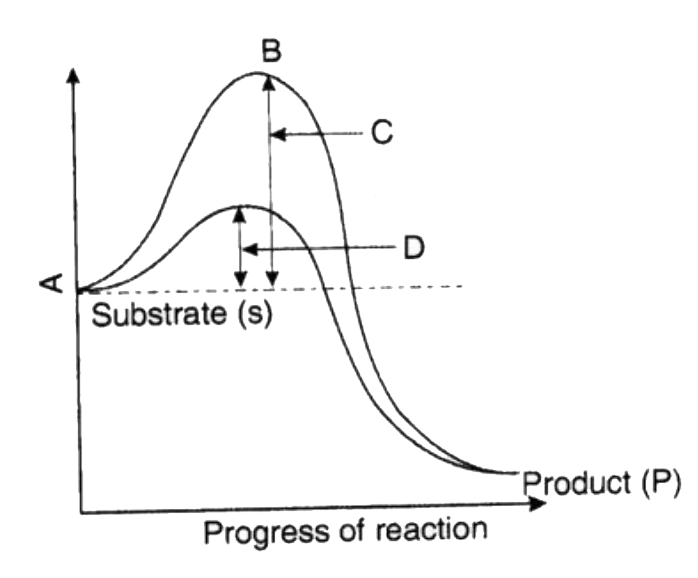 AABCDTransition statePotential energyActivation energy without enzymeActivation energy with enzymeBABCDkinetic energyPotential energyActivation energy without enzymeActivation energy with enzymeCABCDkinetic energyTransition energyActivation energy without enzymeActivation energy with enzymeDABCDPotential energyTransition energyActivation energy without enzymeActivation energy with enzyme
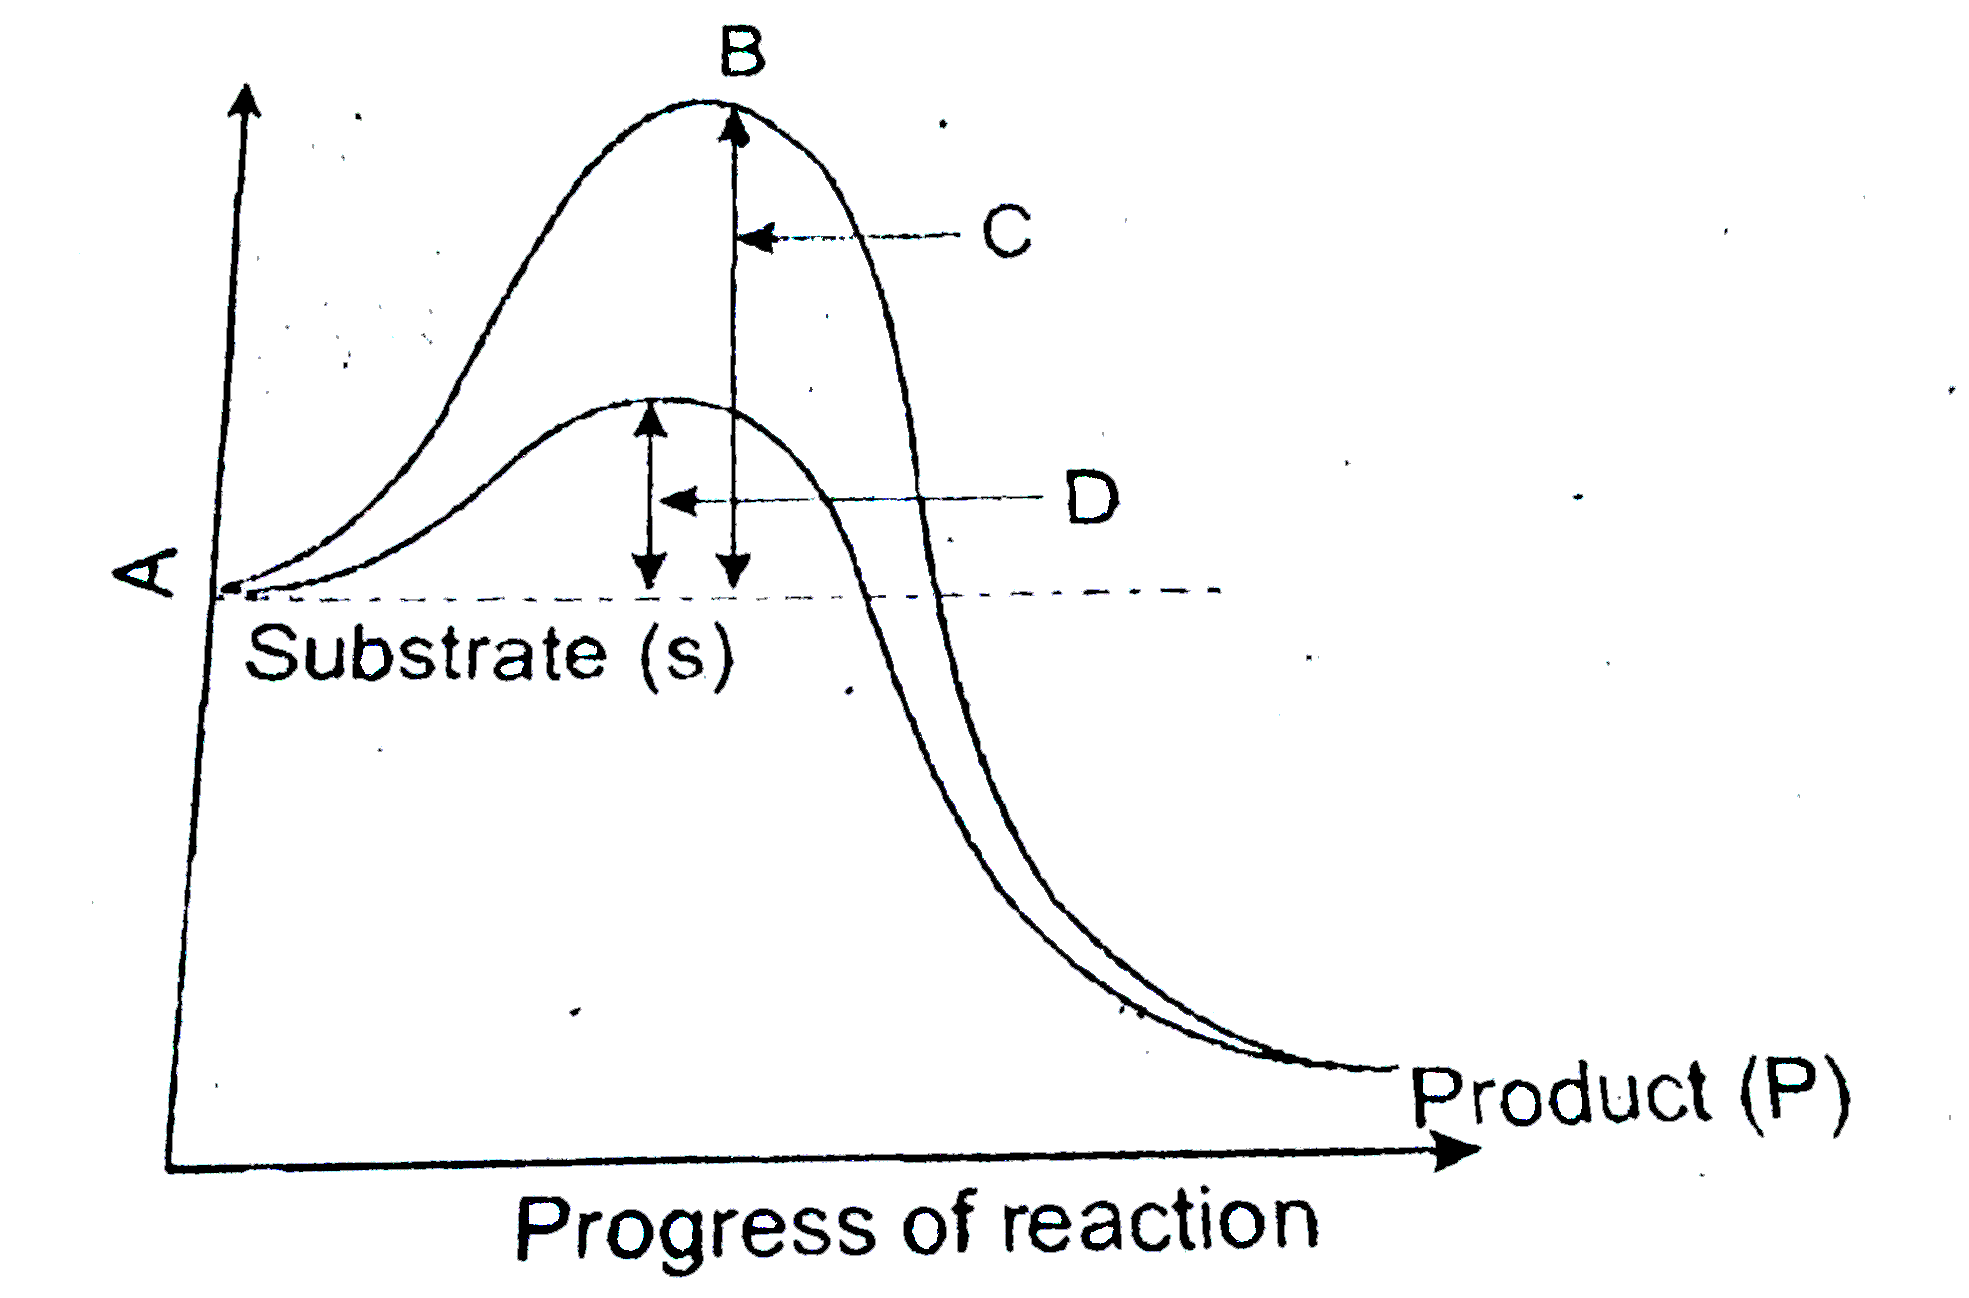
Study the following graph of concept of activation energy given below. Select the correct option for stages labelled A to D.
View SolutionWhich of the following reactions has Zero activation energy?
View SolutionCan a reaction have zero activation energy ?
View SolutionWhich graph shows how the energy E of a photon of light is related to its wavelengths (λ)?
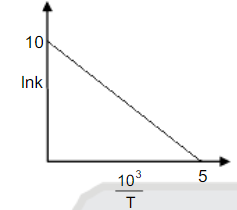
View SolutionUsing following graph find activation energy (in KJ)
View Solution

