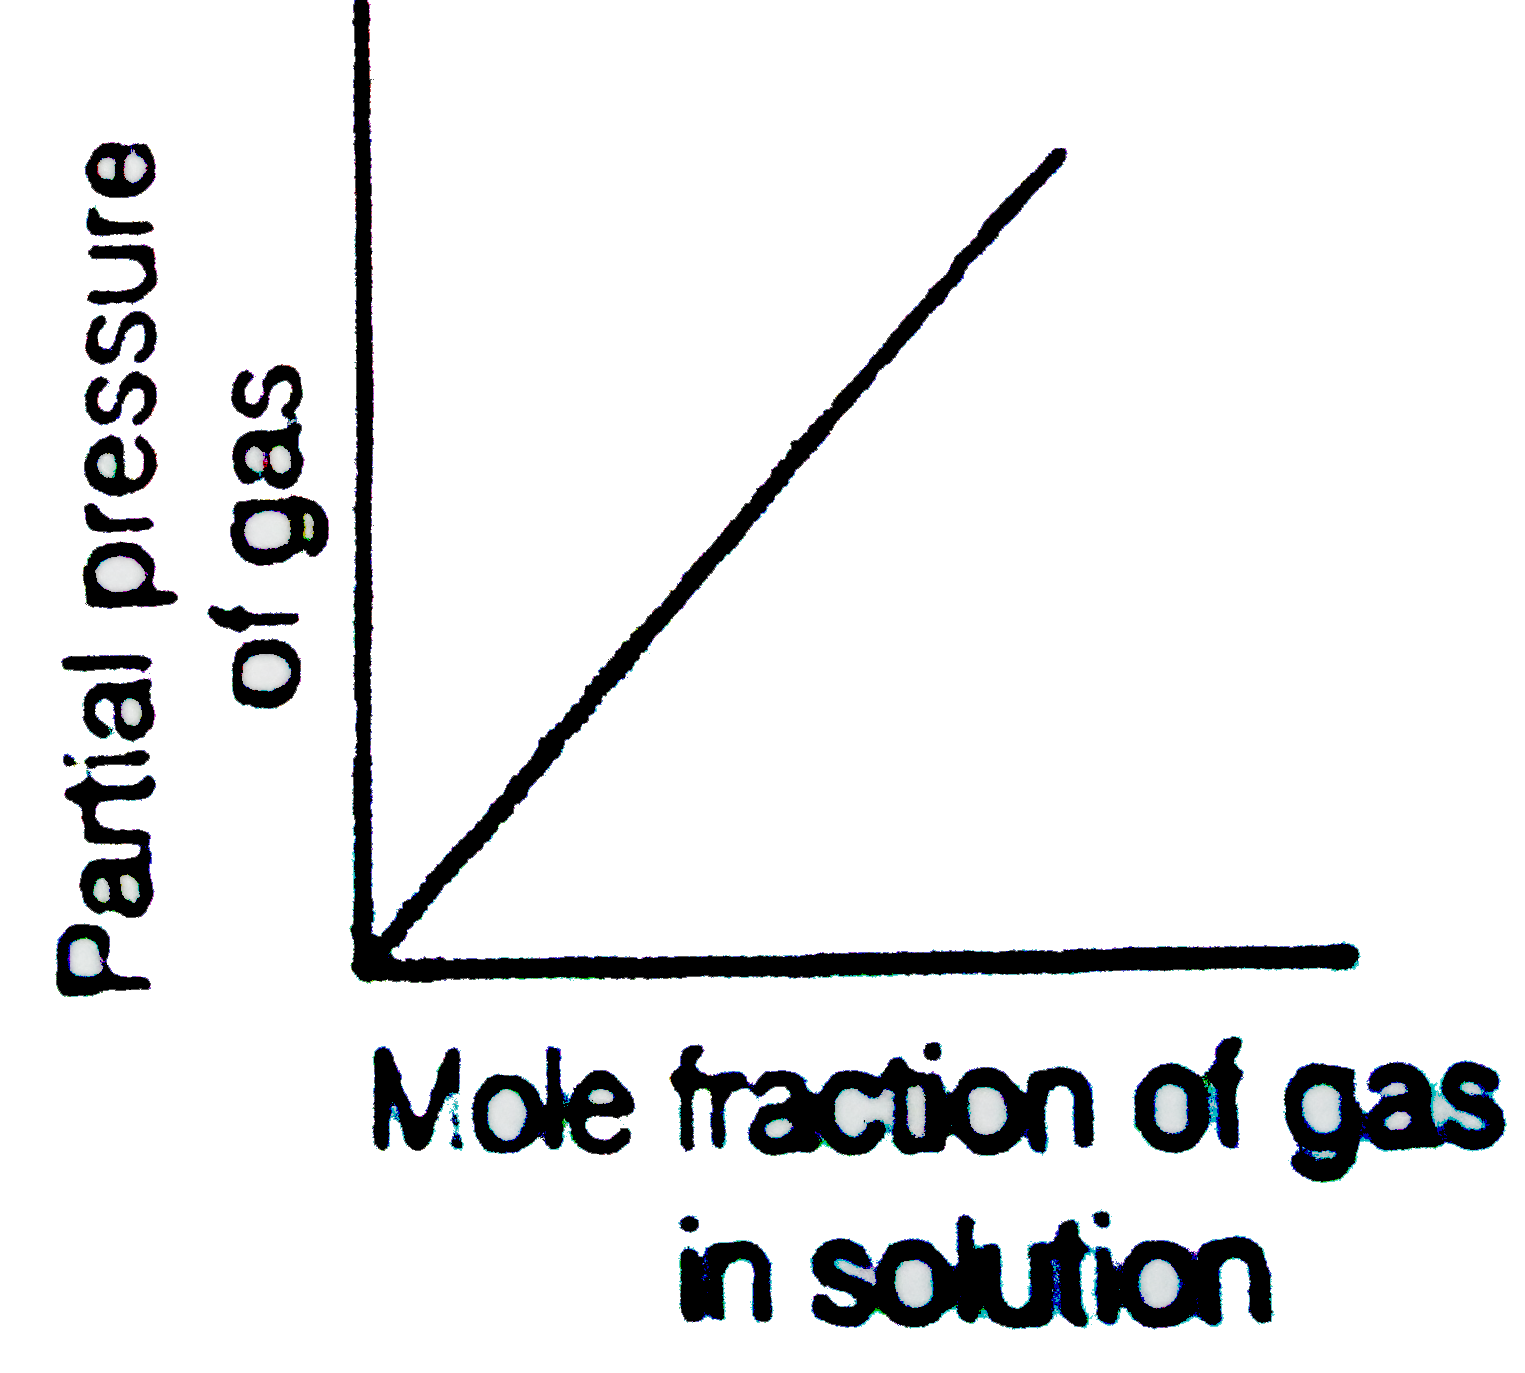
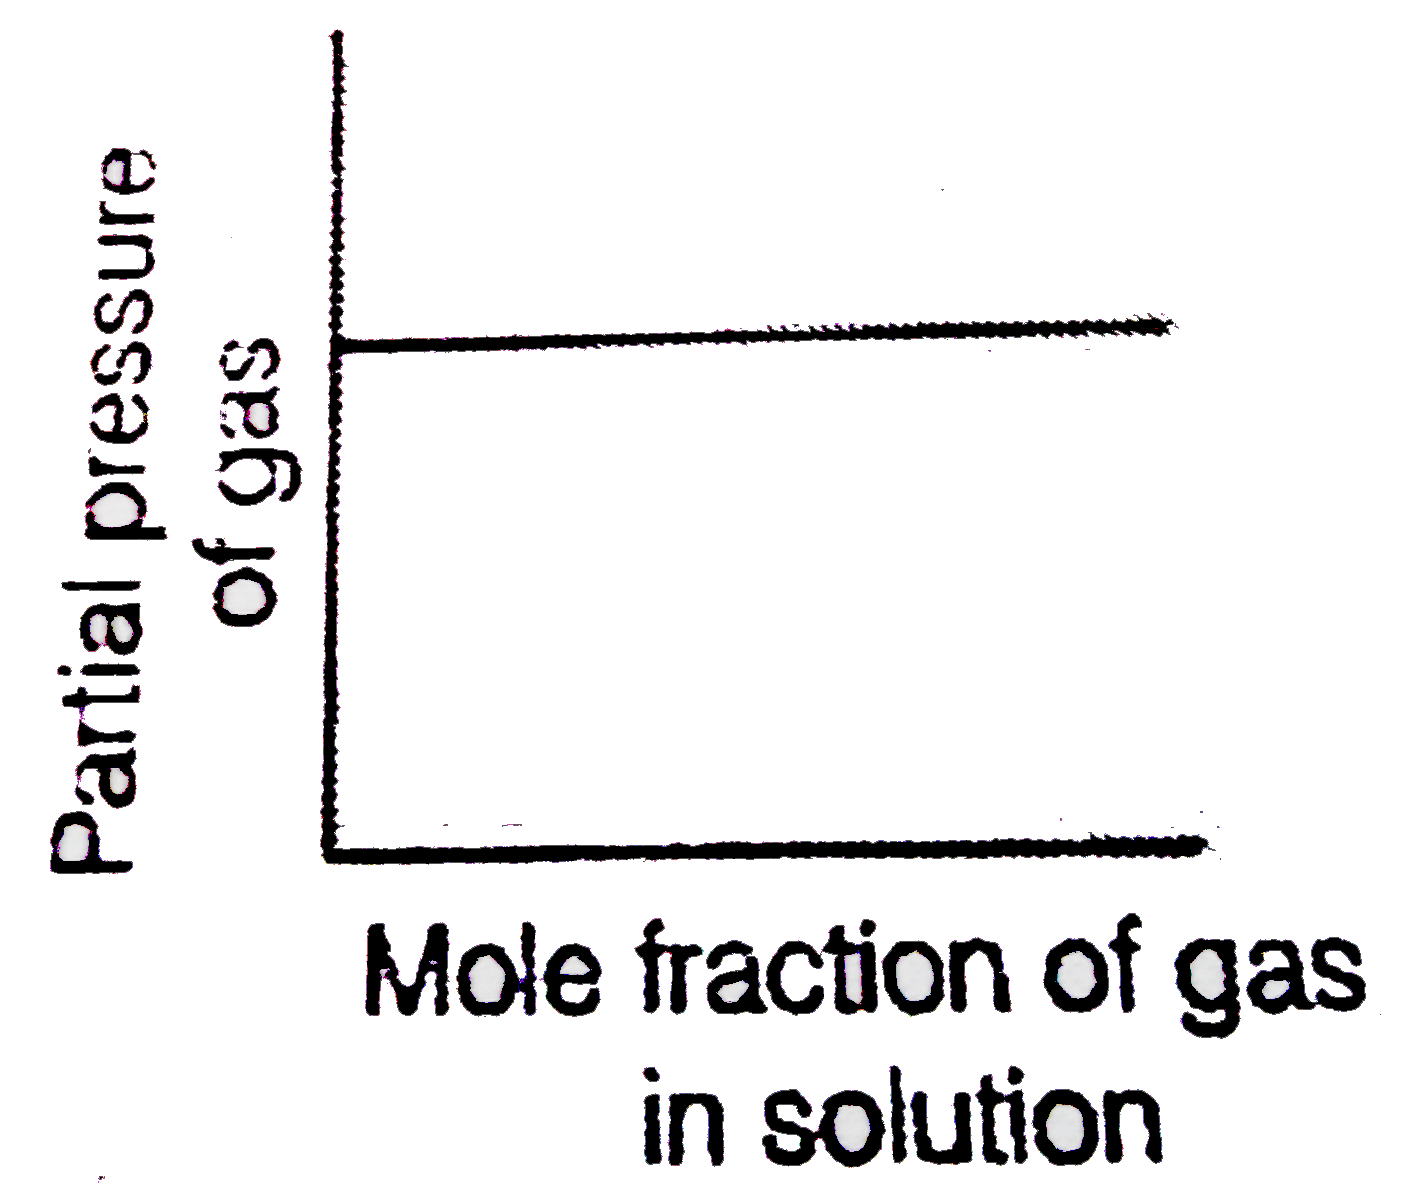
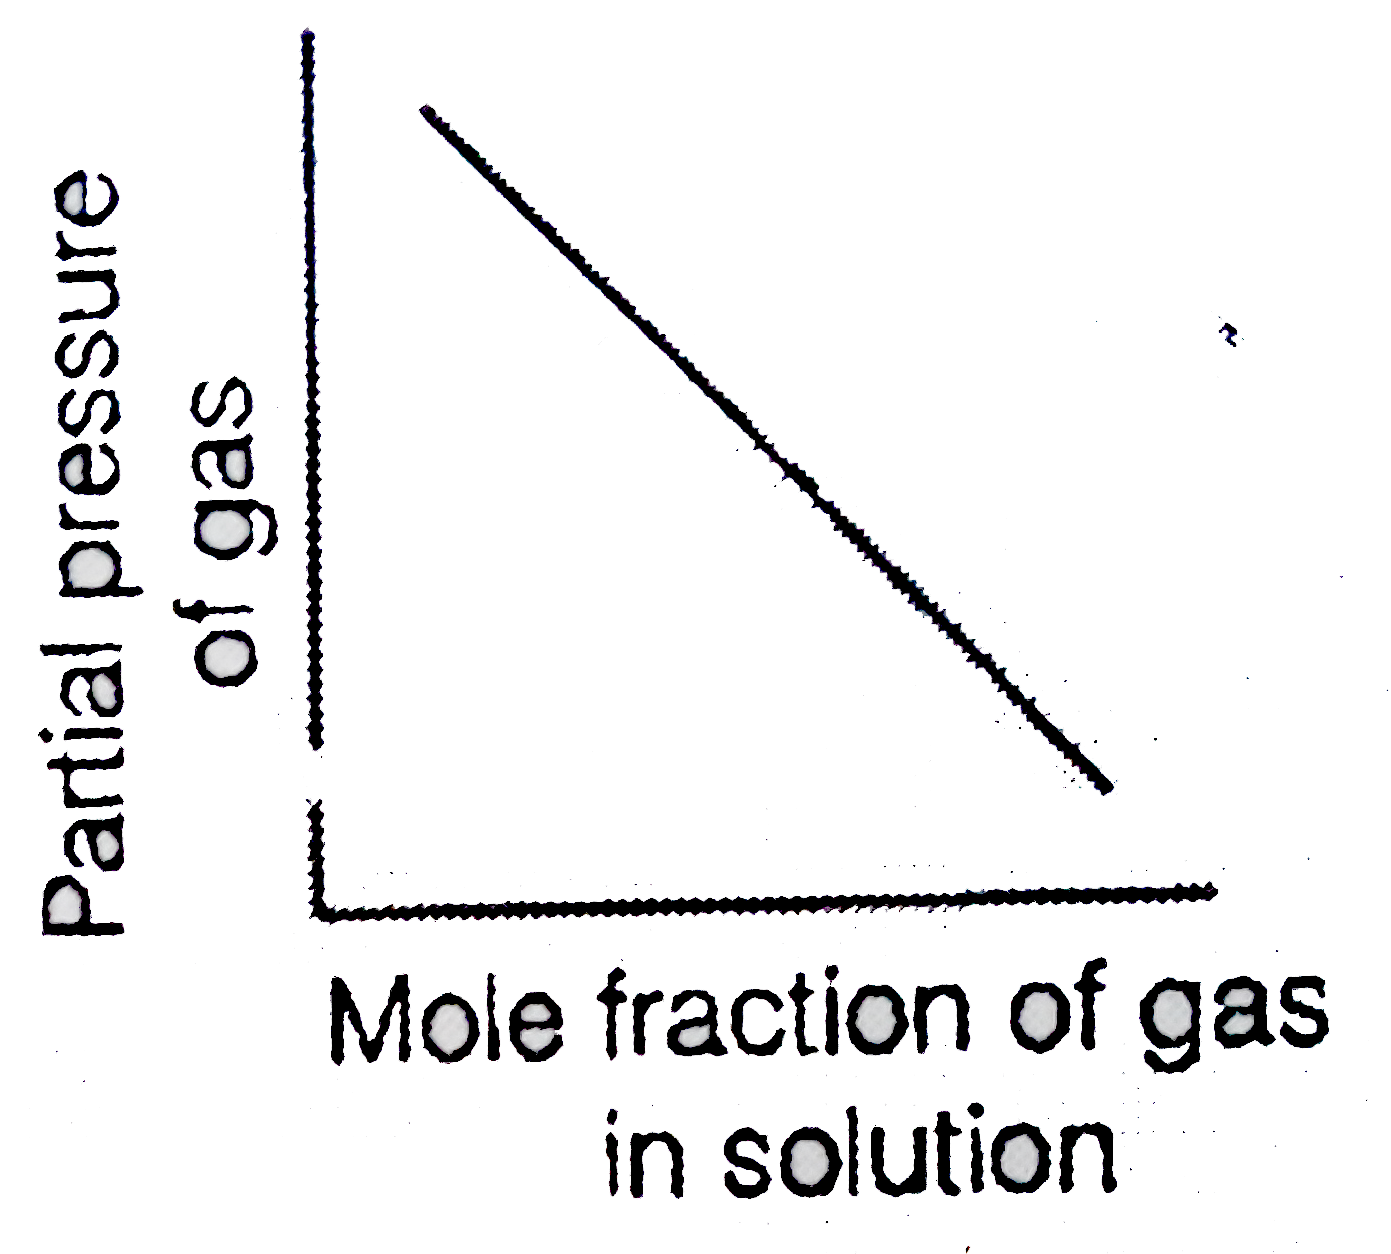
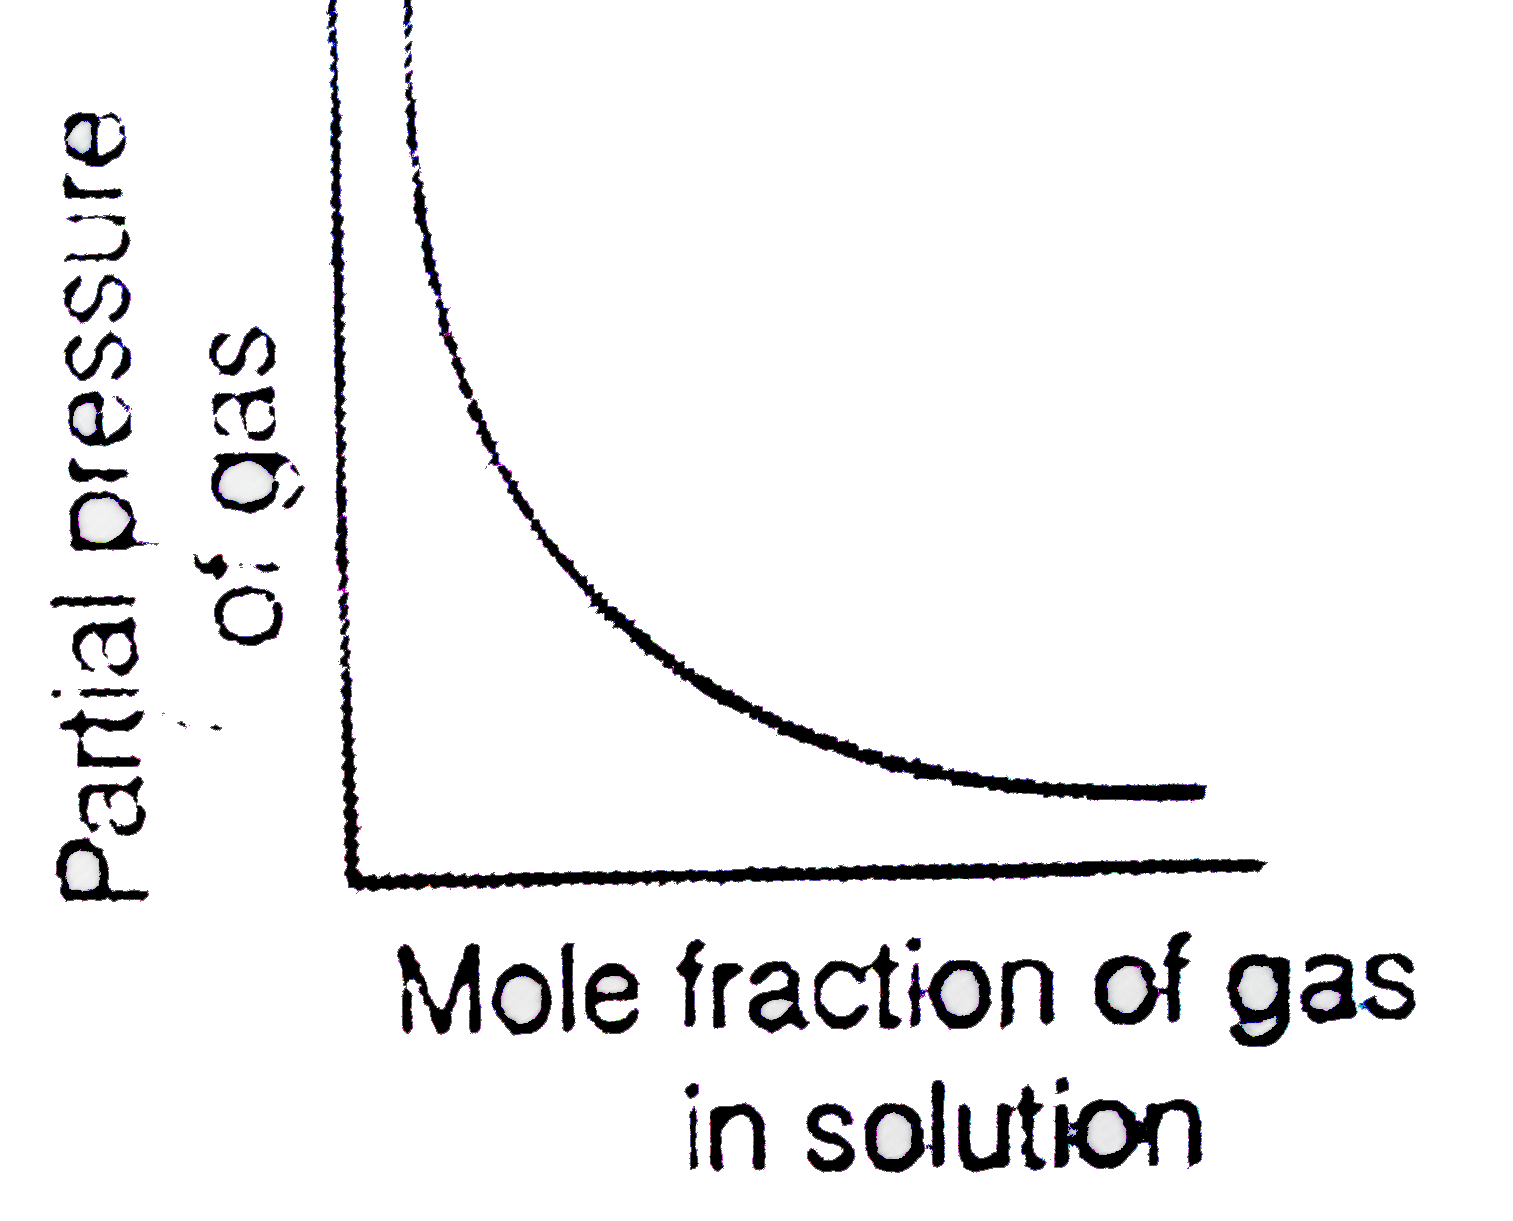
Which of the following curves represent the Henry's law
The correct Answer is:a
To determine which of the given curves represents Henry's Law, we can follow these steps:
Step 1: Understand Henry's Law
Henry's Law states that the partial pressure of a gas (P) is directly proportional to the mole fraction of that gas (X) in a solution. This relationship can be expressed mathematically as:
P=kH⋅X
where kH is the Henry's Law constant.
Step 2: Identify the Variables
In the context of the graph provided:
- The x-axis represents the mole fraction of the gas in the solution (X).
- The y-axis represents the partial pressure of the gas (P).
Step 3: Analyze the Relationship
Since P is directly proportional to X, we can rewrite the equation as:
P=kH⋅X
This indicates that as the mole fraction (X) increases, the partial pressure (P) also increases linearly.
Step 4: Determine the Graph Characteristics
A linear relationship between P and X means that the graph will be a straight line. The equation of a straight line can be expressed as:
y=mx+c
In this case:
- y corresponds to P
- x corresponds to X
- m is the slope, which is positive since kH is a positive constant.
- c is the y-intercept, which is zero in this case because when X=0, P must also be 0 (the line passes through the origin).
Step 5: Conclusion
The correct curve representing Henry's Law will be a straight line that passes through the origin (0,0) on the graph of partial pressure (P) versus mole fraction (X).
Henry's Law states that the partial pressure of a gas (P) is directly proportional to the mole fraction of that gas (X) in a solution. This relationship can be expressed mathematically as:
P=kH⋅X
where kH is the Henry's Law constant.
In the context of the graph provided:
- The x-axis represents the mole fraction of the gas in the solution (X).
- The y-axis represents the partial pressure of the gas (P).
Since P is directly proportional to X, we can rewrite the equation as:
P=kH⋅X
This indicates that as the mole fraction (X) increases, the partial pressure (P) also increases linearly.
A linear relationship between P and X means that the graph will be a straight line. The equation of a straight line can be expressed as:
y=mx+c
In this case:
- y corresponds to P
- x corresponds to X
- m is the slope, which is positive since kH is a positive constant.
- c is the y-intercept, which is zero in this case because when X=0, P must also be 0 (the line passes through the origin).
The correct curve representing Henry's Law will be a straight line that passes through the origin (0,0) on the graph of partial pressure (P) versus mole fraction (X).
Topper's Solved these Questions
Similar Questions
Knowledge Check
Which of the following curves represents the Henry's law ?
A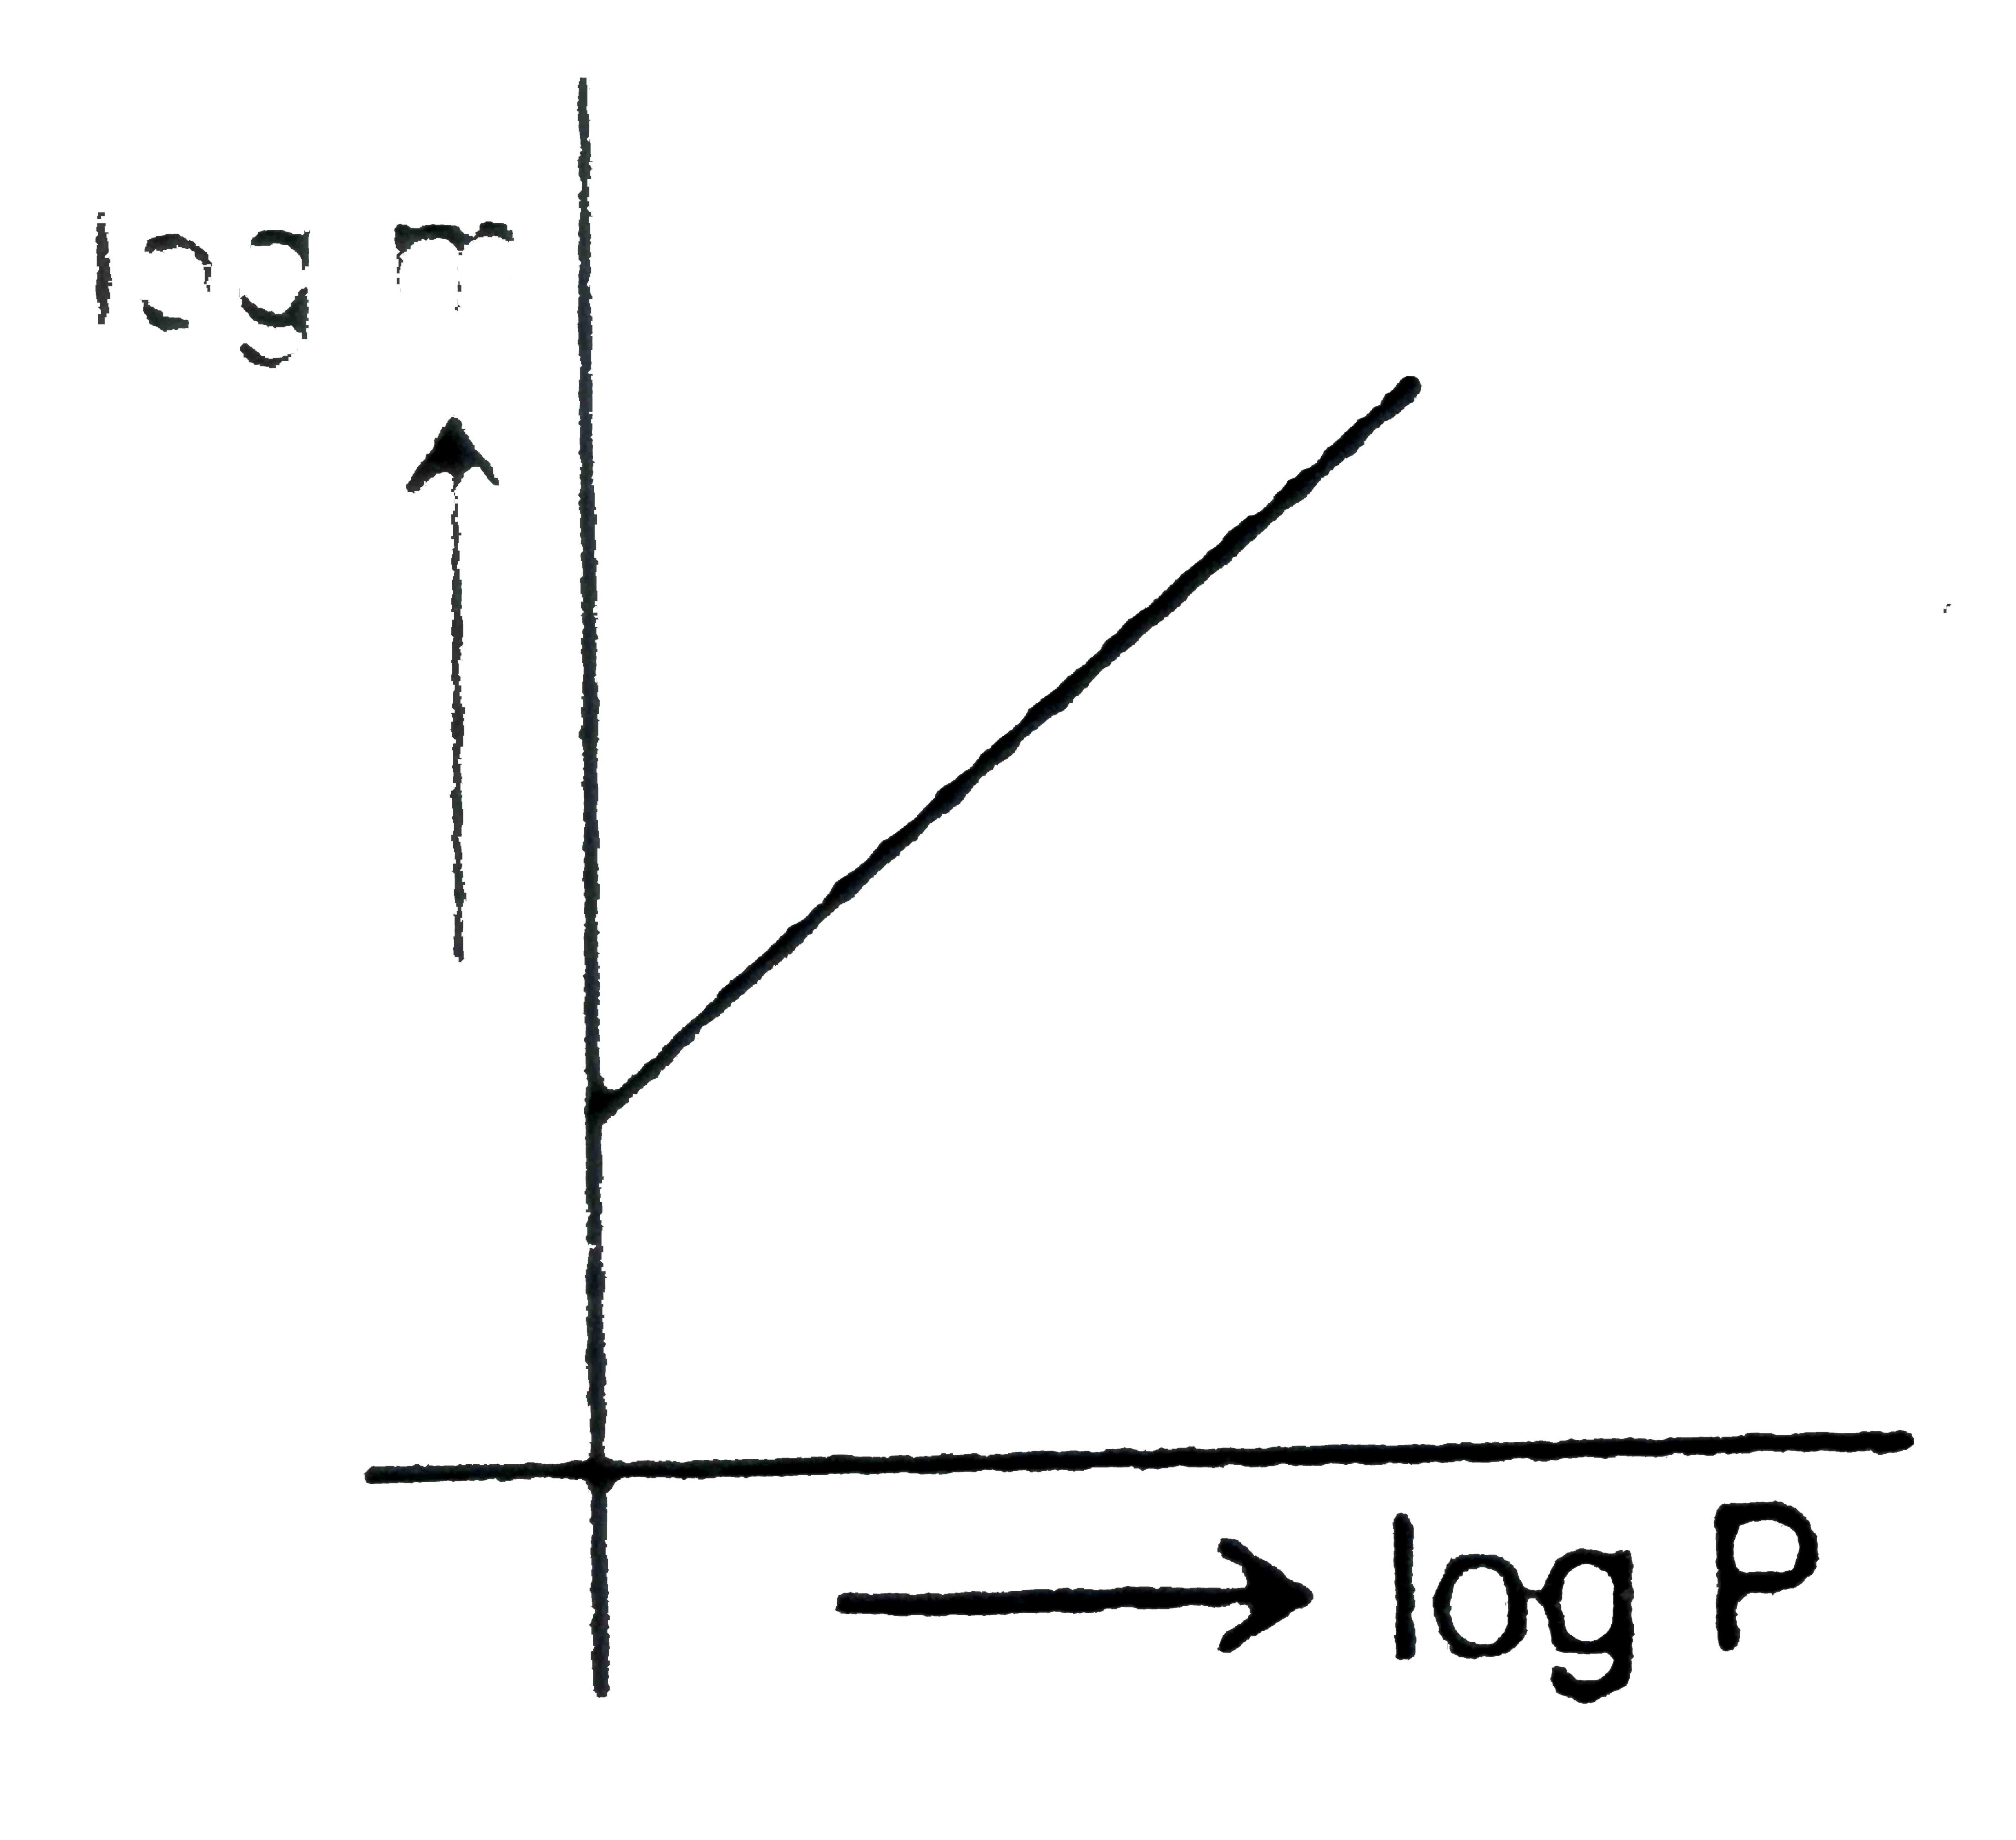 B
B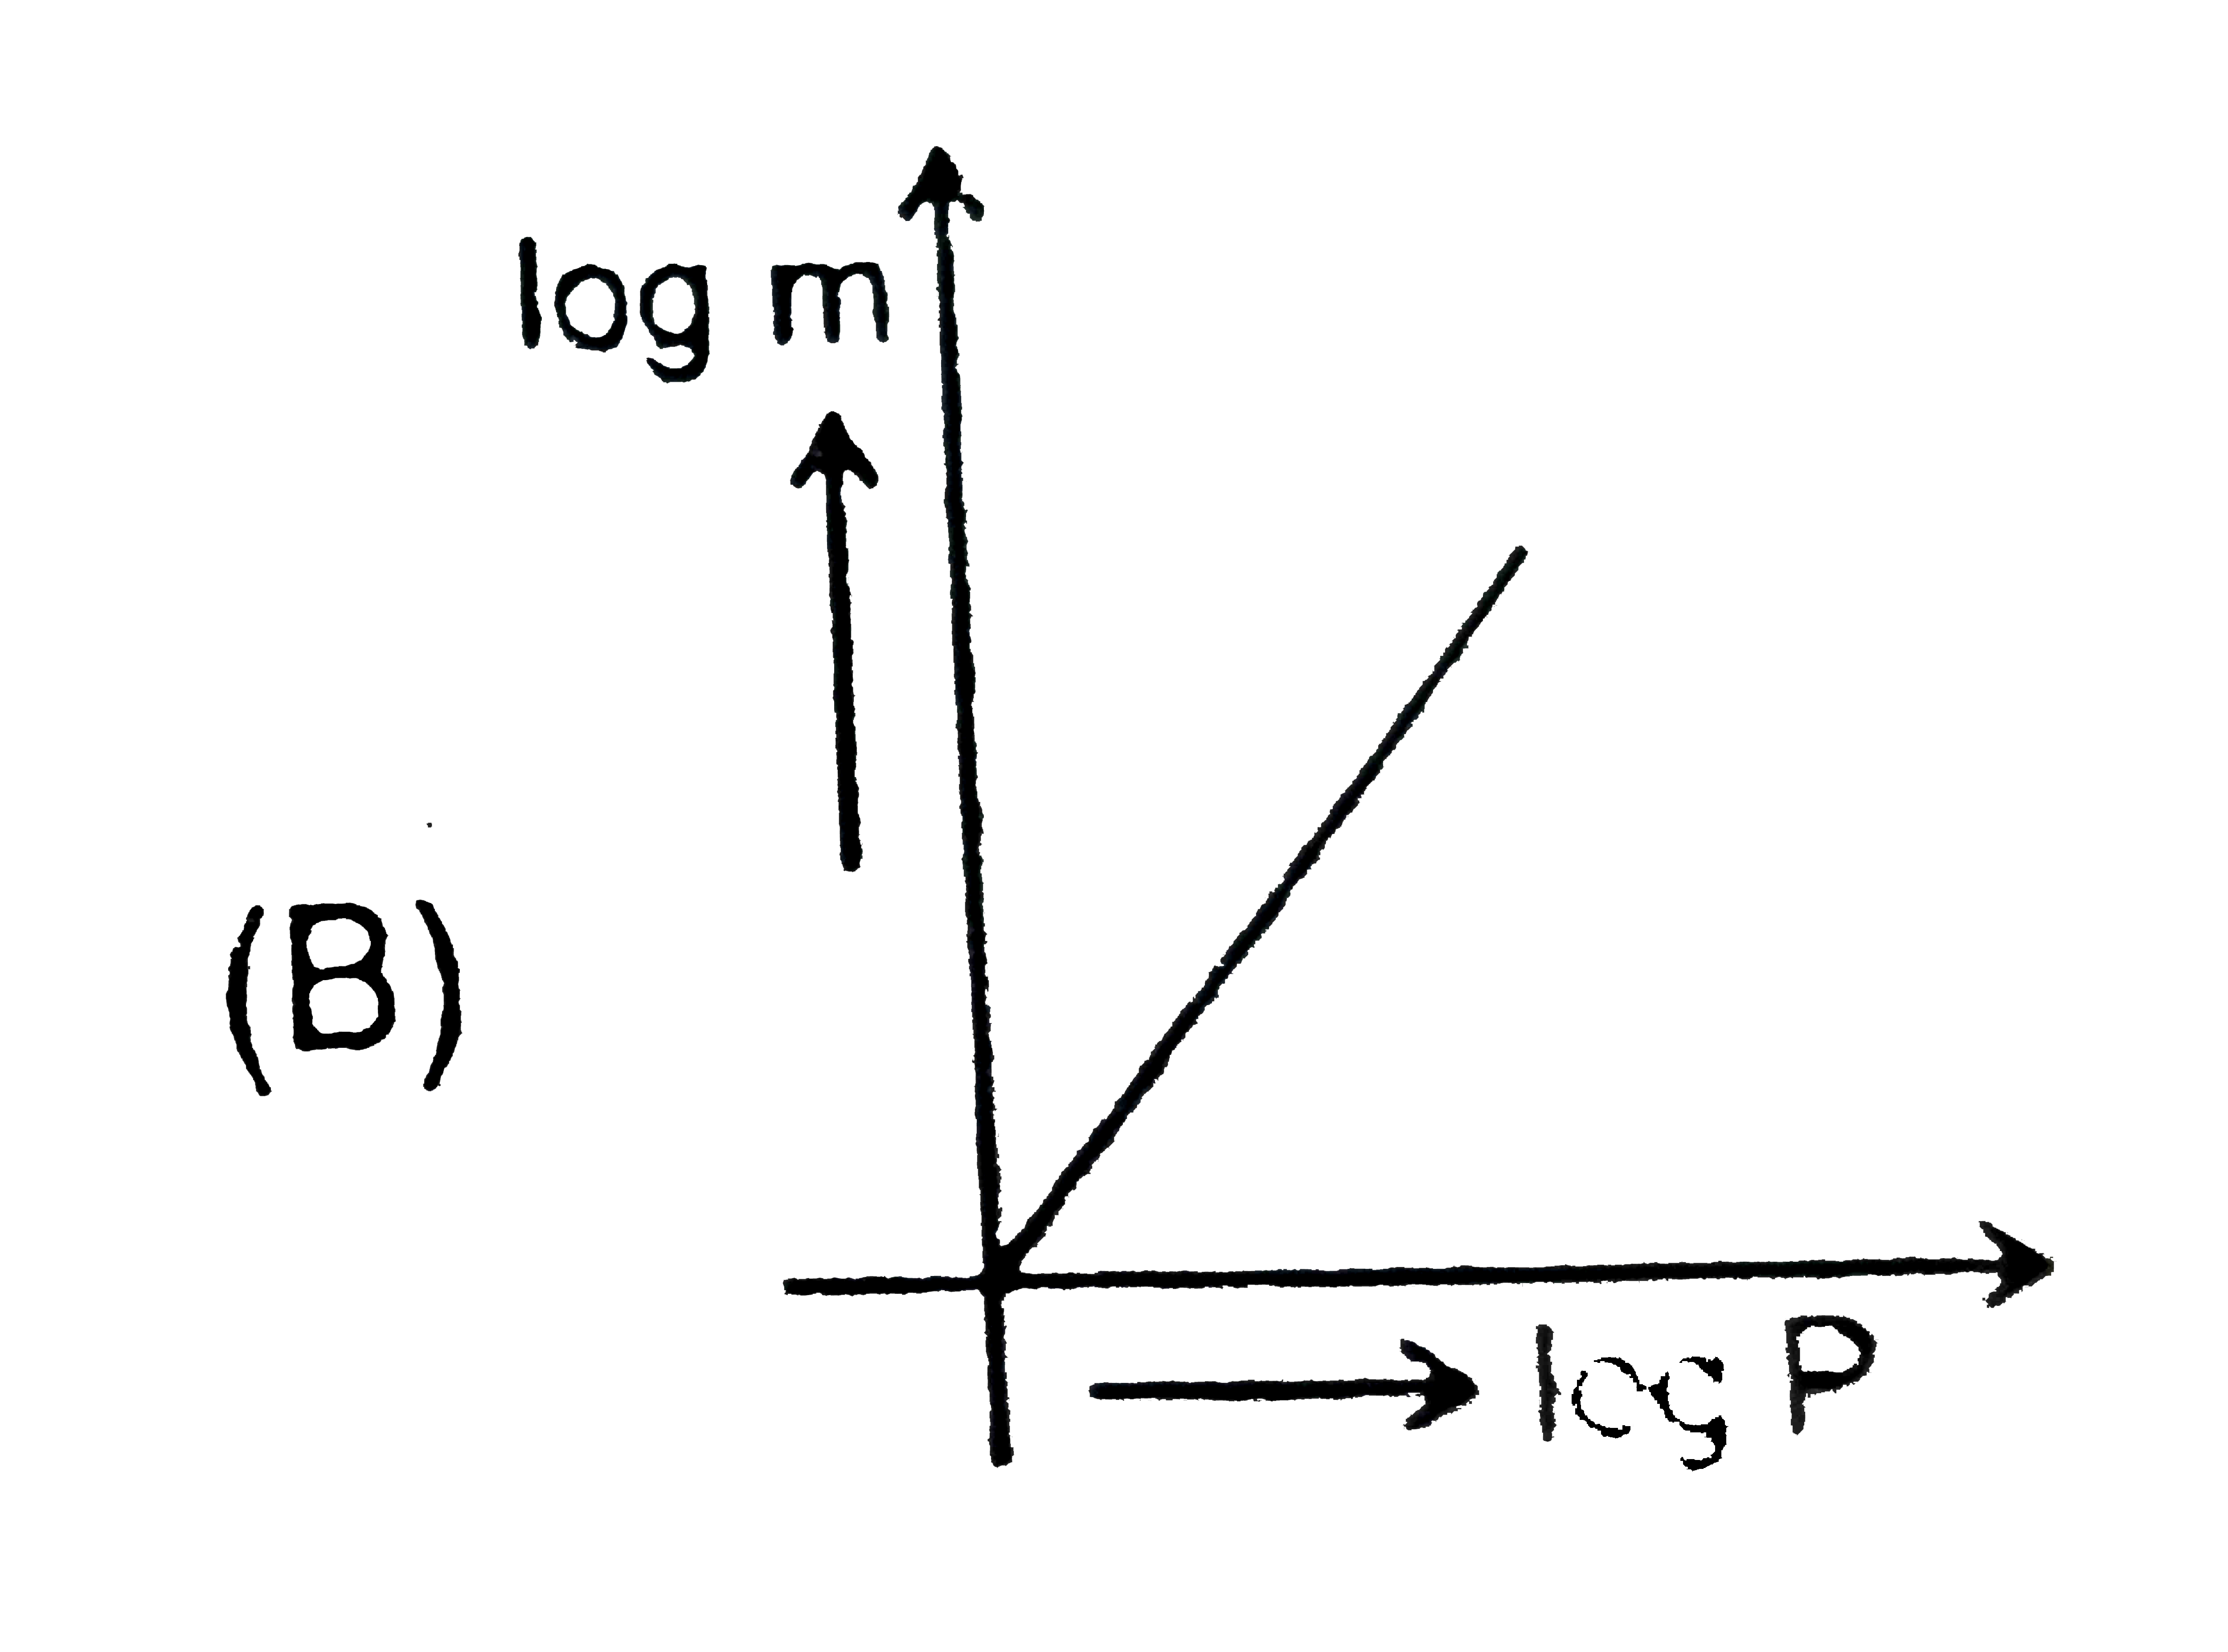 C
C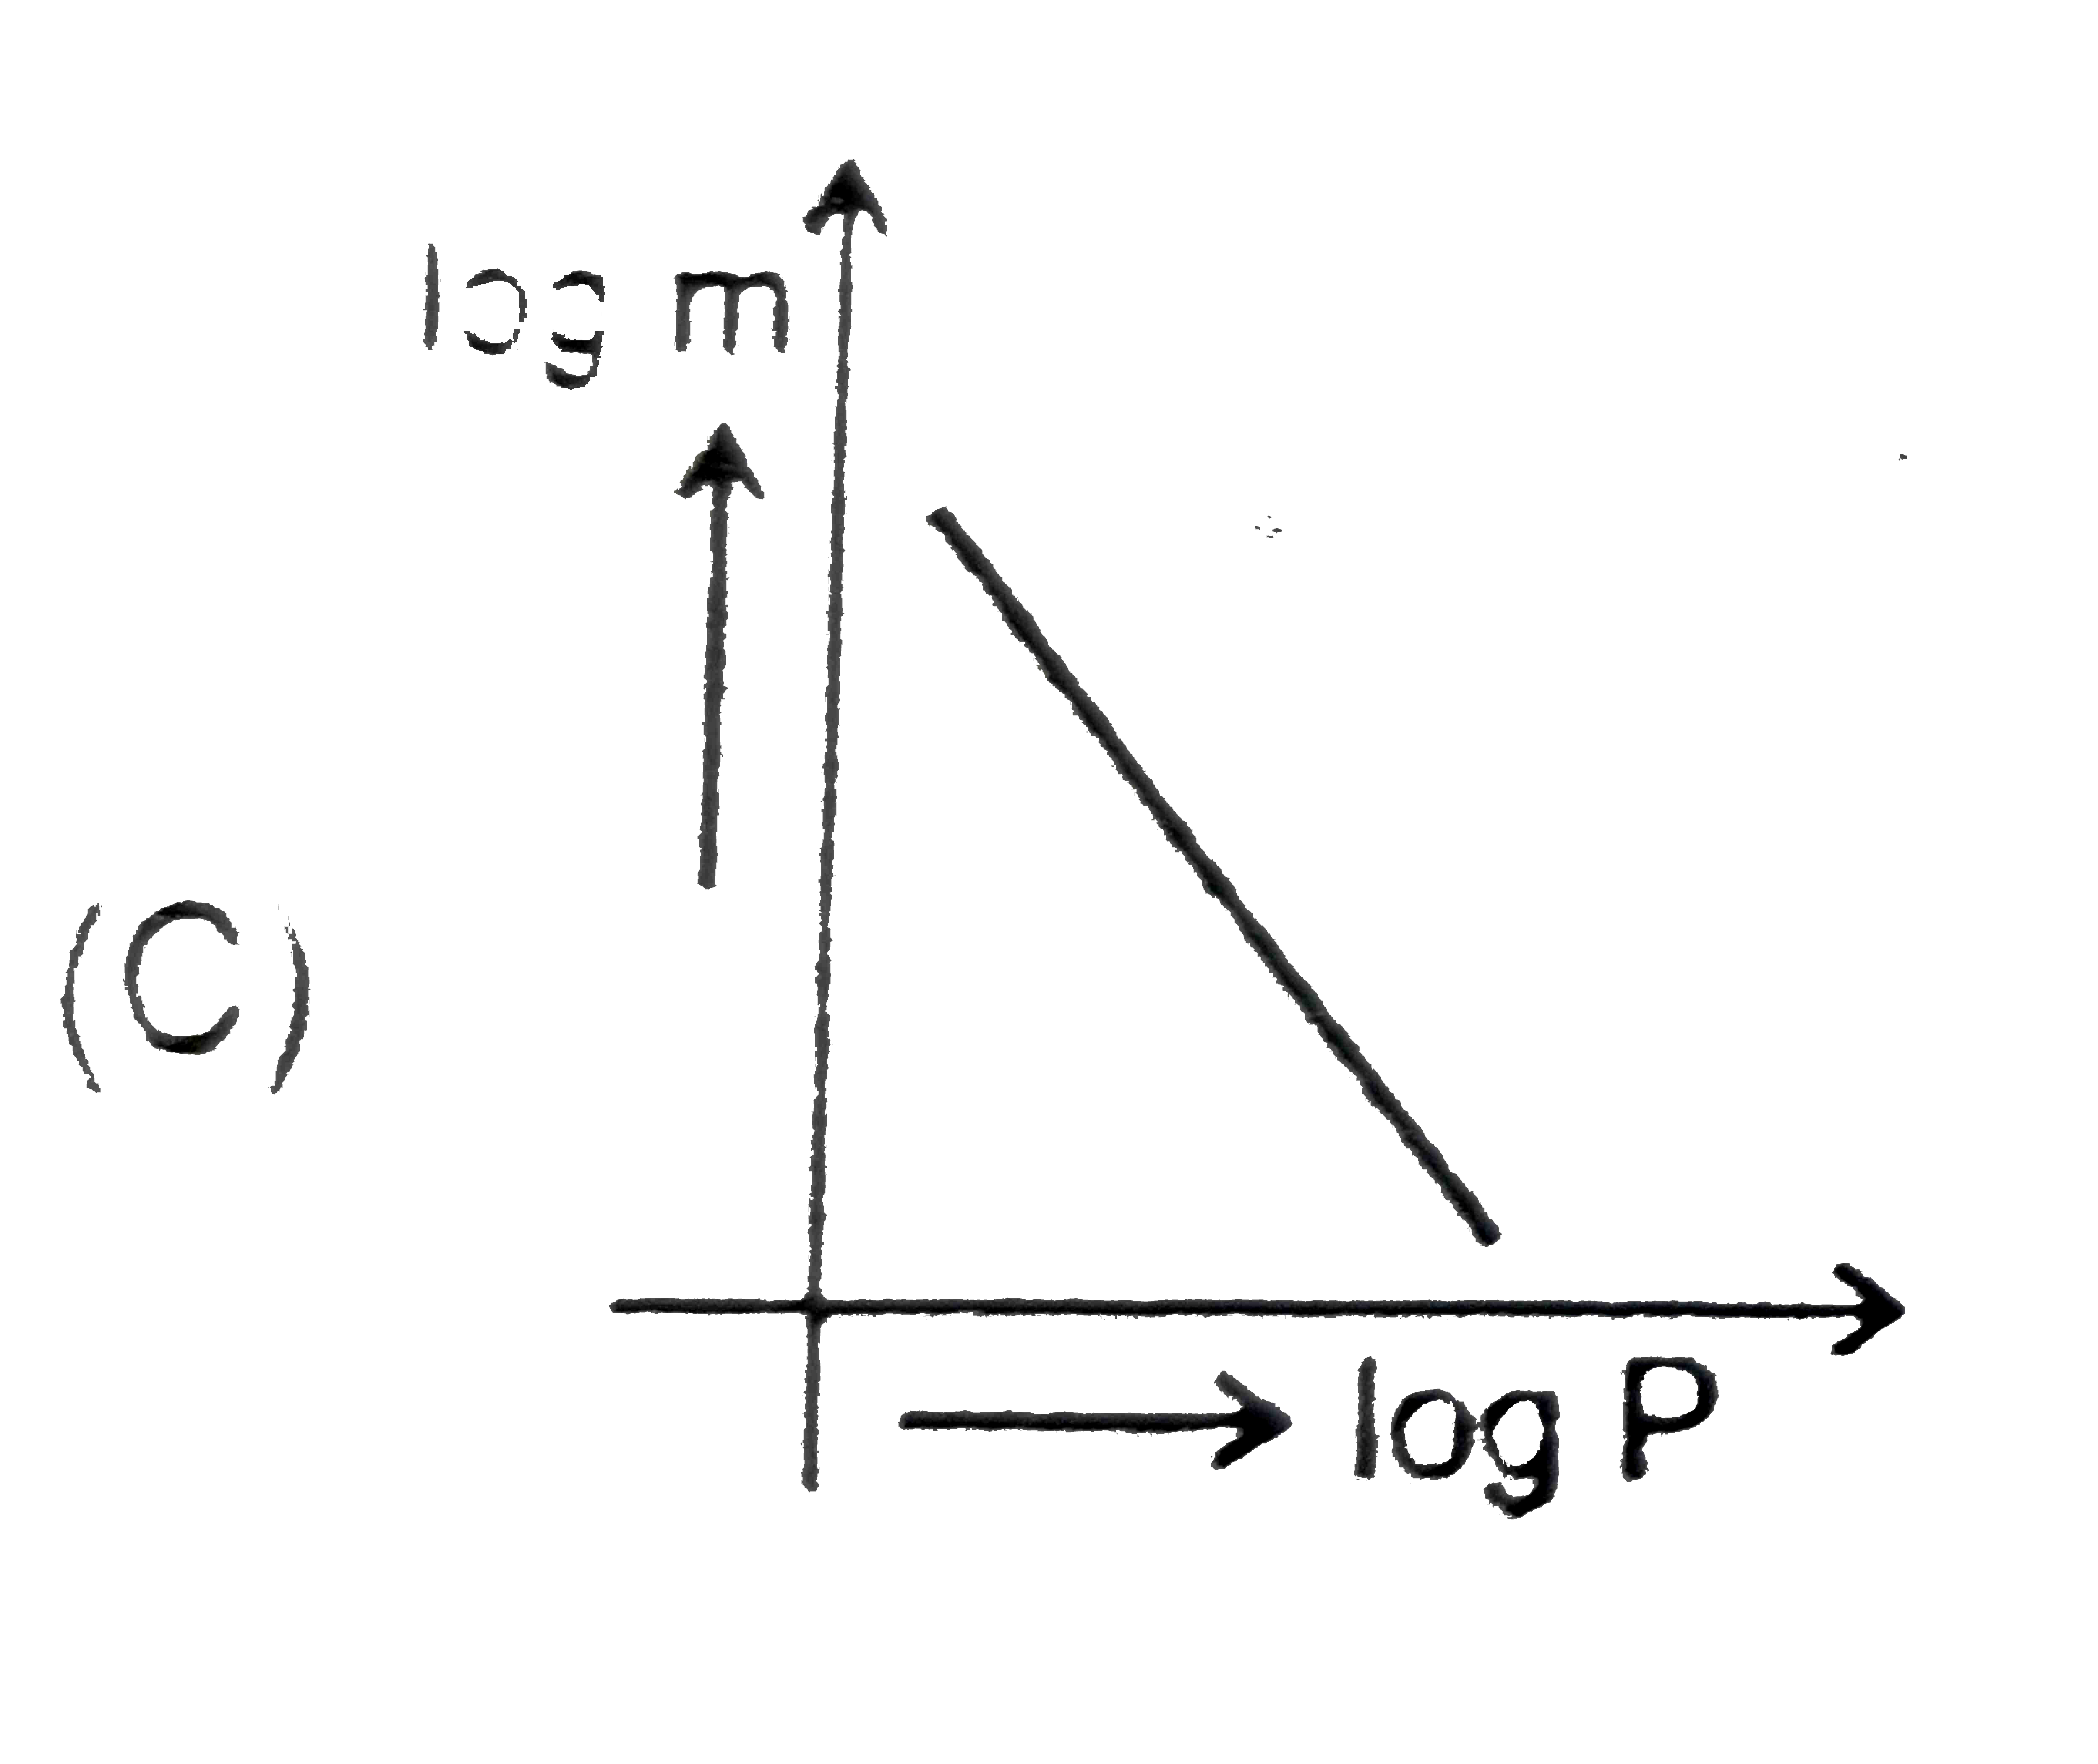 D
D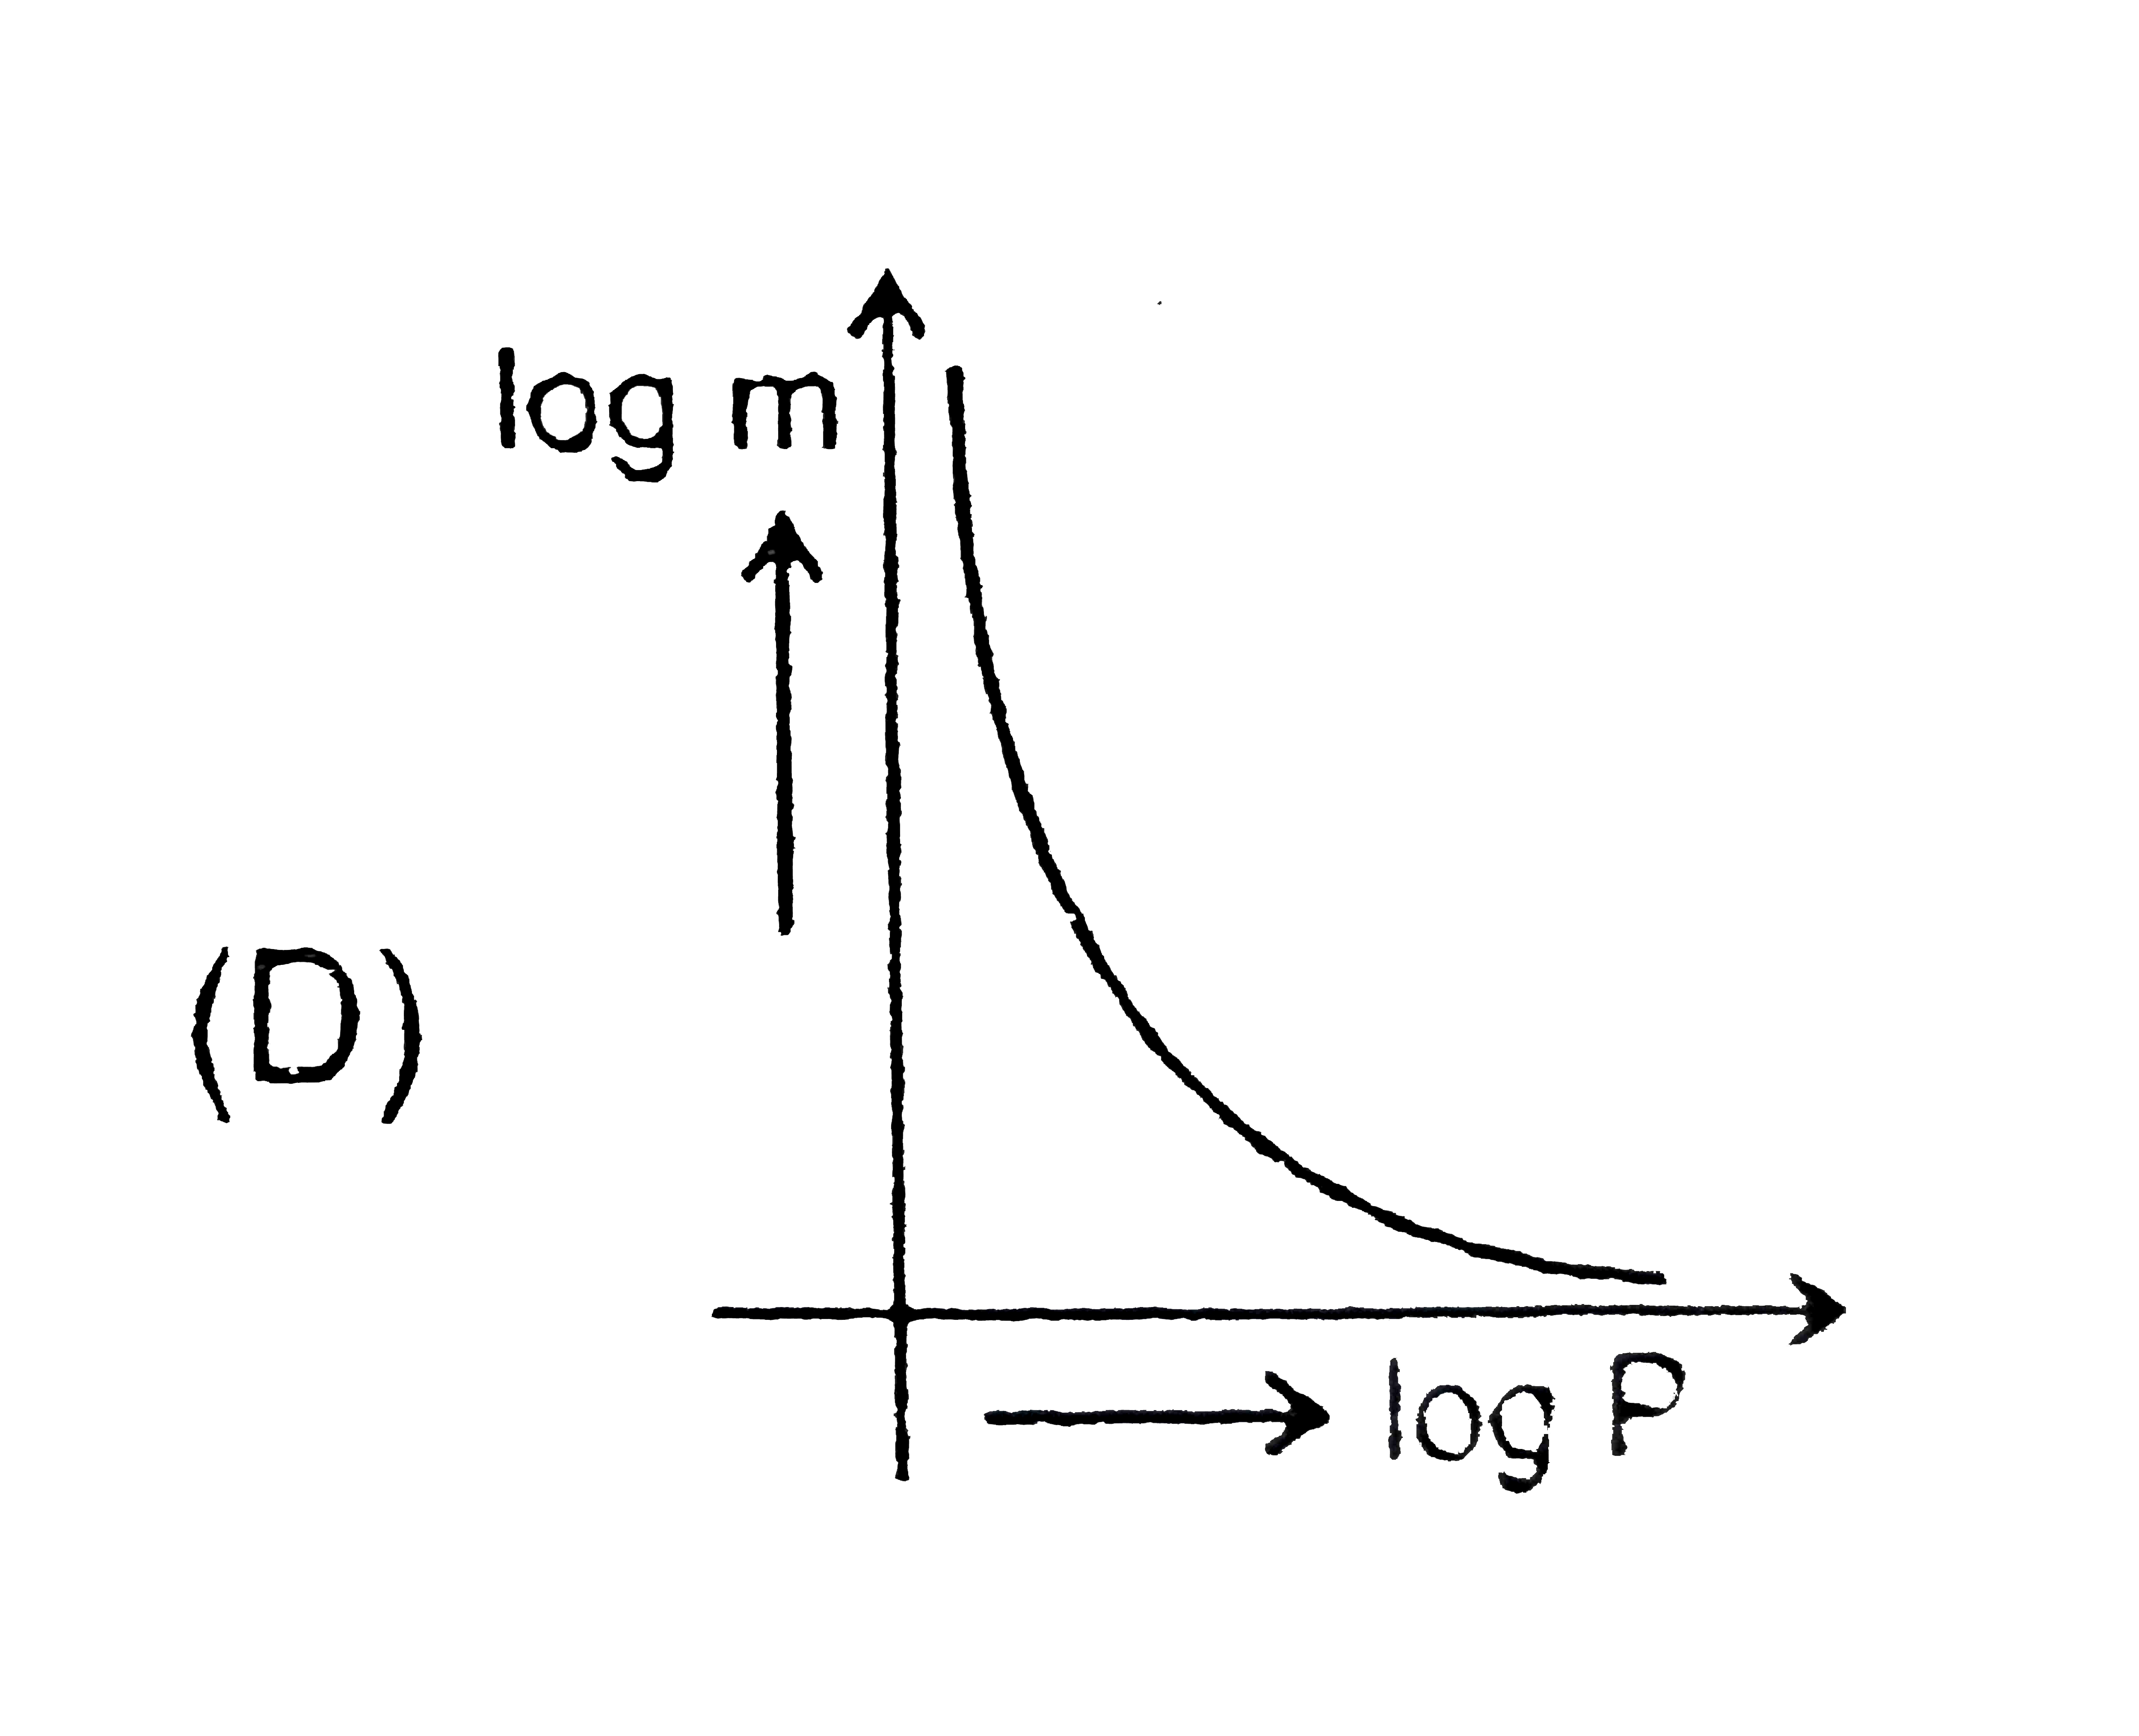
Which of the following curves represents the Henry's law ?
A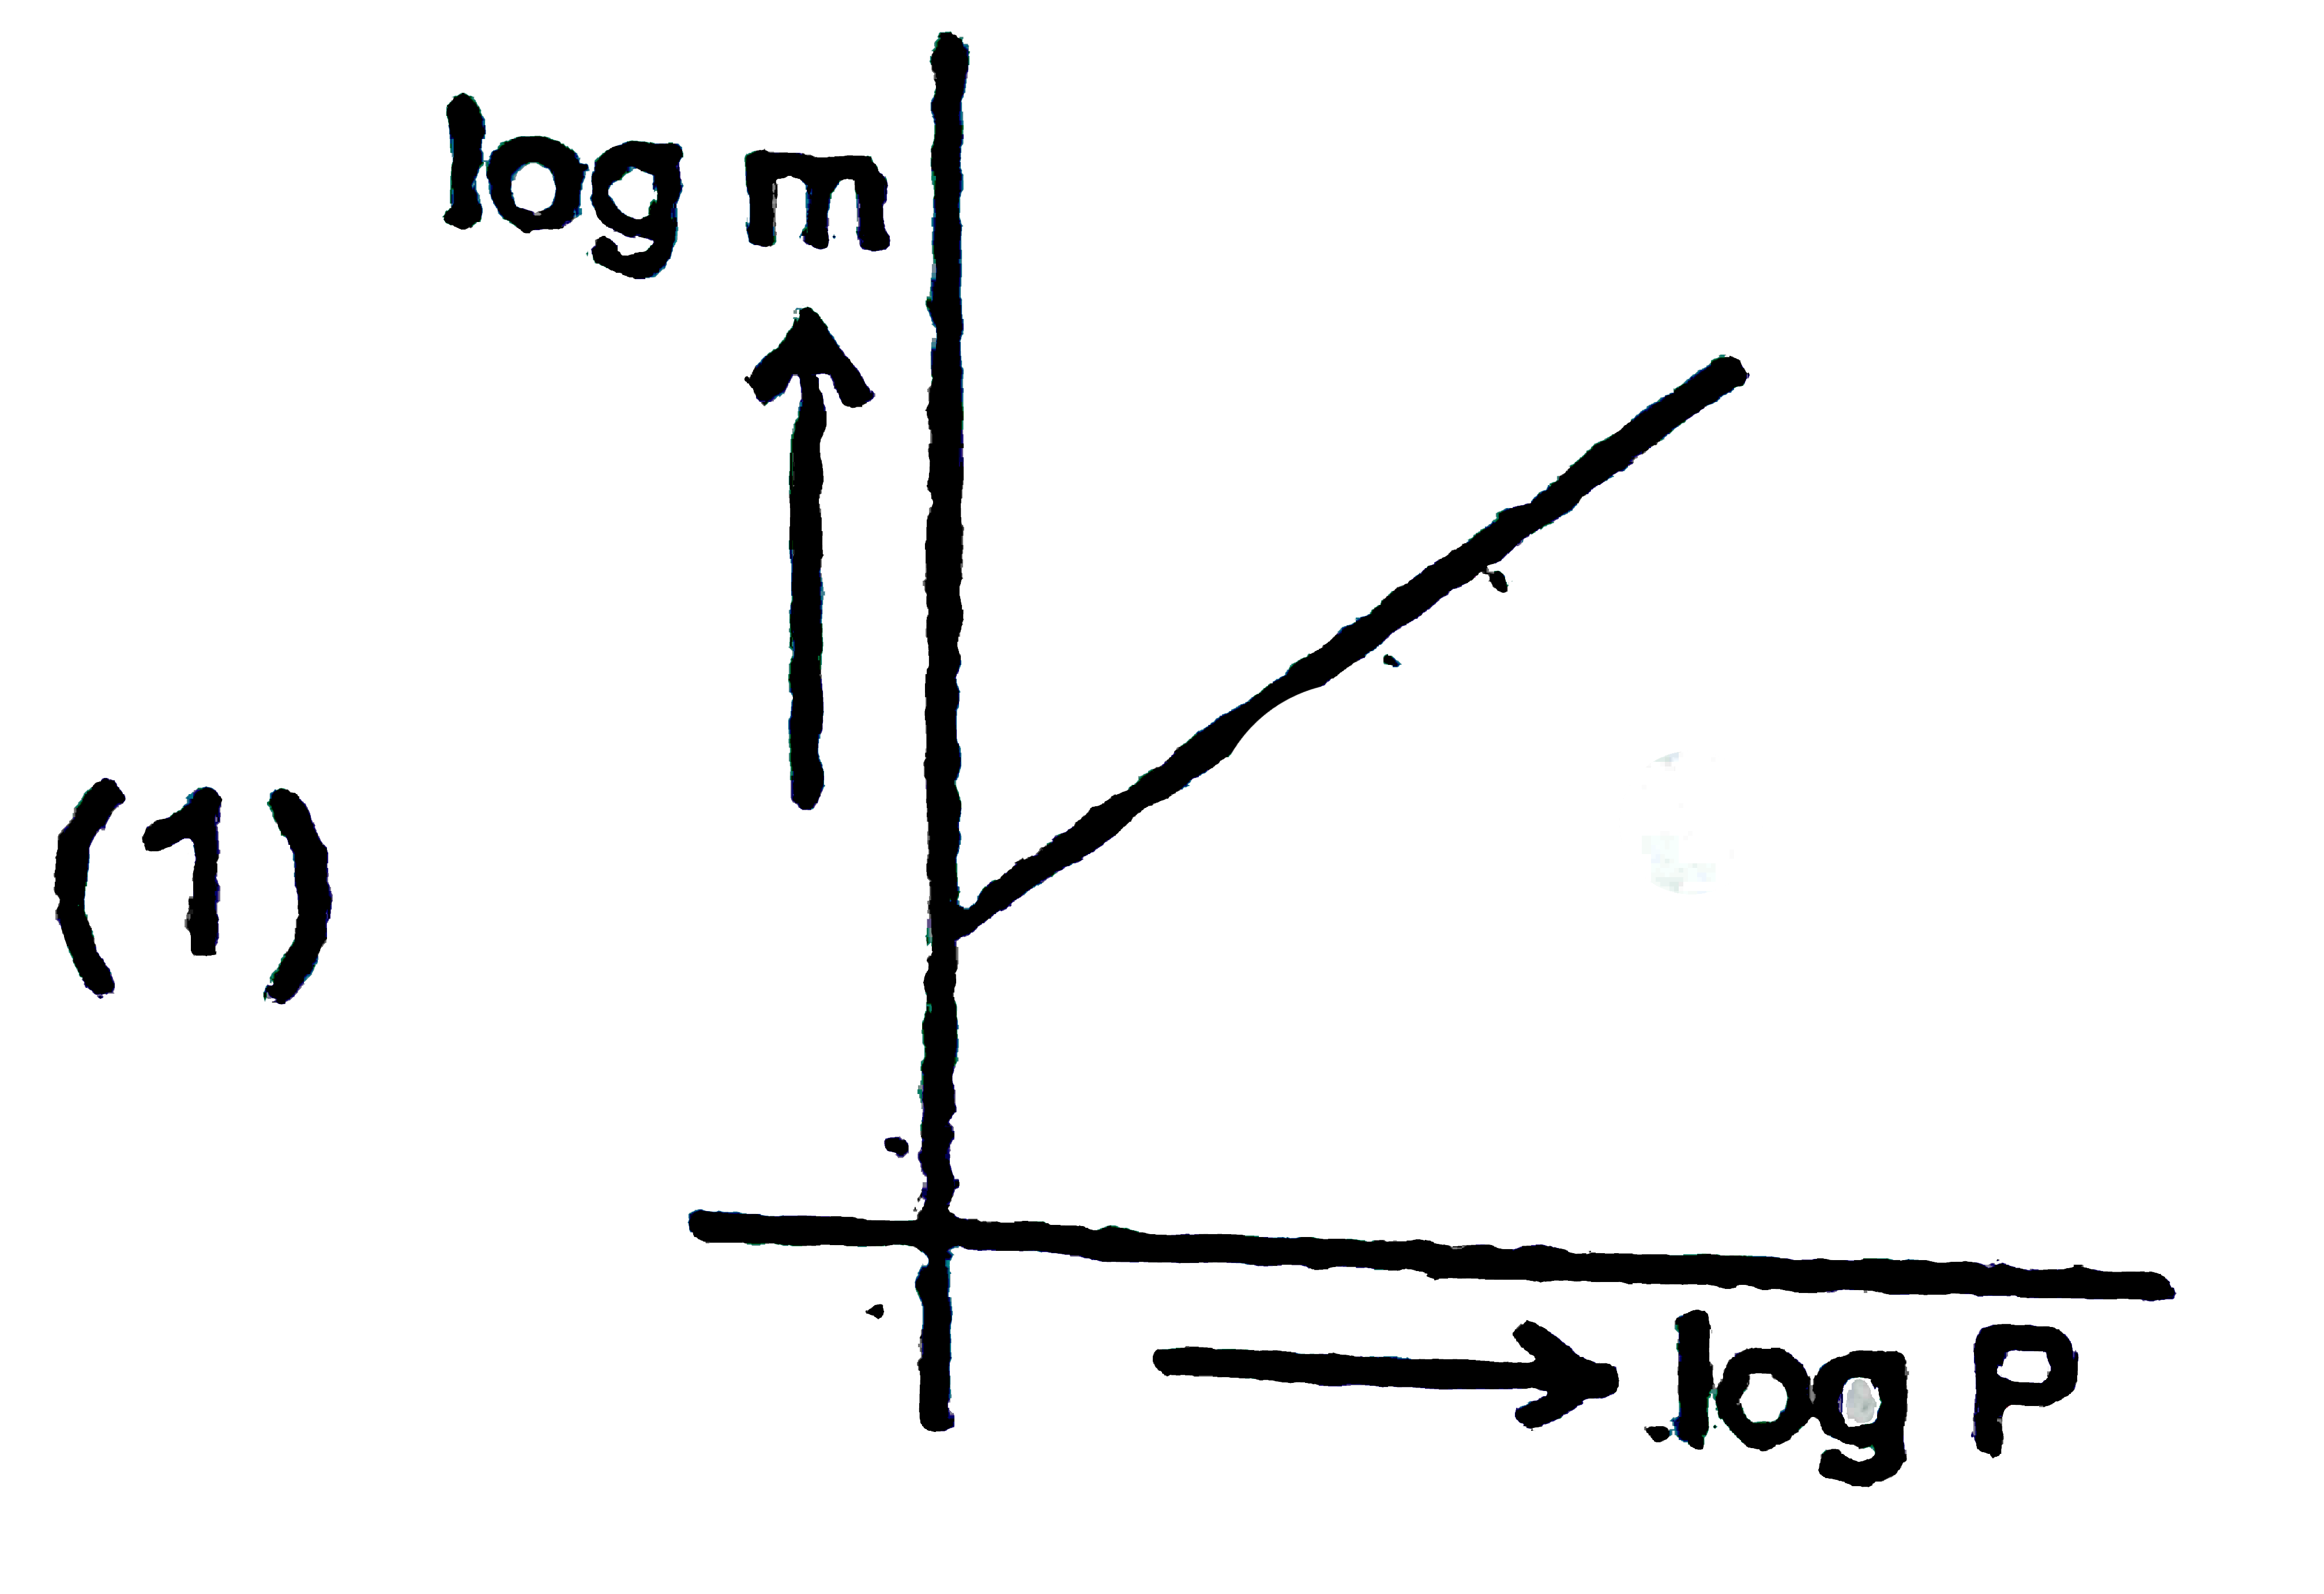 B
B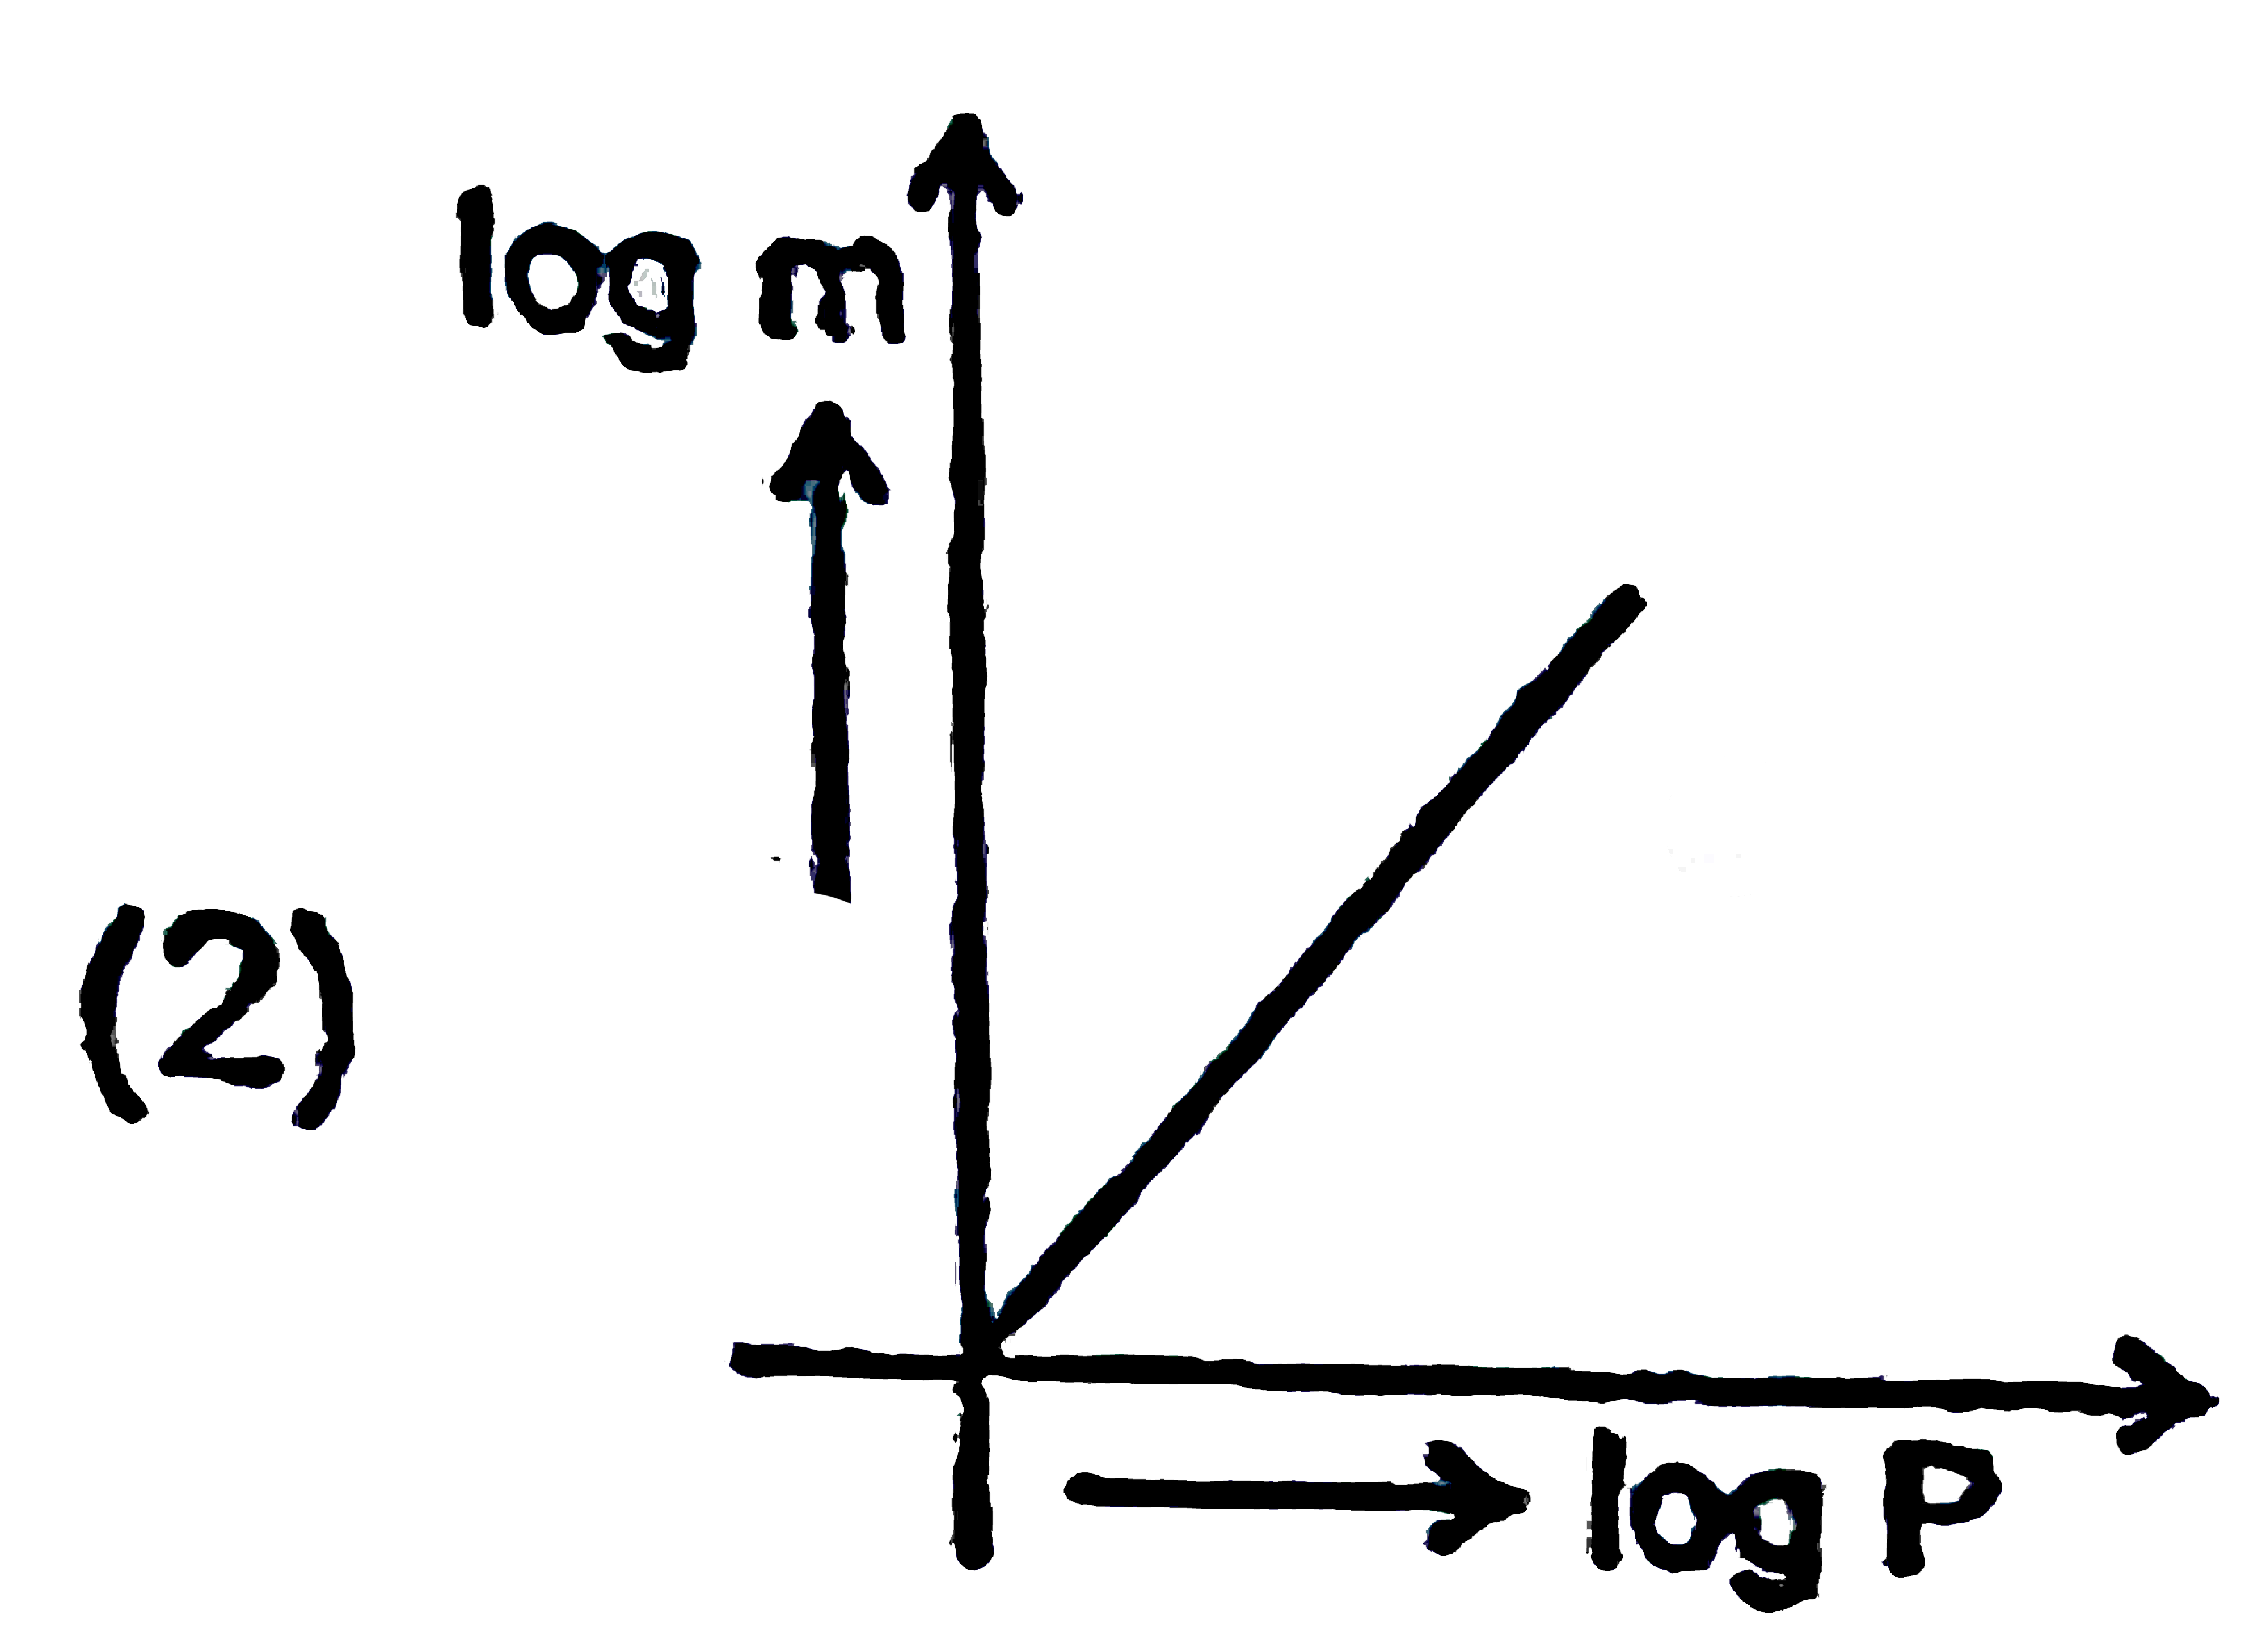 C
C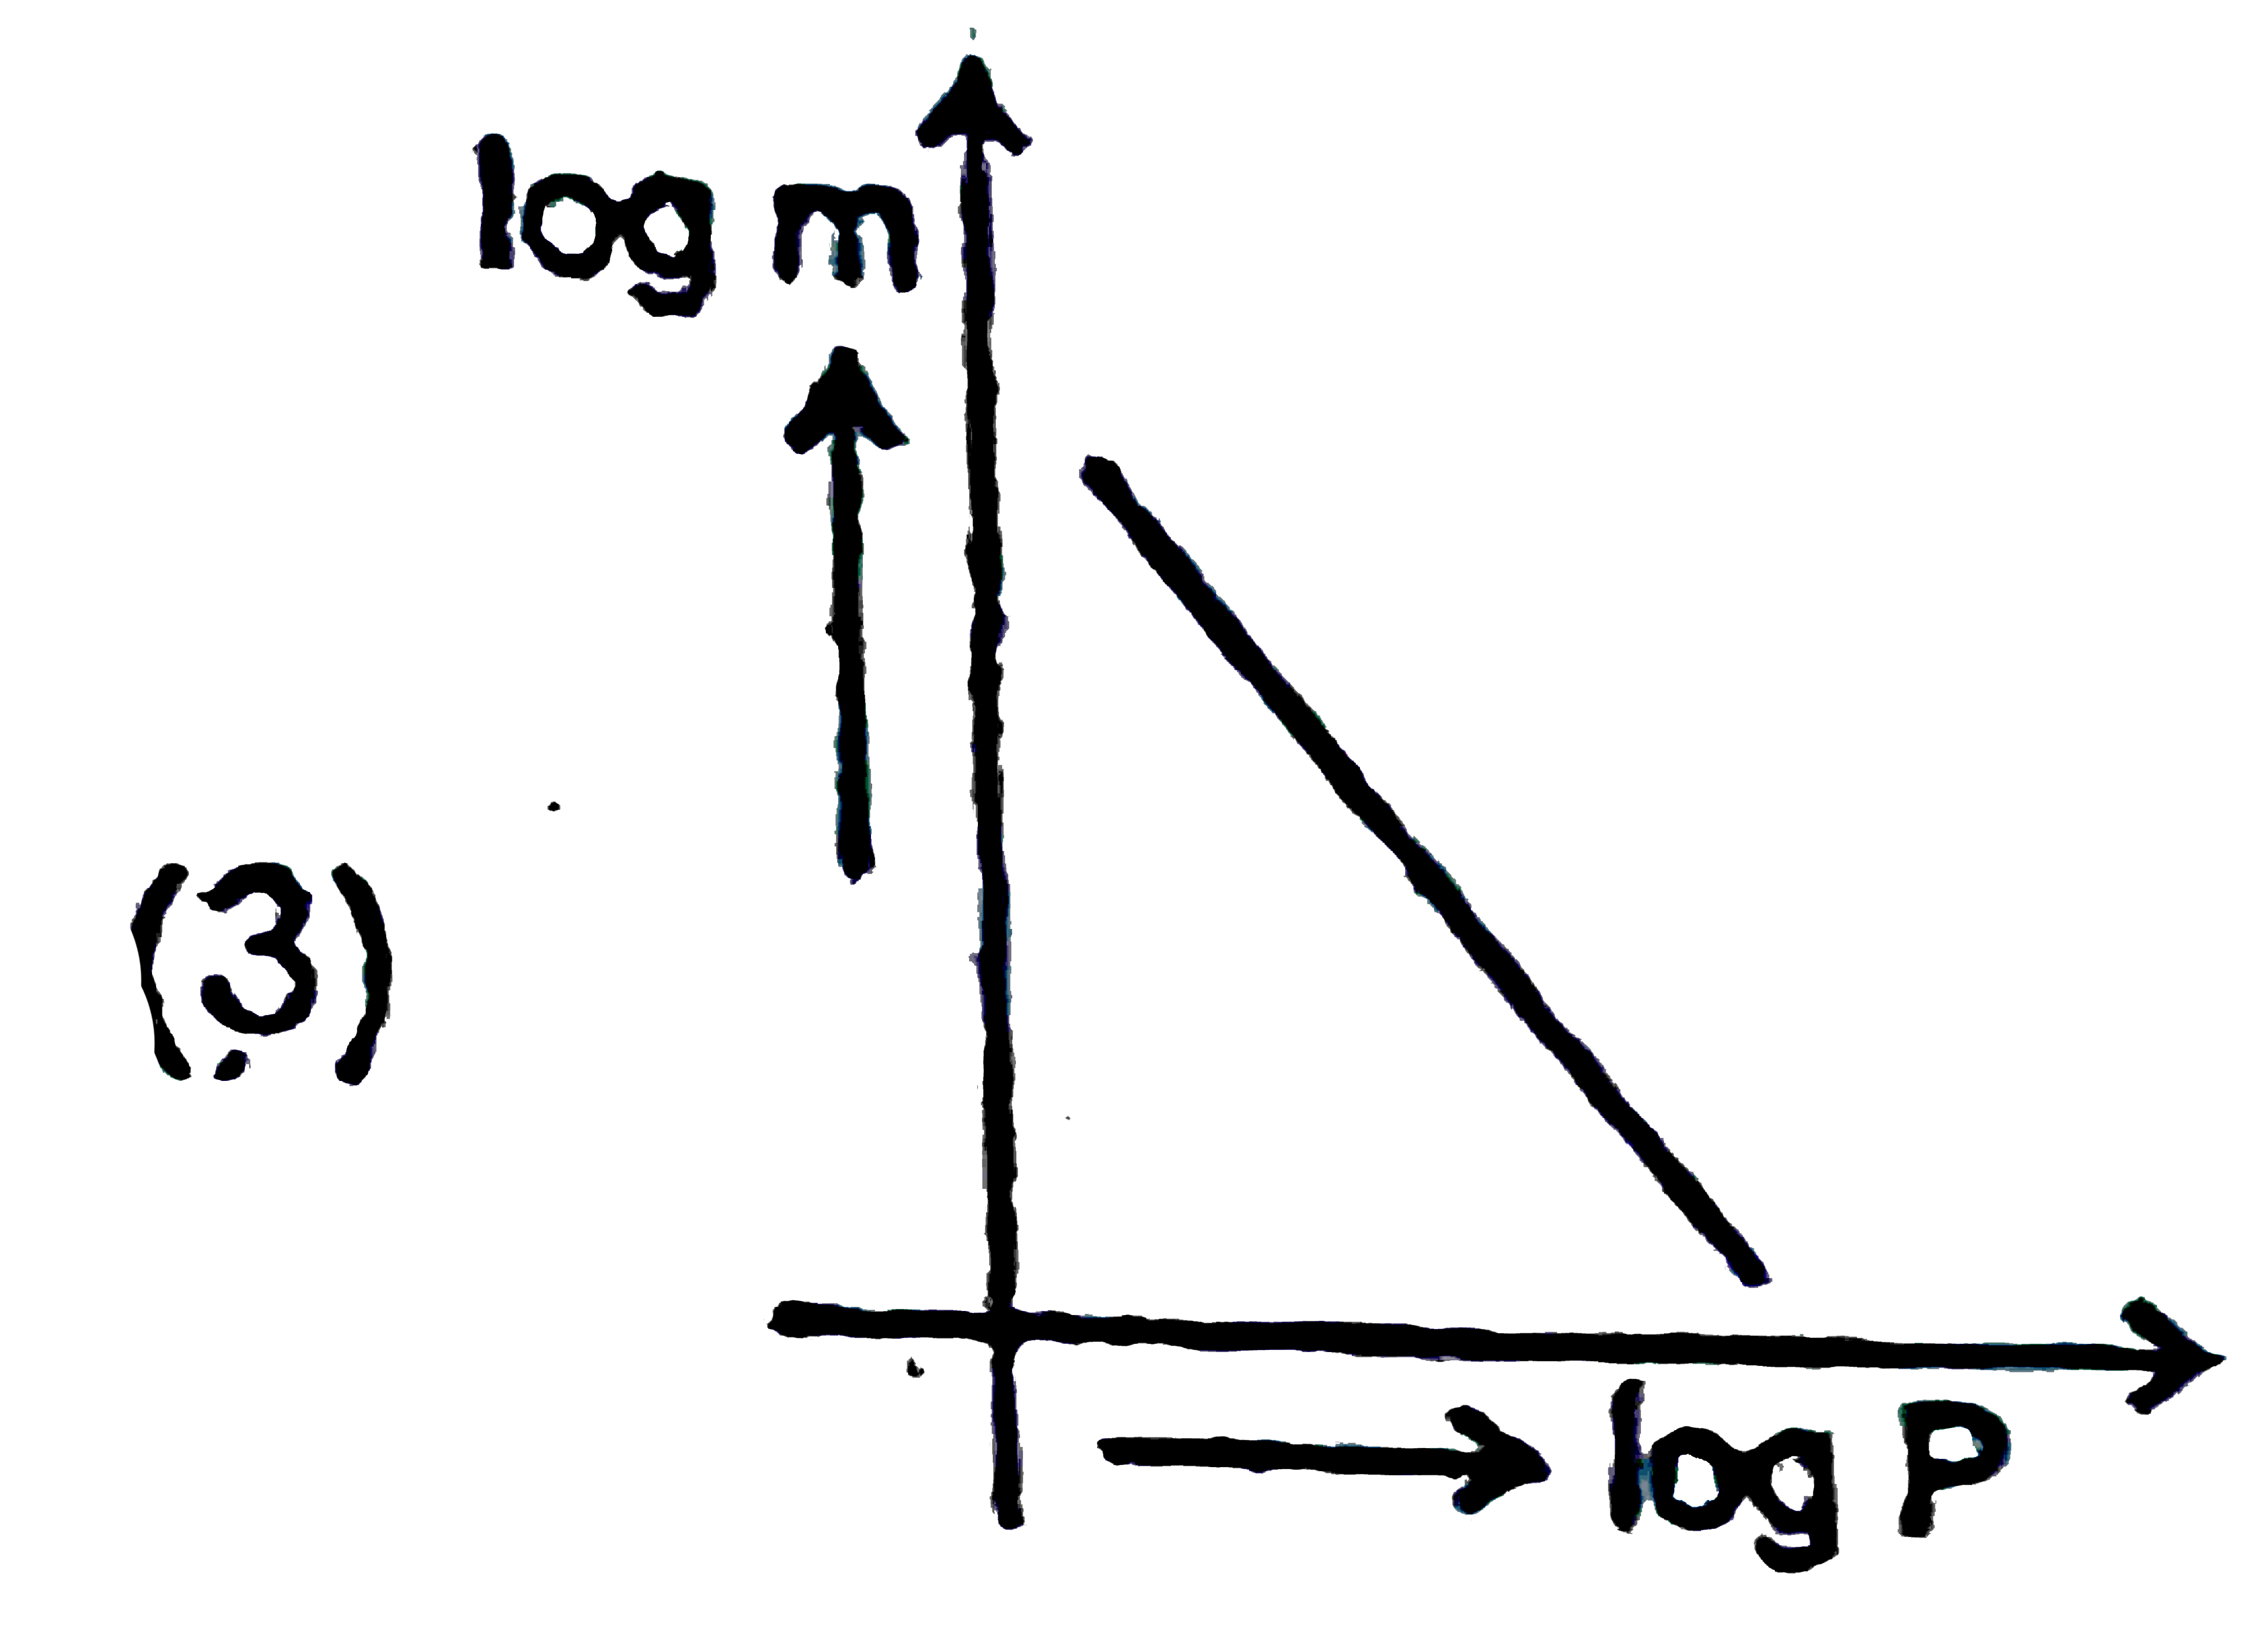 D
D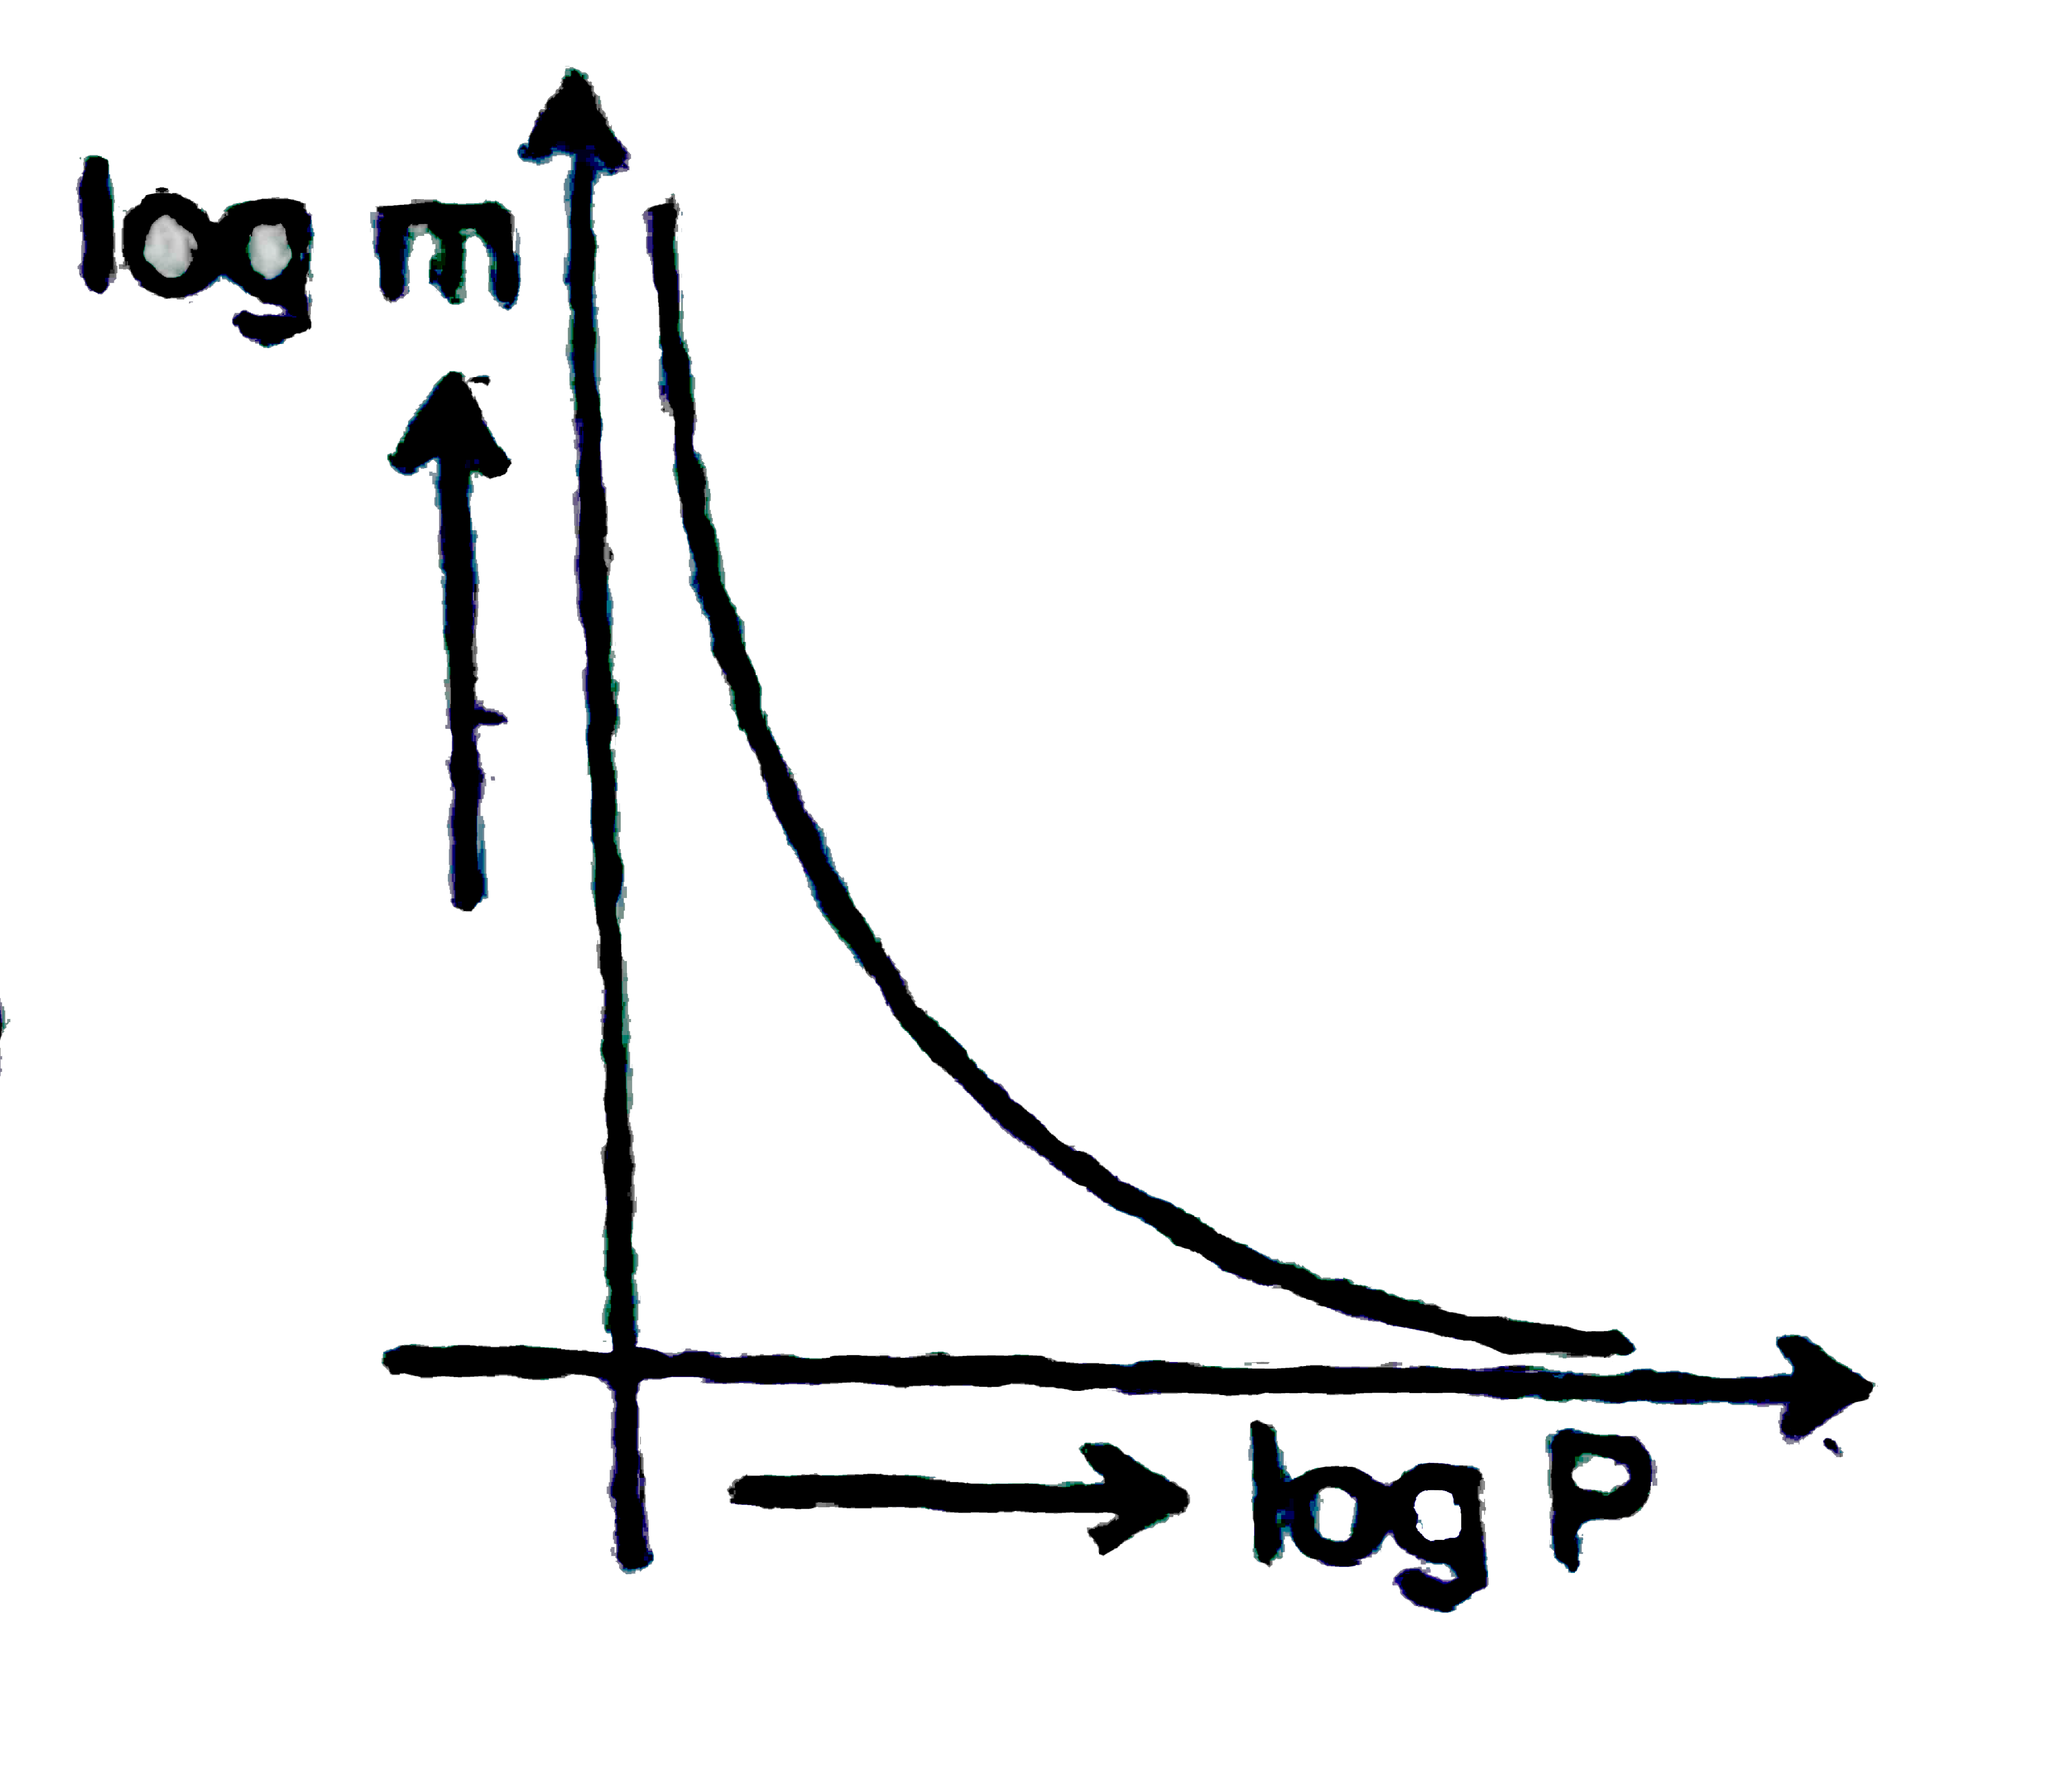
Which of the following curves represent(s) Boyle's law?
A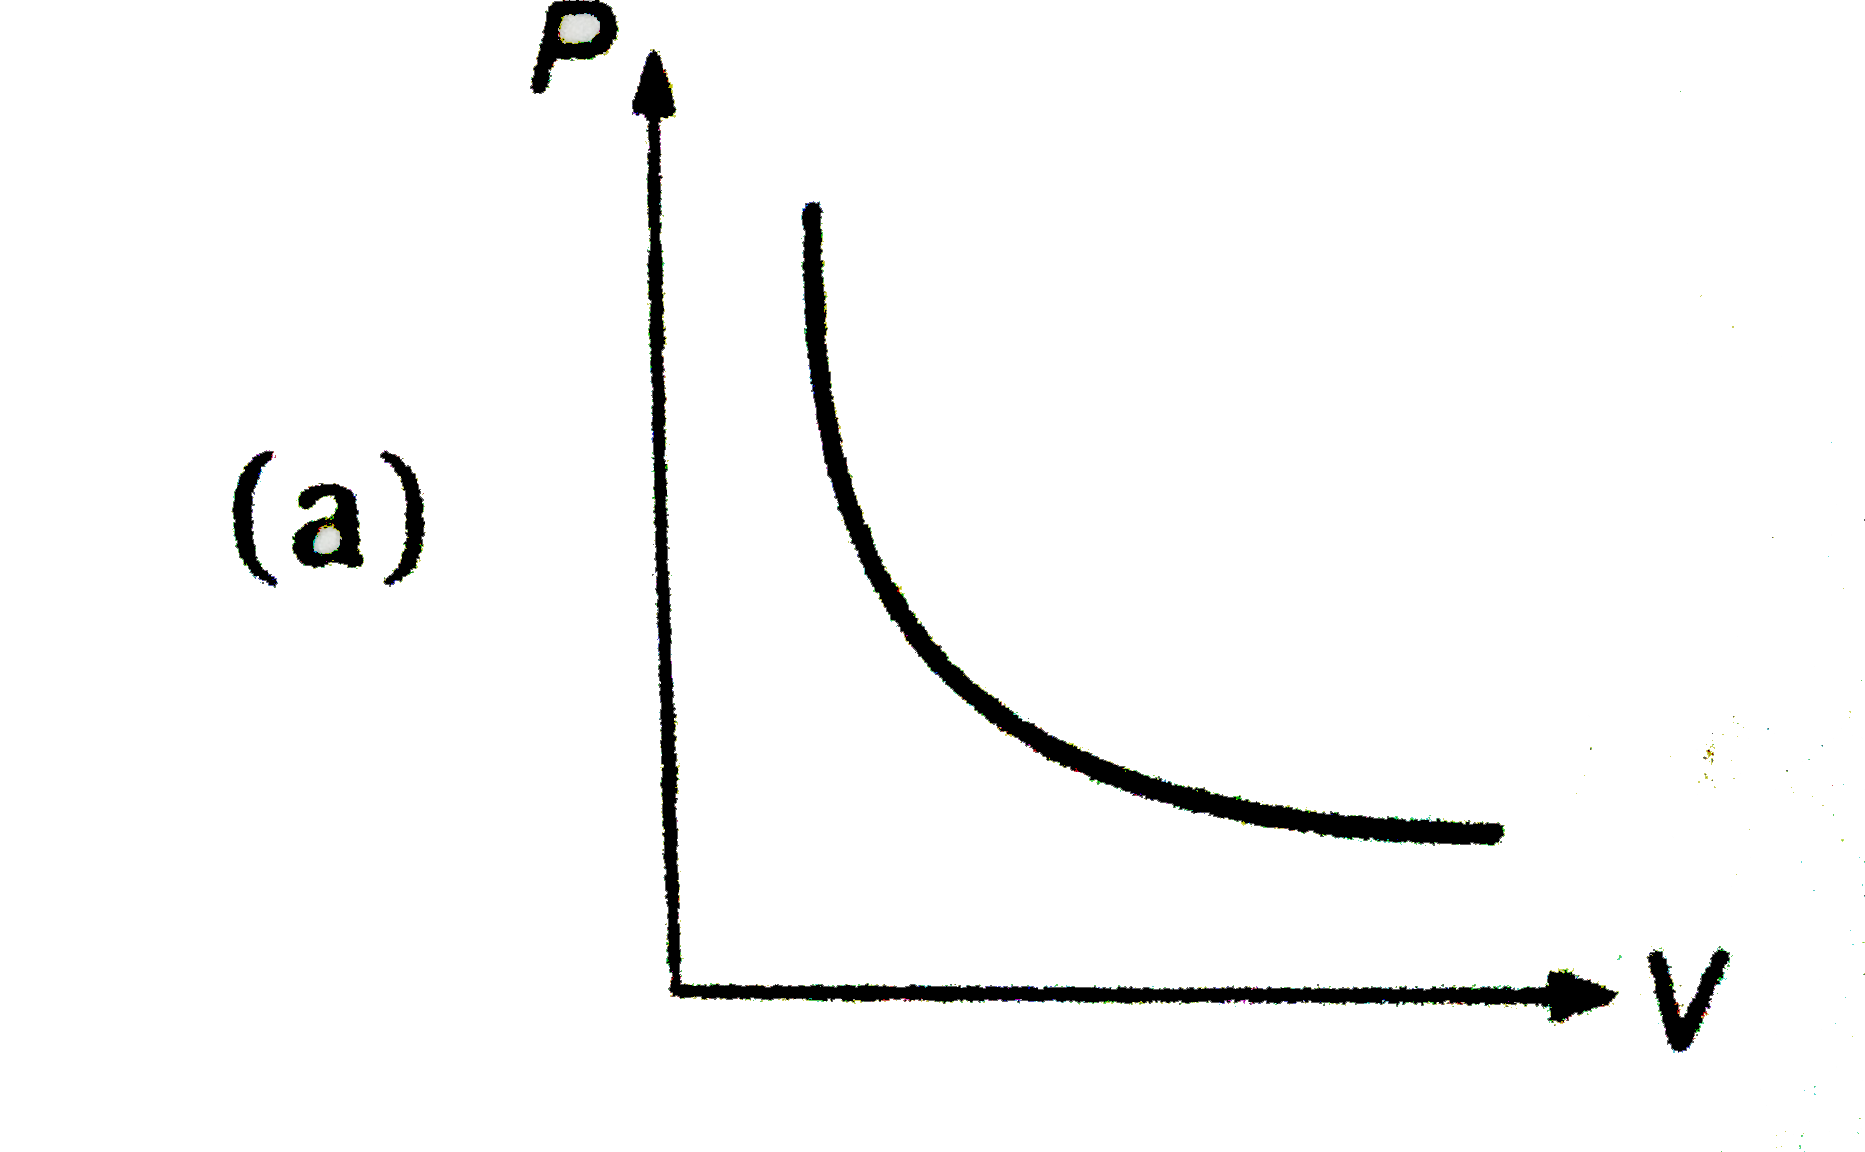 B
B C
C D
D
State Henry's law.
View SolutionWhich of the following curve does not represent Boyle's law?
View SolutionWhich of the following curves does not represent Boyle's law?
View SolutionWhich of the following curves does not represent Boyle's law ?
View SolutionWhich of the following curve does not represent Gay-Iusacc's law?
View Solution
