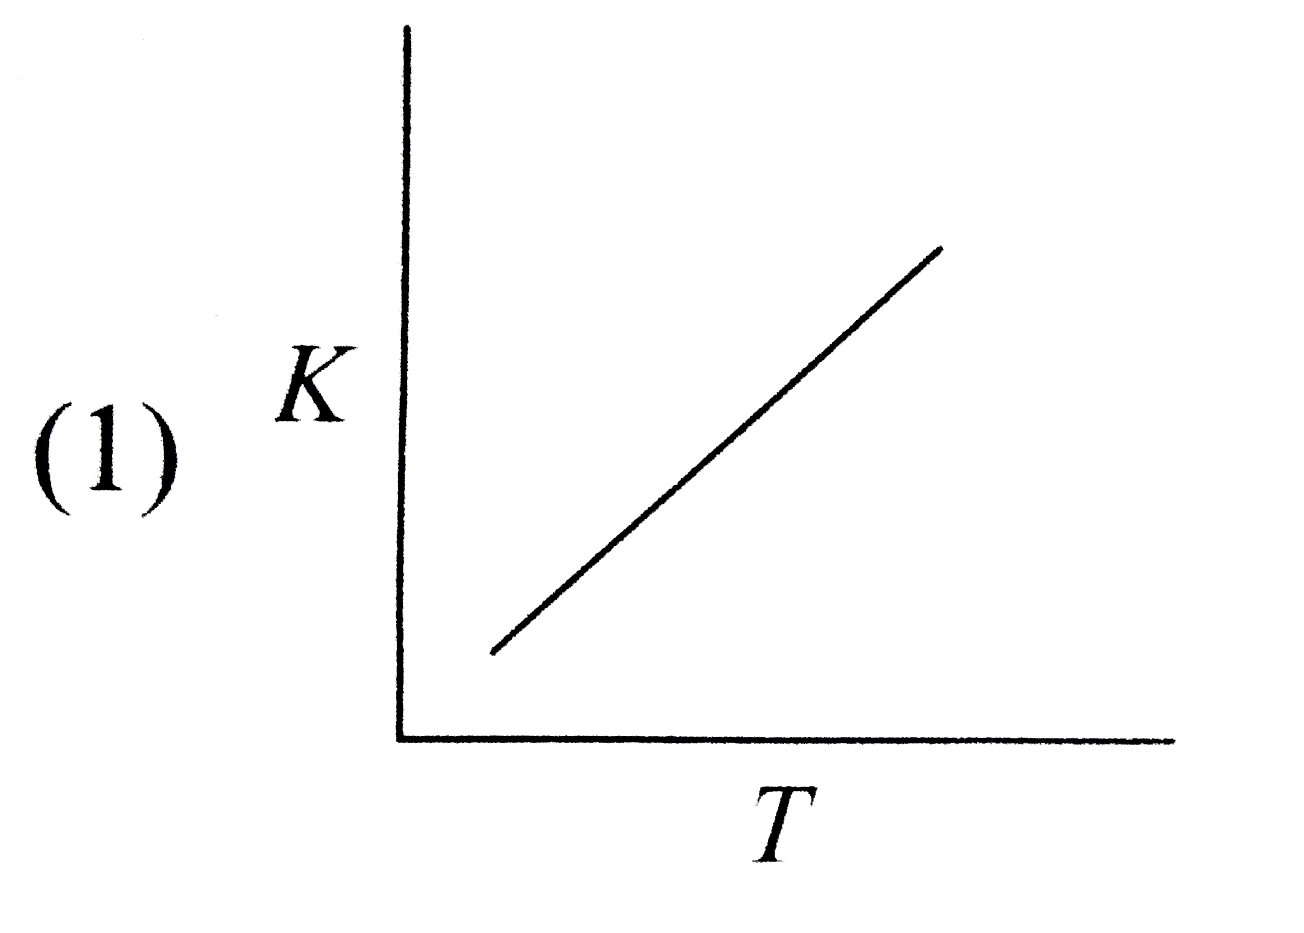
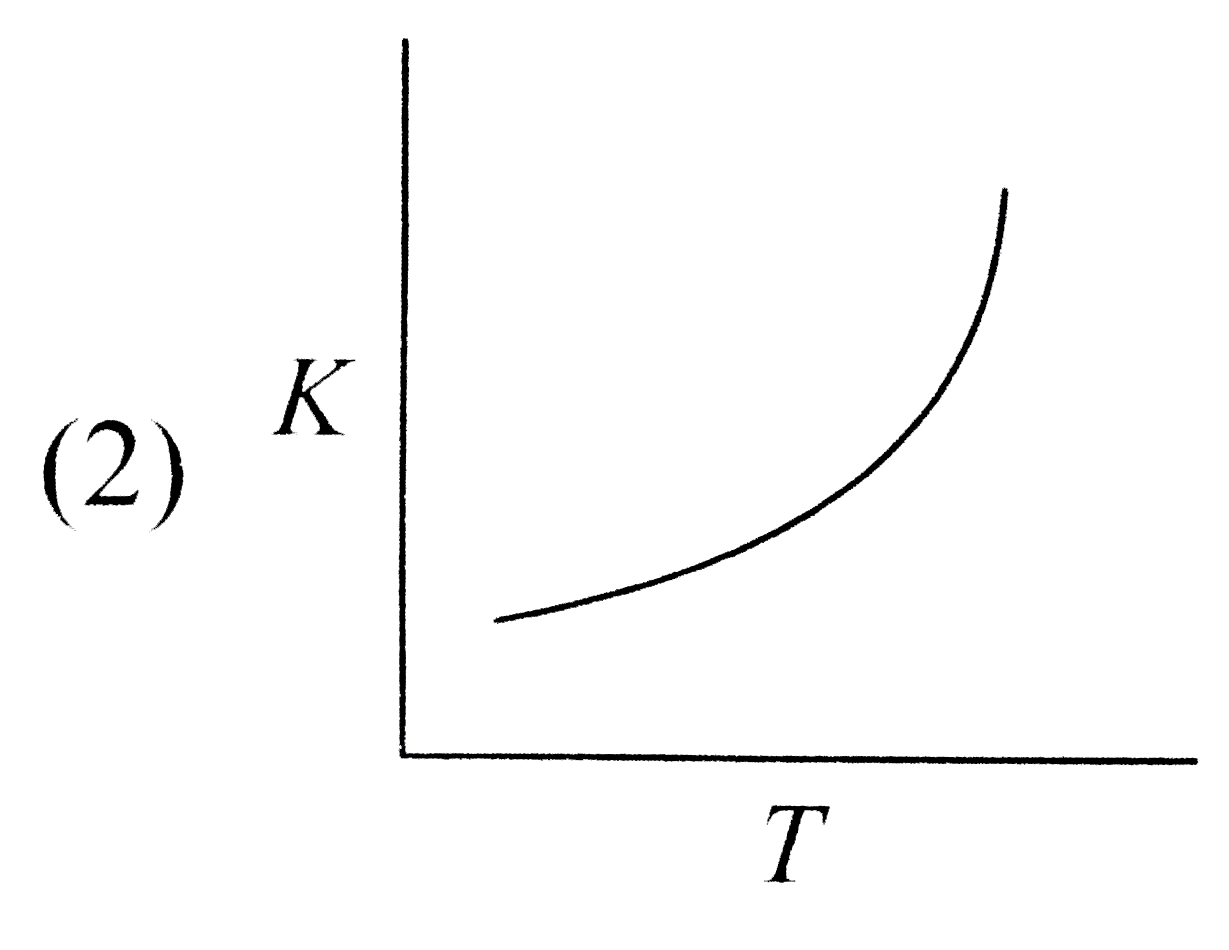
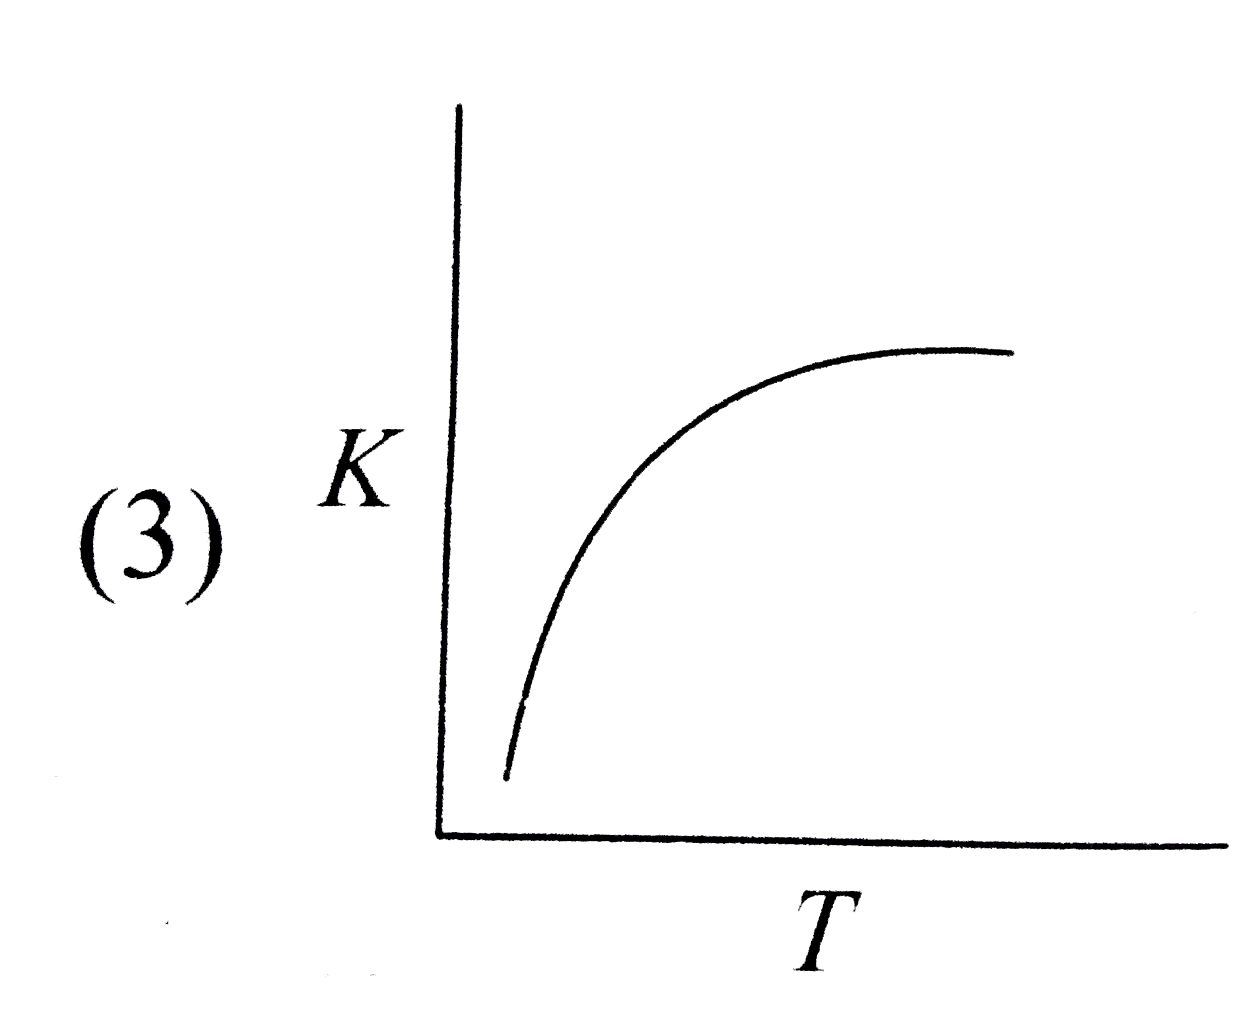
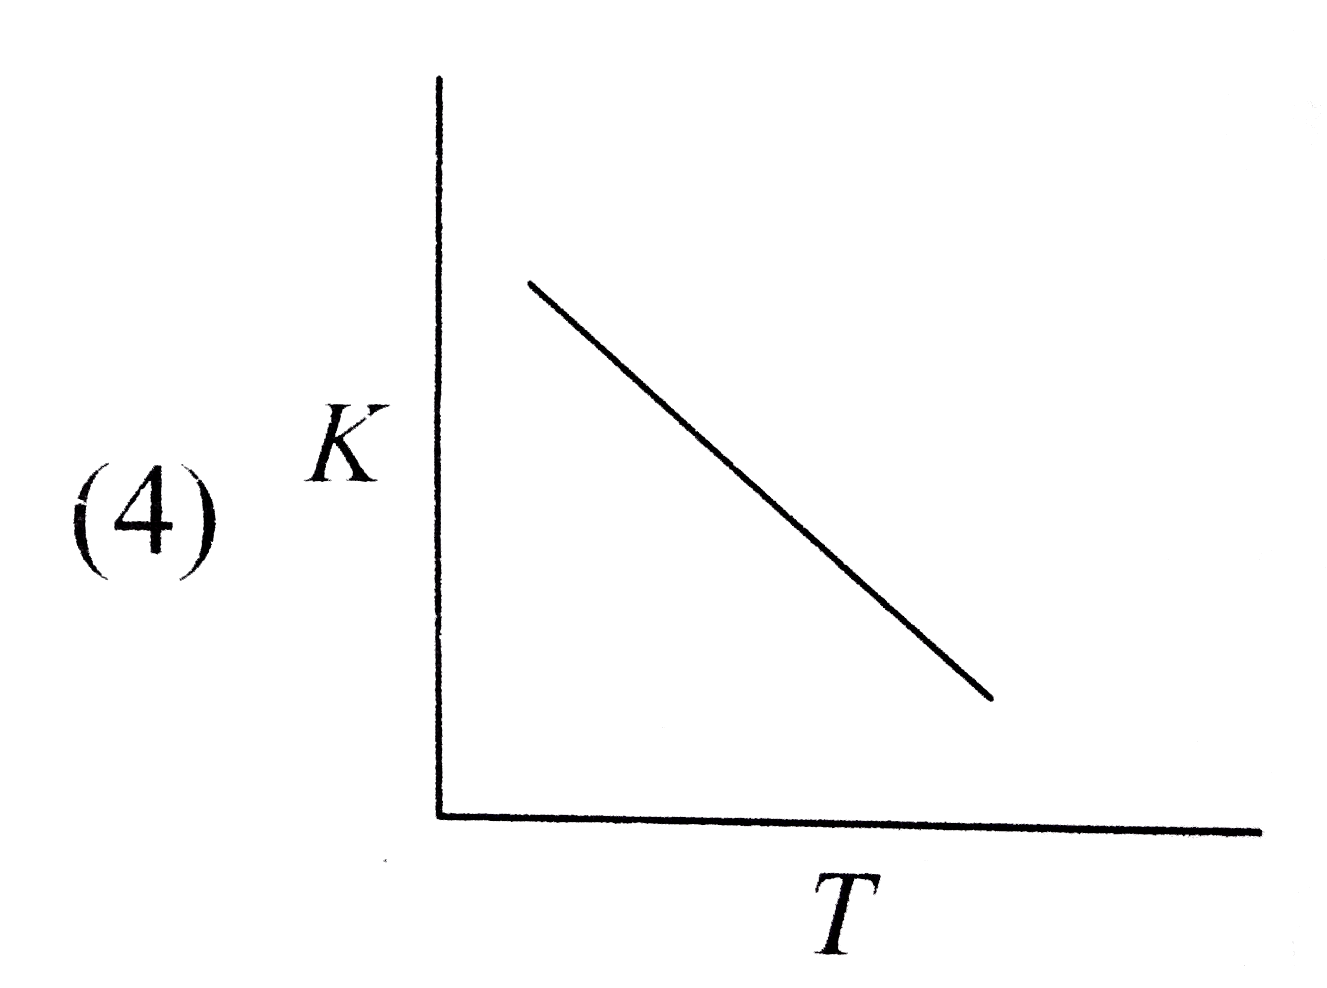
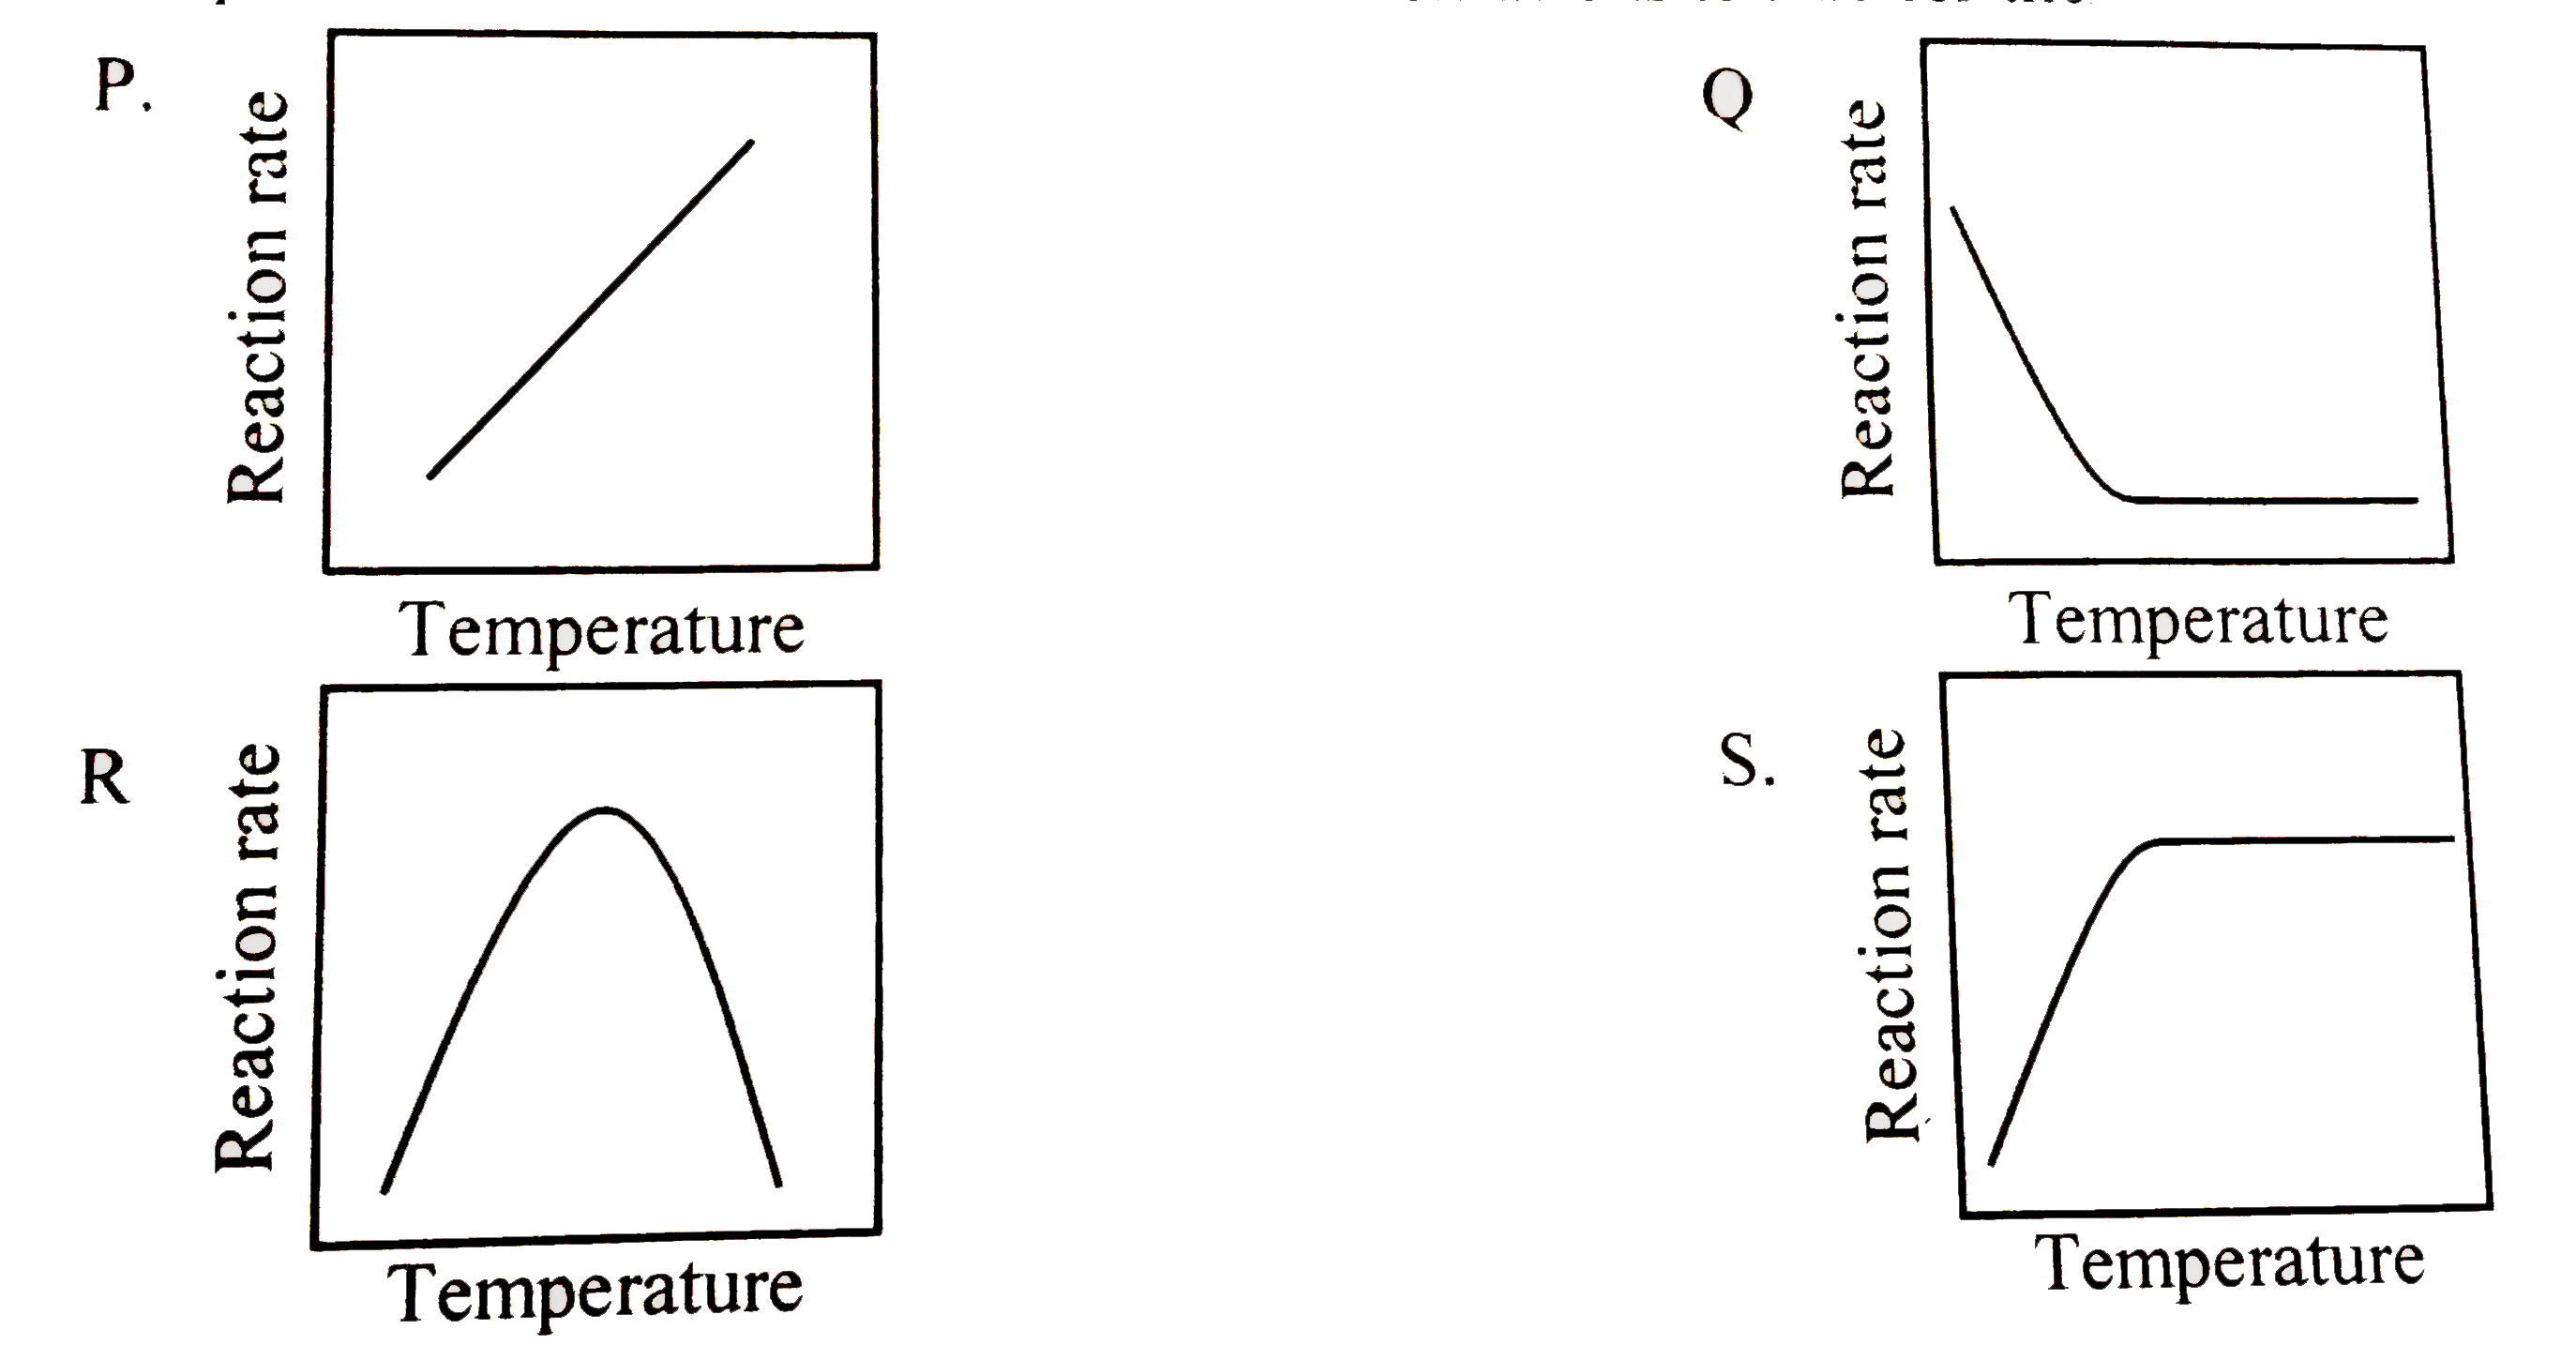
Which of the following graphs describes the typical dependence of the rate constant of a reaction on temperature ?
A
B
C
D
Video Solution
Text Solution
When we increases temperature (T) , the rate constant in most reaction increases exponetially in accordance with the Arrhenius equation, k=Ae−Ea/RT
|
Topper's Solved these Questions
- CHEMICAL KINETICSBOOK - R SHARMACHAPTER - CHEMICAL KINETICSEXERCISE - Follow-up 6
2 Videos
- CHEMICAL KINETICSBOOK - R SHARMACHAPTER - CHEMICAL KINETICSEXERCISE - Question Bank (Building the knowledge)
53 Videos
- CHEMICAL KINETICSBOOK - R SHARMACHAPTER - CHEMICAL KINETICSEXERCISE - Follow-up 4
20 Videos
- BIOMOLECULESBOOK - R SHARMACHAPTER - BIOMOLECULESEXERCISE - Archives
47 Videos
- CHEMISTRY IN EVERYDAY LIFEBOOK - R SHARMACHAPTER - CHEMISTRY IN EVERYDAY LIFEEXERCISE - Archives
11 Videos
Similar Questions
Knowledge Check
The rate constant of a reaction depends on
ATemperatureBInitial concentration of the reactionsCTime of reactionDExtent of reactionThe rate constant of a reaction depends on
ATemperatureBInitial concentration of the reactantCTime of reactionDExtent of reactionThe rate constant of a reaction depends on
ATemperatureBMassCWeightDTime
Arrhenius equation is :
k=Ae−E/RT
Which of the following graphs represents the variation of rate constant k against temperatureT ?
View SolutionGiven below are the four schematic that describe the dependence of the rate of an enzymatic reaction on temperature which of the following combinations is true for thermophilic and psychrophilic organisms ?
View SolutionWhich of the following expression gives the effect of temperature on the rate constant?
View SolutionWhich of the following expresisons give the effect of temperature on the rate constant?
View SolutionWhich of the following changes to a reaction will always increase the rate constant for that reaction?
View Solution
