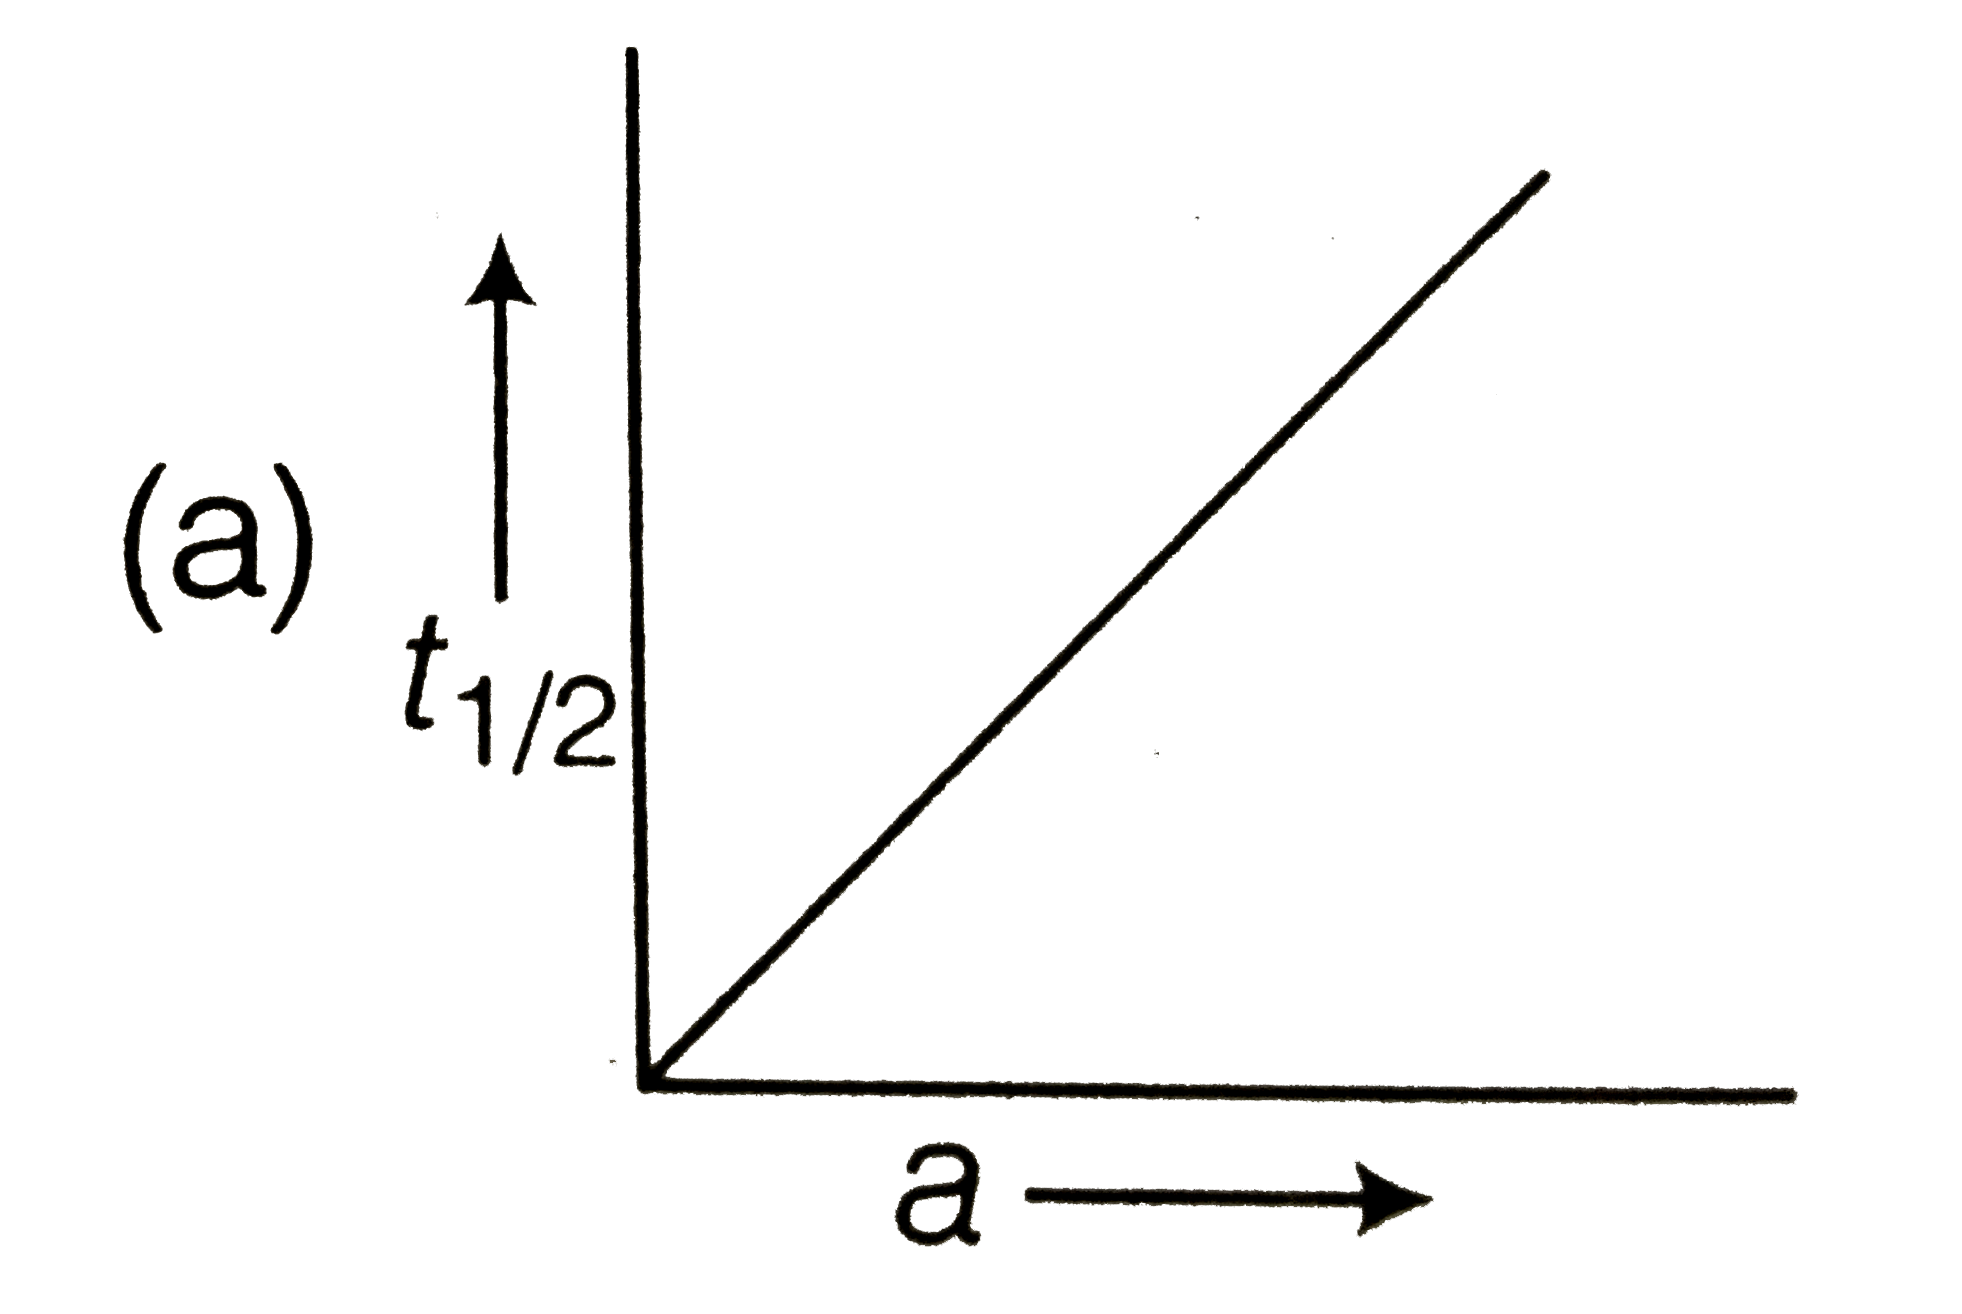
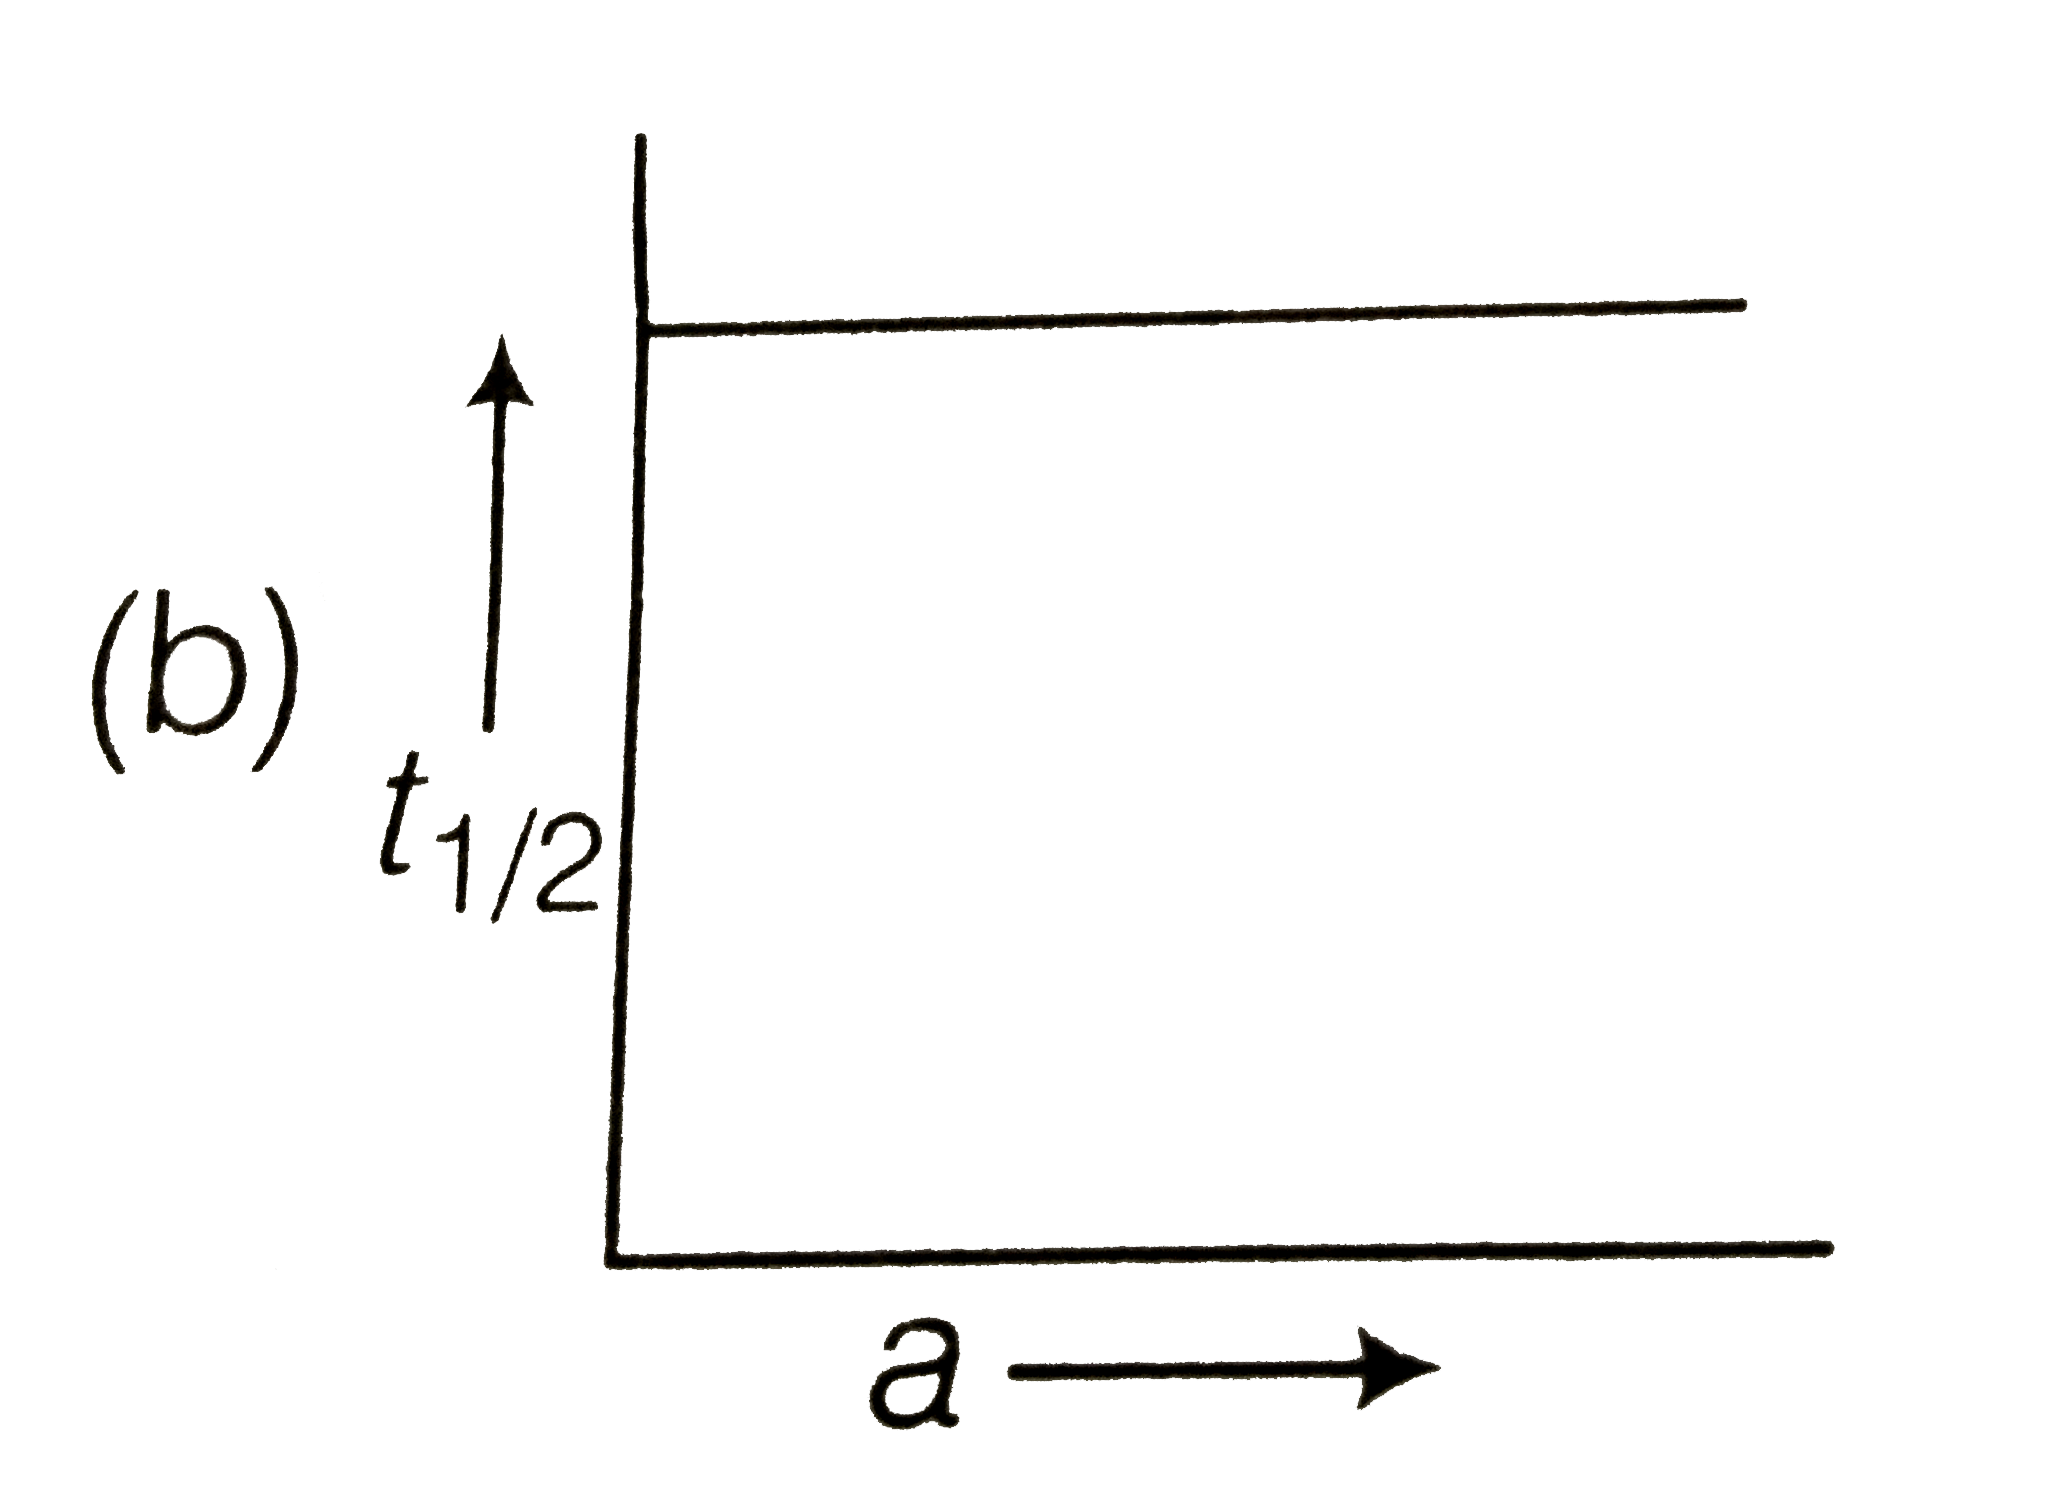
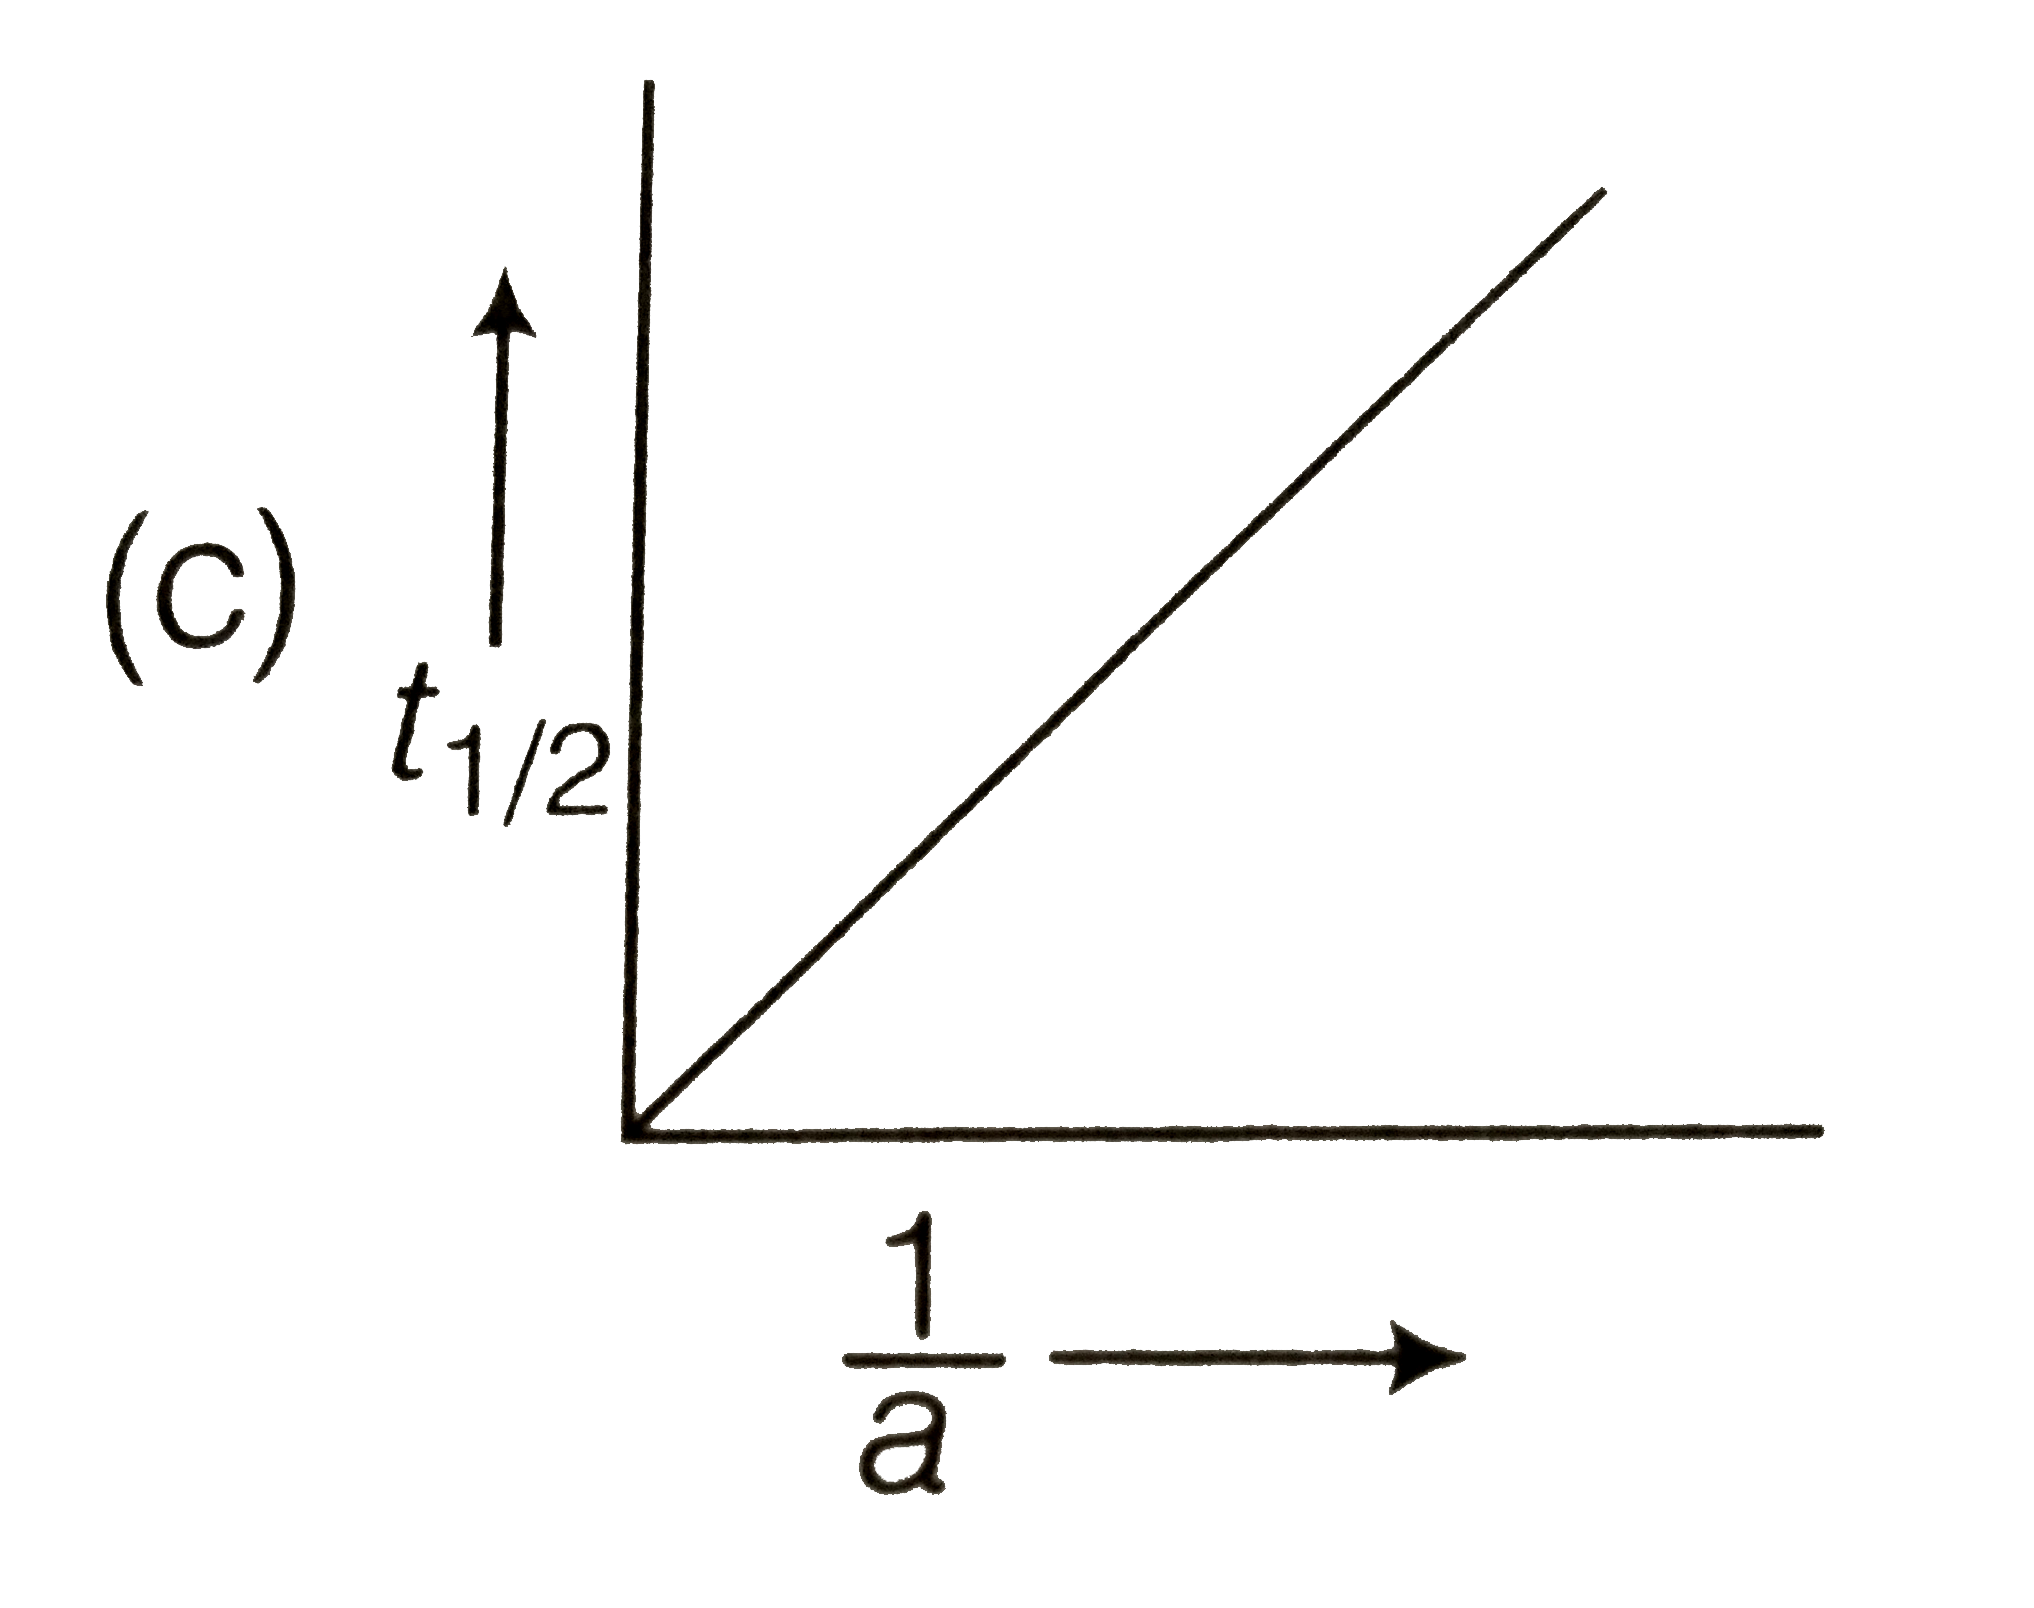
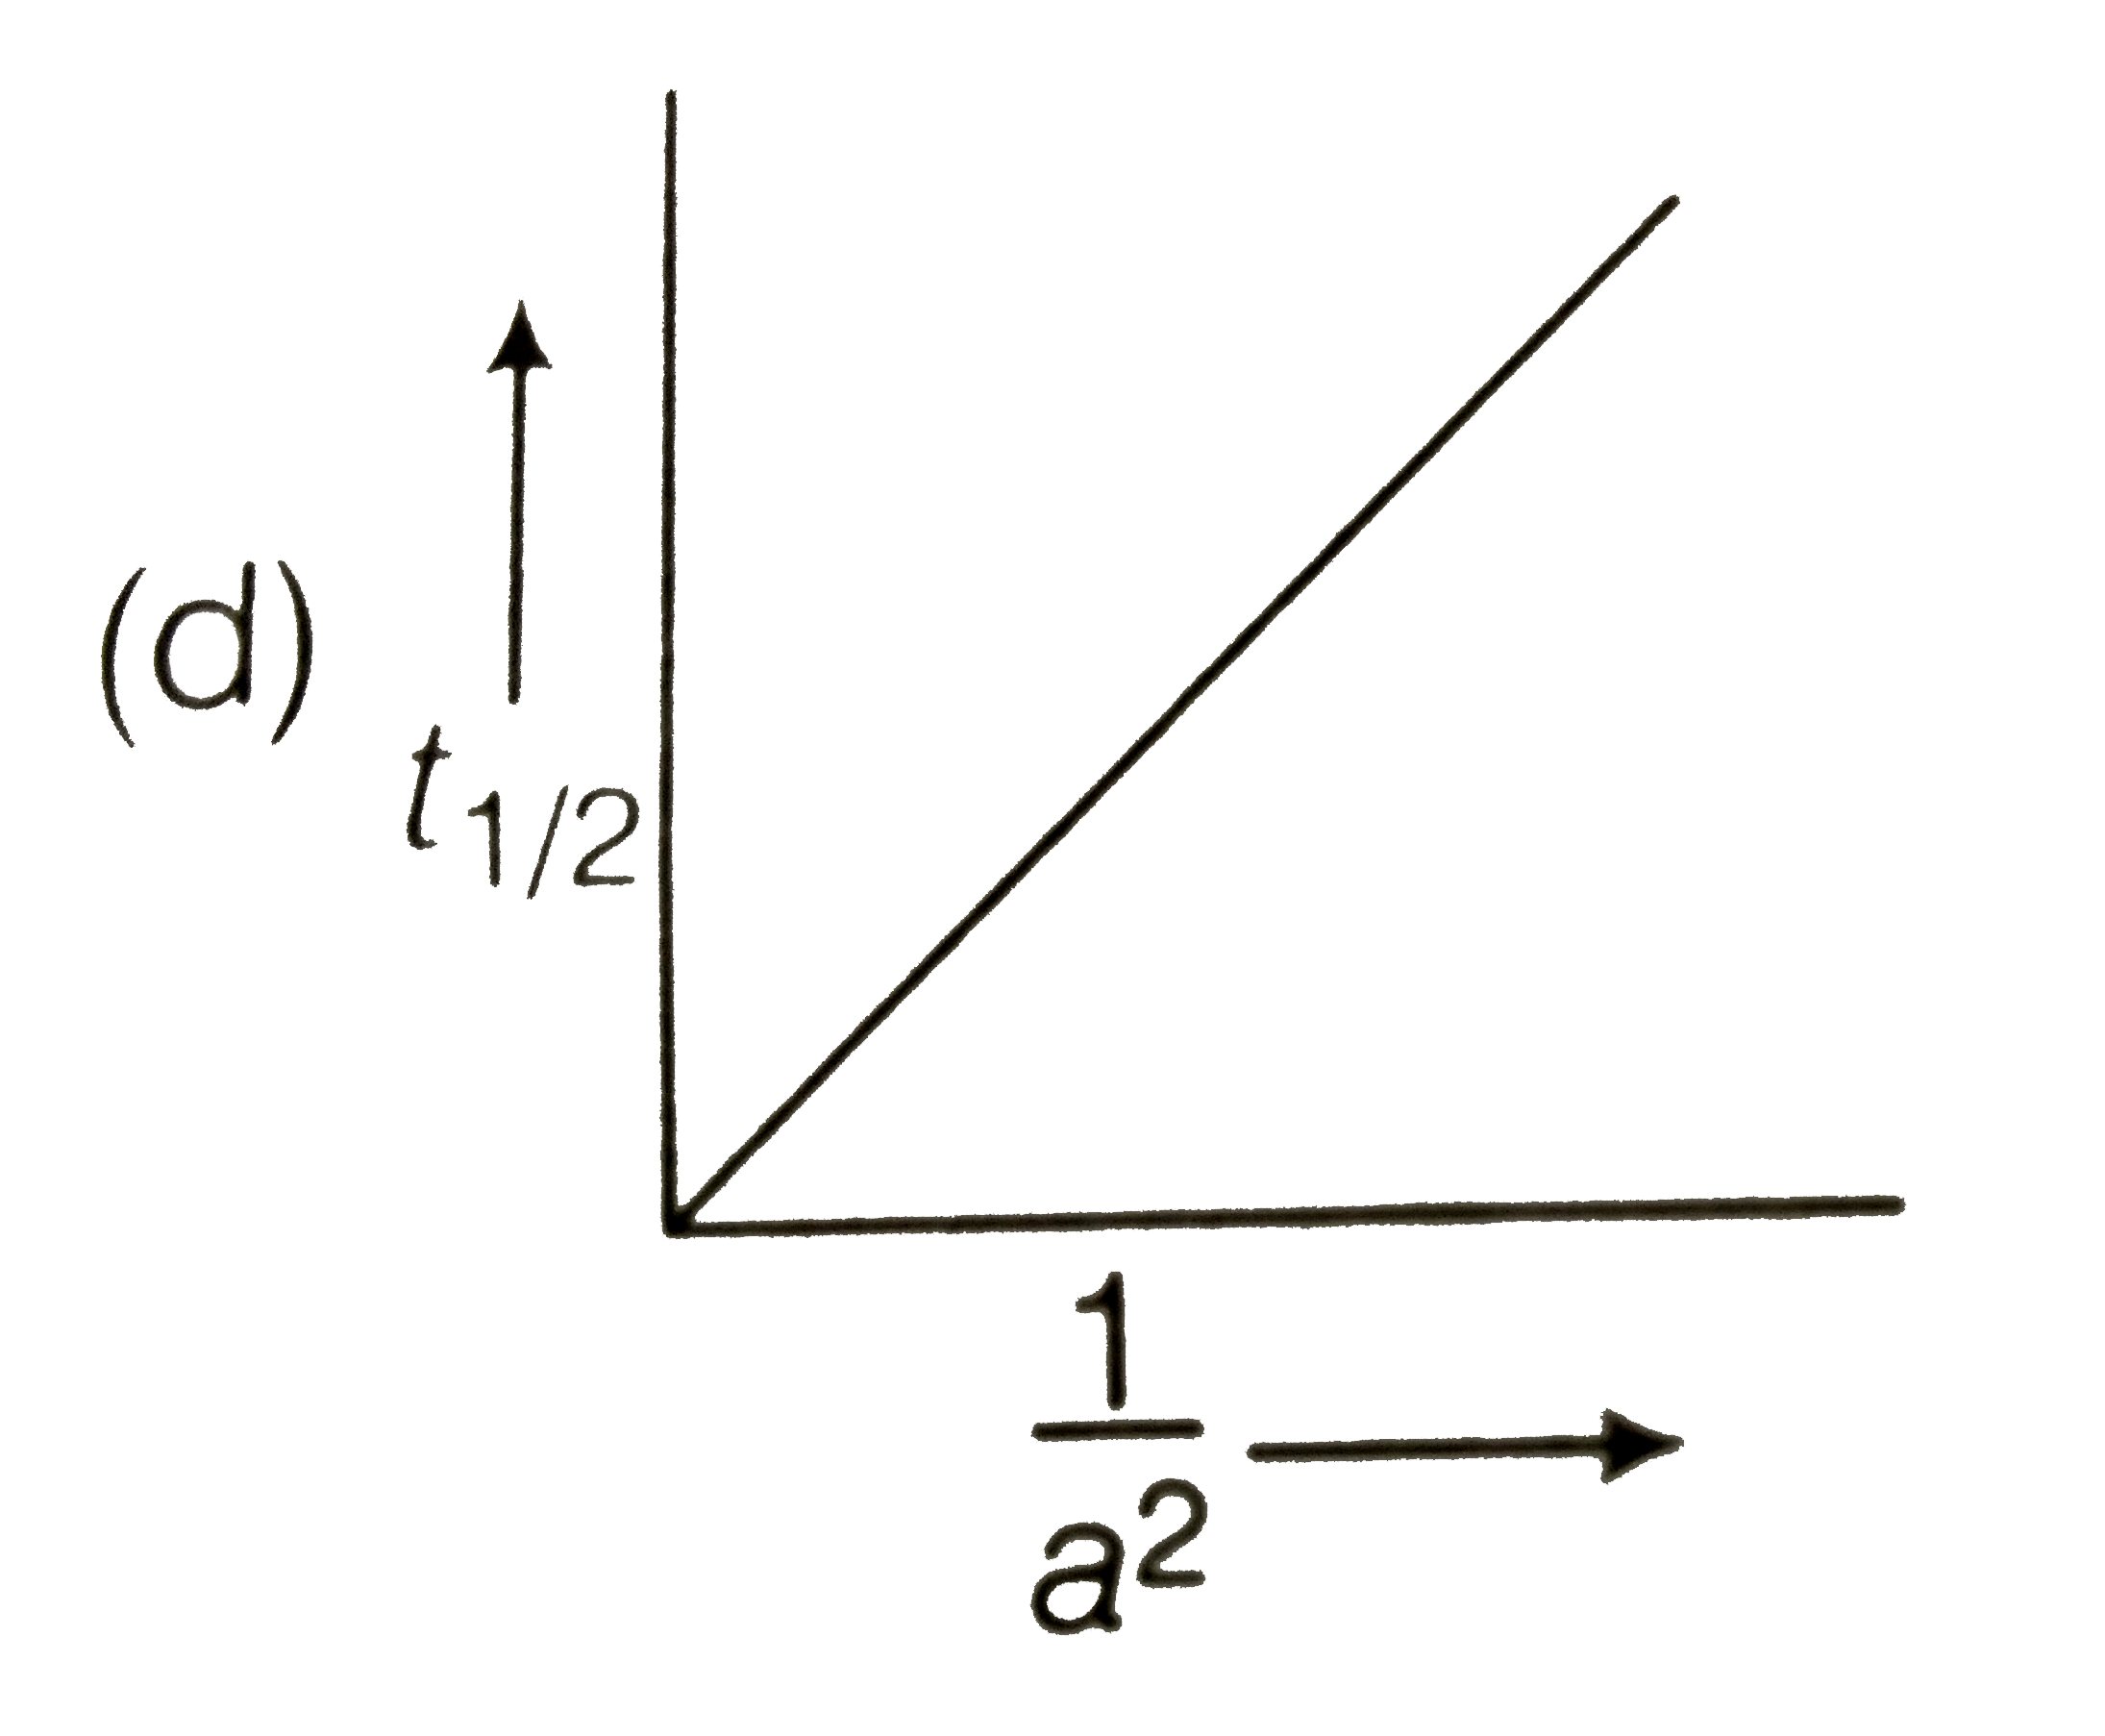
Which of the following graphs formed plotted between t1/2 and initial concentration (a) represents a zero order reaction ?
The correct Answer is:A
To determine which graph represents a zero-order reaction when plotting half-life (t1/2) against initial concentration (A0), we can follow these steps:
Step 1: Understand the relationship for zero-order reactions
For a zero-order reaction, the half-life (t1/2) is given by the formula:
t1/2=A02k
where:
- t1/2 = half-life
- A0 = initial concentration
- k = rate constant
Step 2: Analyze the relationship
From the formula, we can see that the half-life (t1/2) is directly proportional to the initial concentration (A0). This means that as the initial concentration increases, the half-life also increases.
Step 3: Rewrite the relationship
We can express this relationship as:
t1/2=12k⋅A0
This indicates that if we plot t1/2 (y-axis) against A0 (x-axis), we will have a linear relationship.
Step 4: Identify the characteristics of the graph
Since the relationship is linear, the graph will be a straight line. The slope of the line will be 12k, and it will pass through the origin (0,0) because when A0=0, t1/2 will also be 0.
Step 5: Conclusion
Thus, the graph that represents a zero-order reaction when plotting t1/2 against initial concentration A0 will be a straight line passing through the origin.
Final Answer
The correct option is the first option, which represents a straight line graph passing through the origin.
---
For a zero-order reaction, the half-life (t1/2) is given by the formula:
t1/2=A02k
where:
- t1/2 = half-life
- A0 = initial concentration
- k = rate constant
From the formula, we can see that the half-life (t1/2) is directly proportional to the initial concentration (A0). This means that as the initial concentration increases, the half-life also increases.
We can express this relationship as:
t1/2=12k⋅A0
This indicates that if we plot t1/2 (y-axis) against A0 (x-axis), we will have a linear relationship.
Since the relationship is linear, the graph will be a straight line. The slope of the line will be 12k, and it will pass through the origin (0,0) because when A0=0, t1/2 will also be 0.
Thus, the graph that represents a zero-order reaction when plotting t1/2 against initial concentration A0 will be a straight line passing through the origin.
The correct option is the first option, which represents a straight line graph passing through the origin.
Topper's Solved these Questions
Similar Questions
Knowledge Check
The plot that represents the zero order reaction is:
A B
B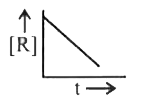 C
C D
D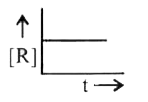
Which of the following represents zero order reaction ?
A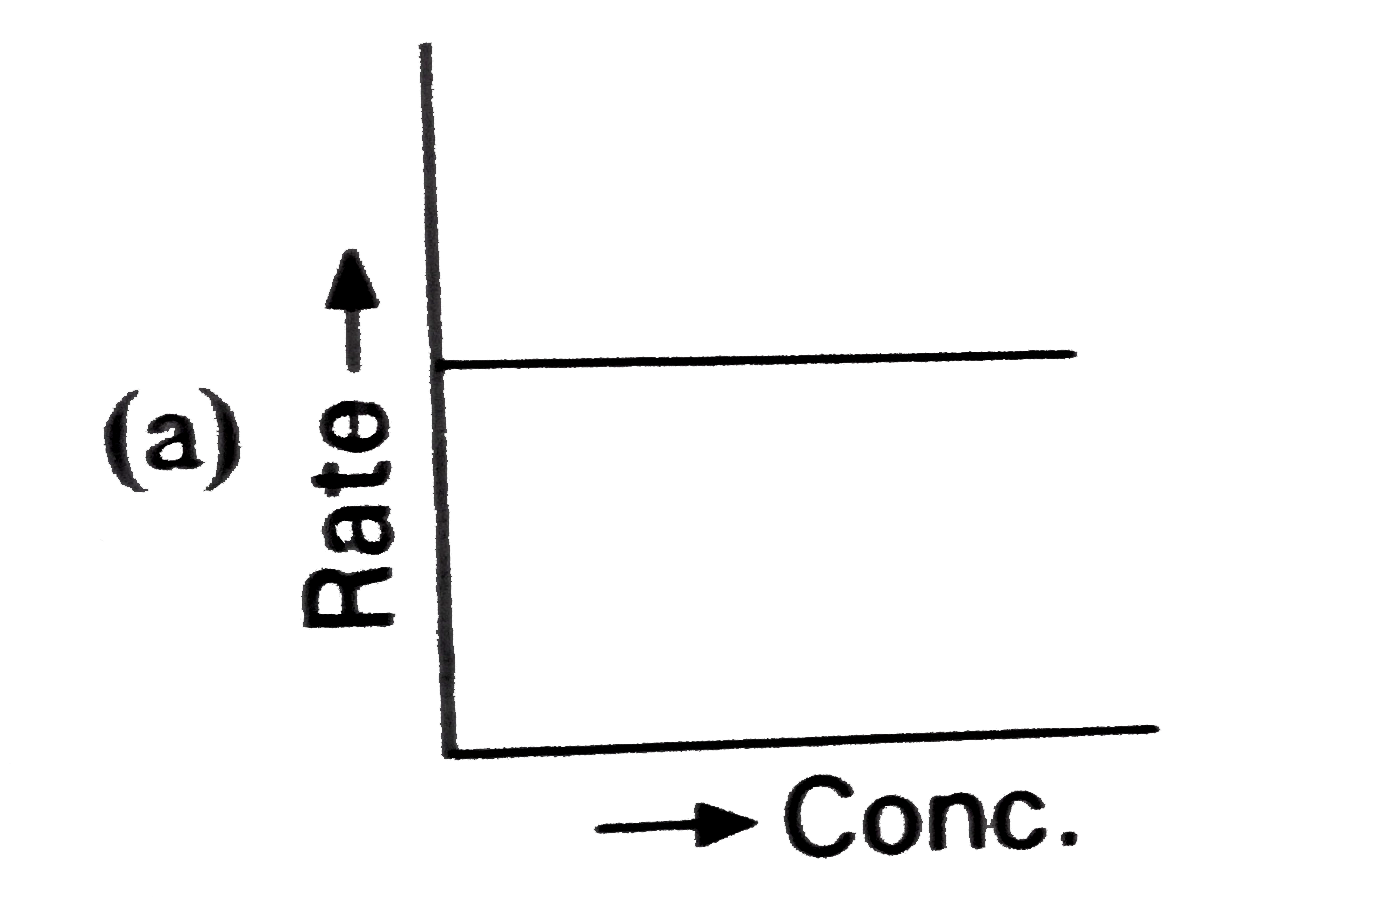 B
B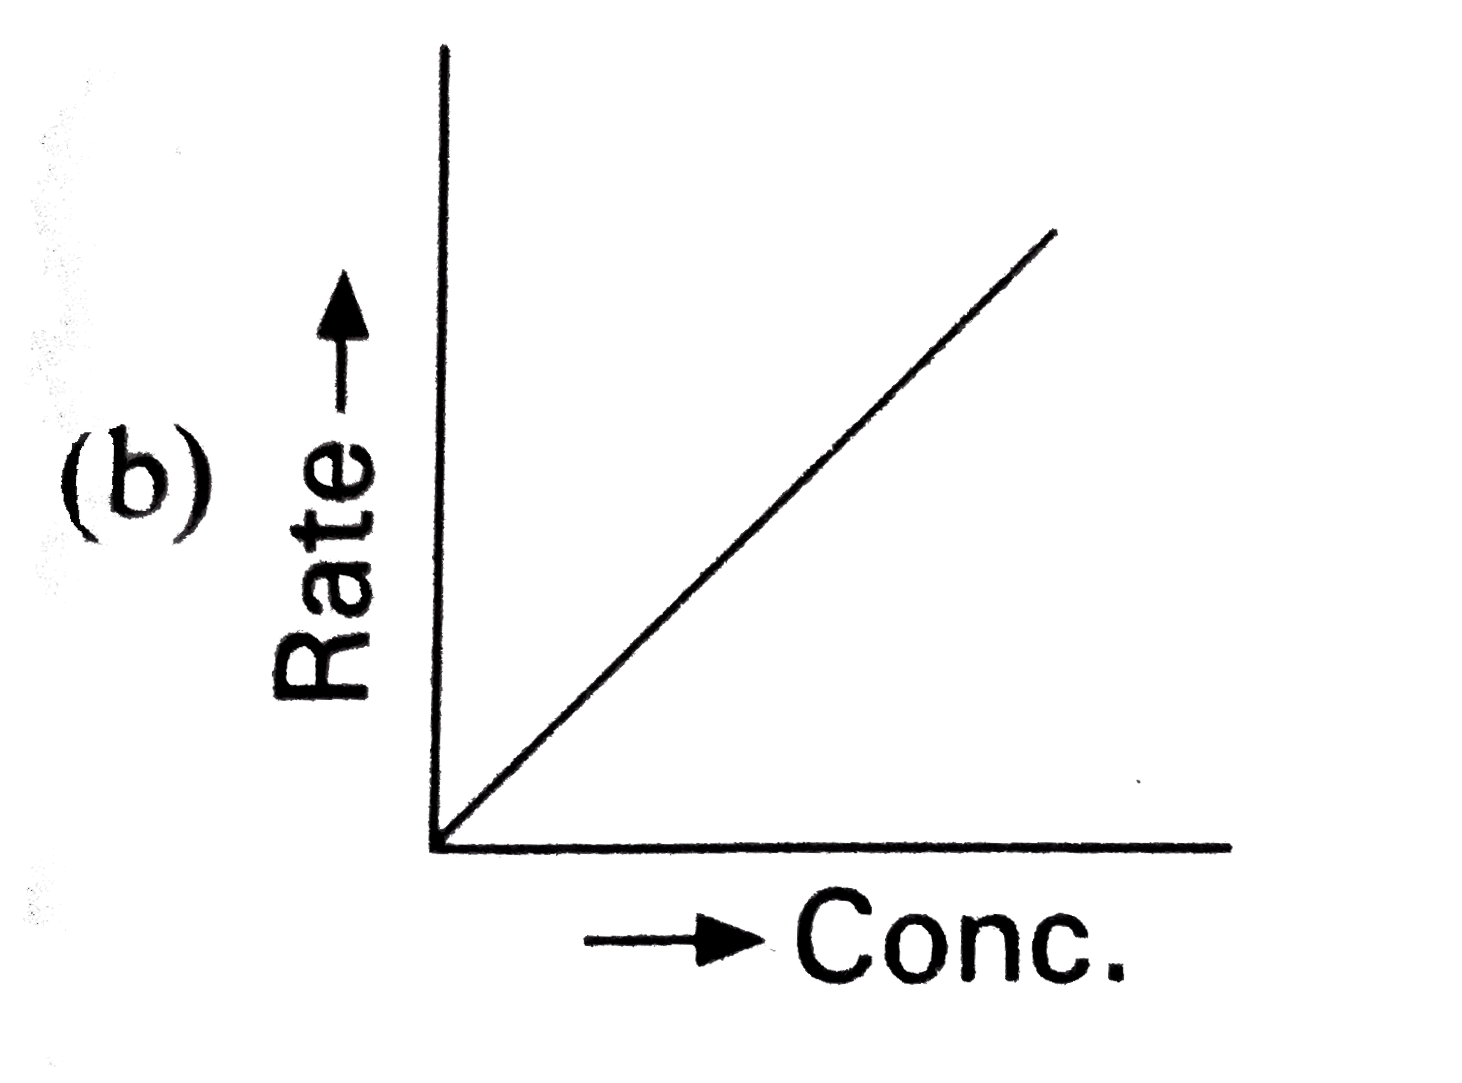 C
C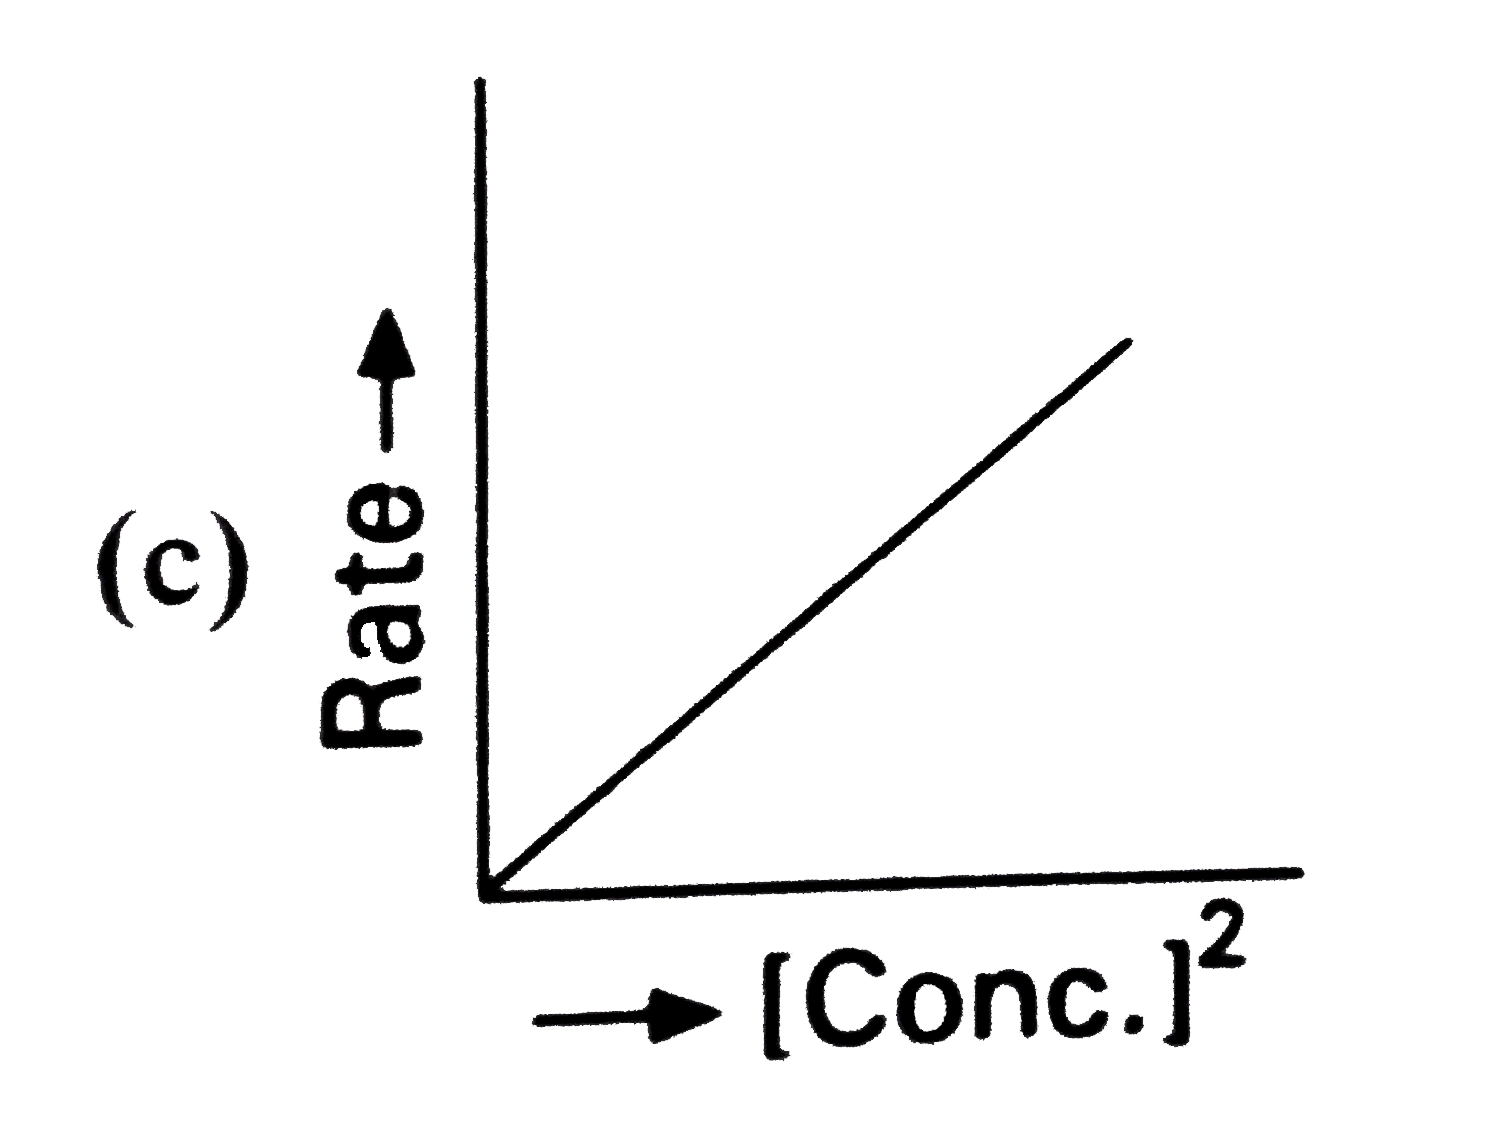 D
D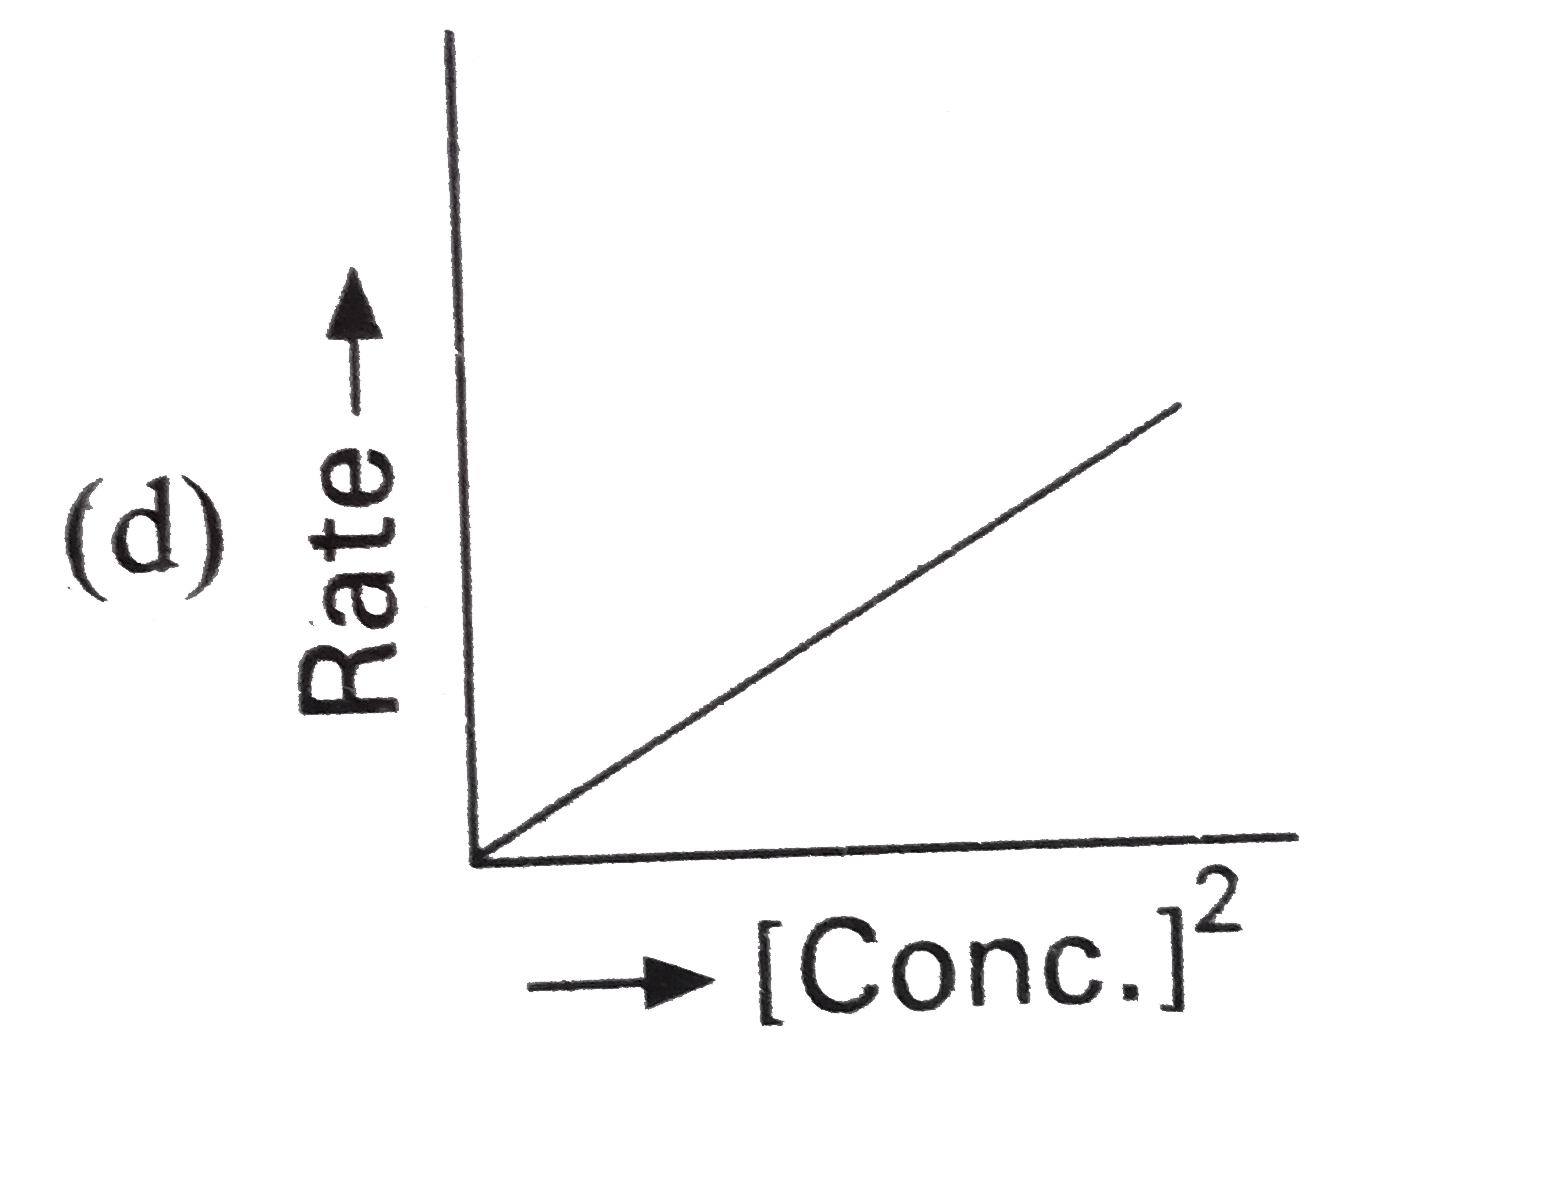
Which of the following graphs is not for zero order reaction?
A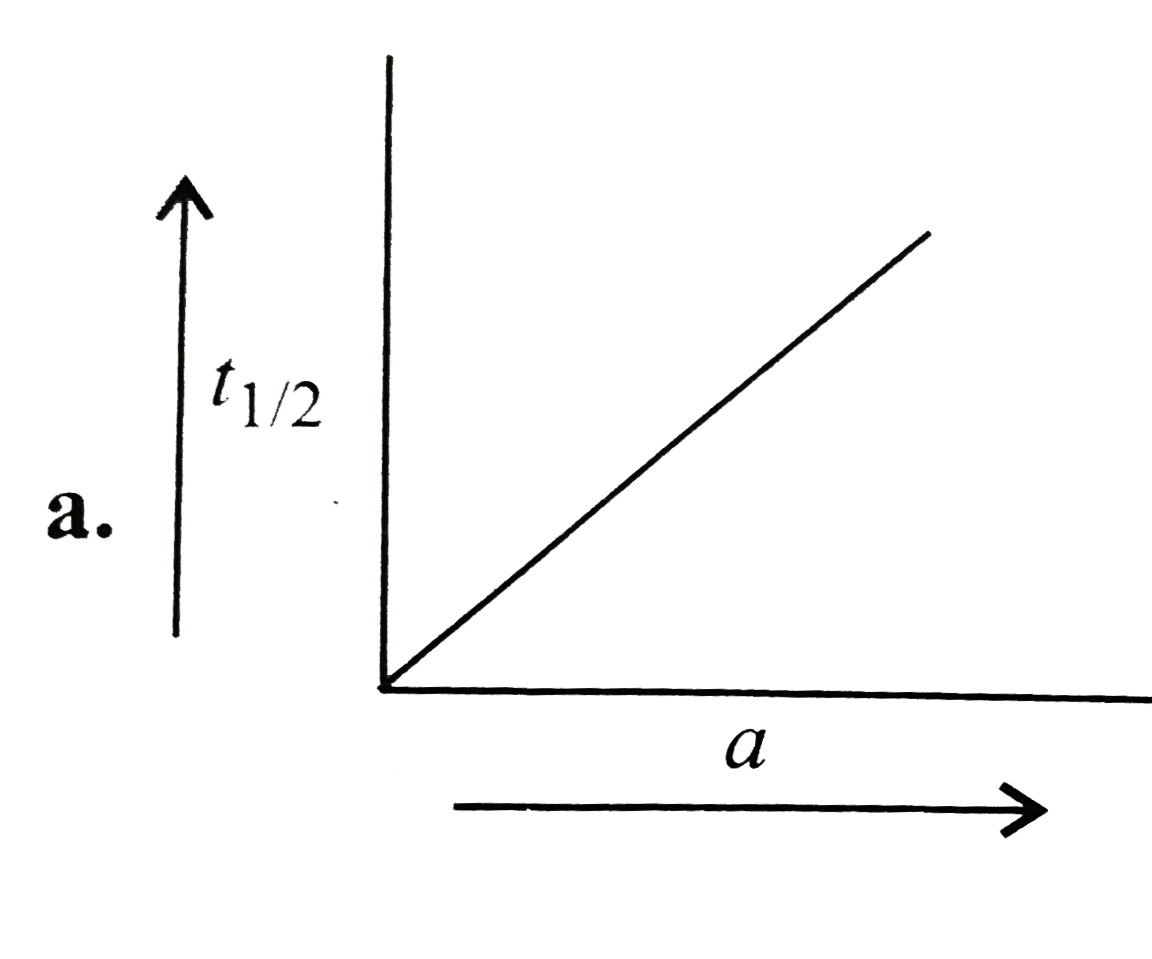 B
B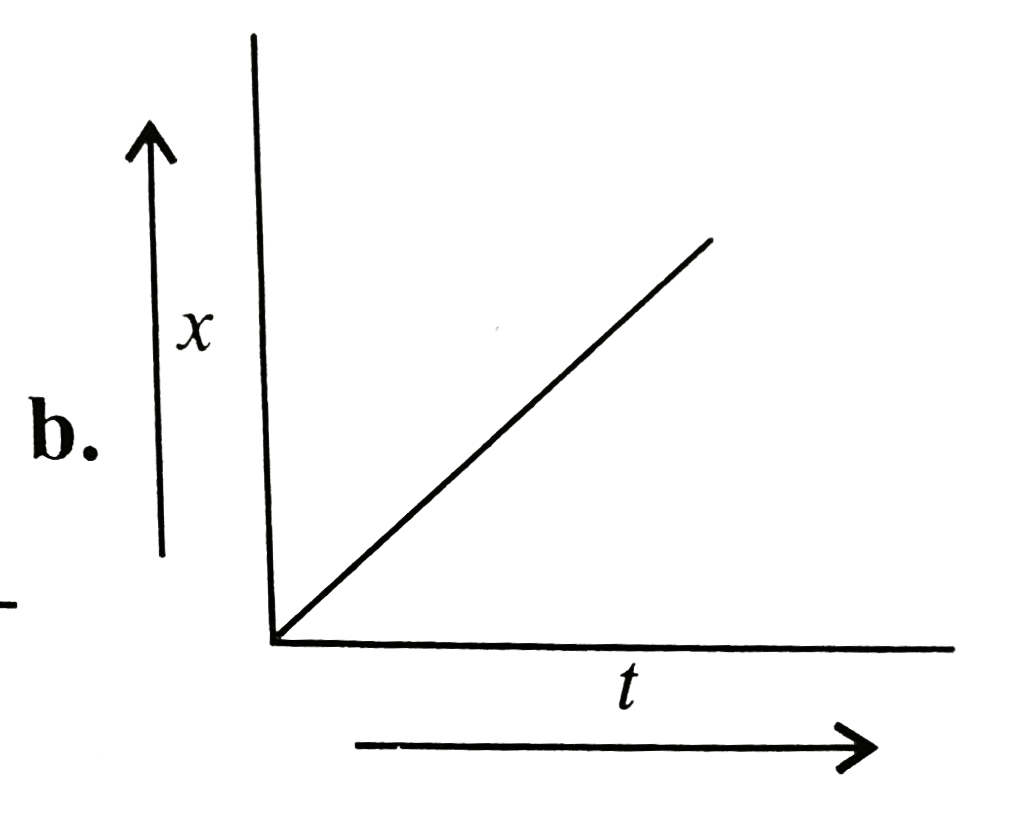 C
C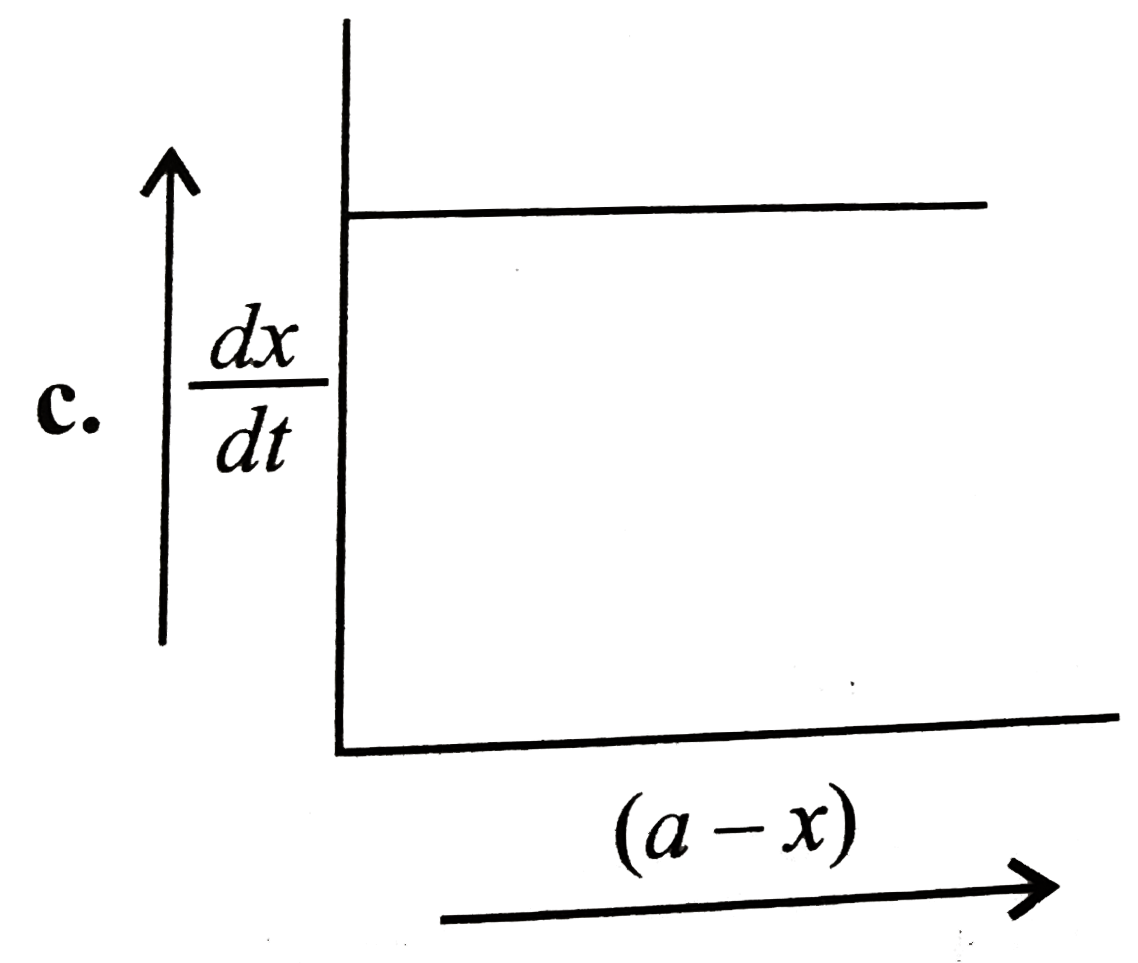 D
D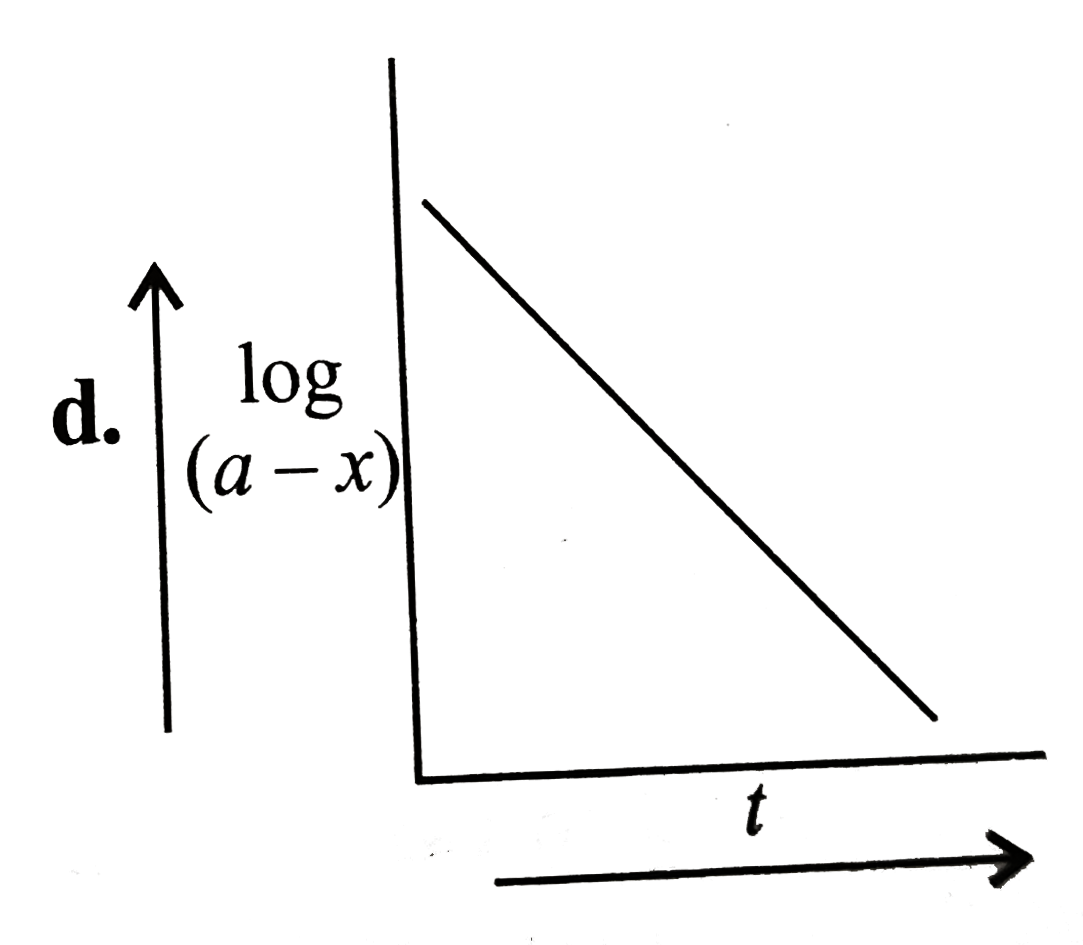
Which of the following graph is correct for zero order reaction?
View SolutionWhich of the following graphs represents a first order reaction ?
View SolutionWhich concentration plot is linear for a first order reaction?
View SolutionWhich of the following is correct representation of the variation of half - life with initial concentration of a zero order reaction ?
View SolutionWhich of the following graphs is not for zero order reaction?
View Solution
