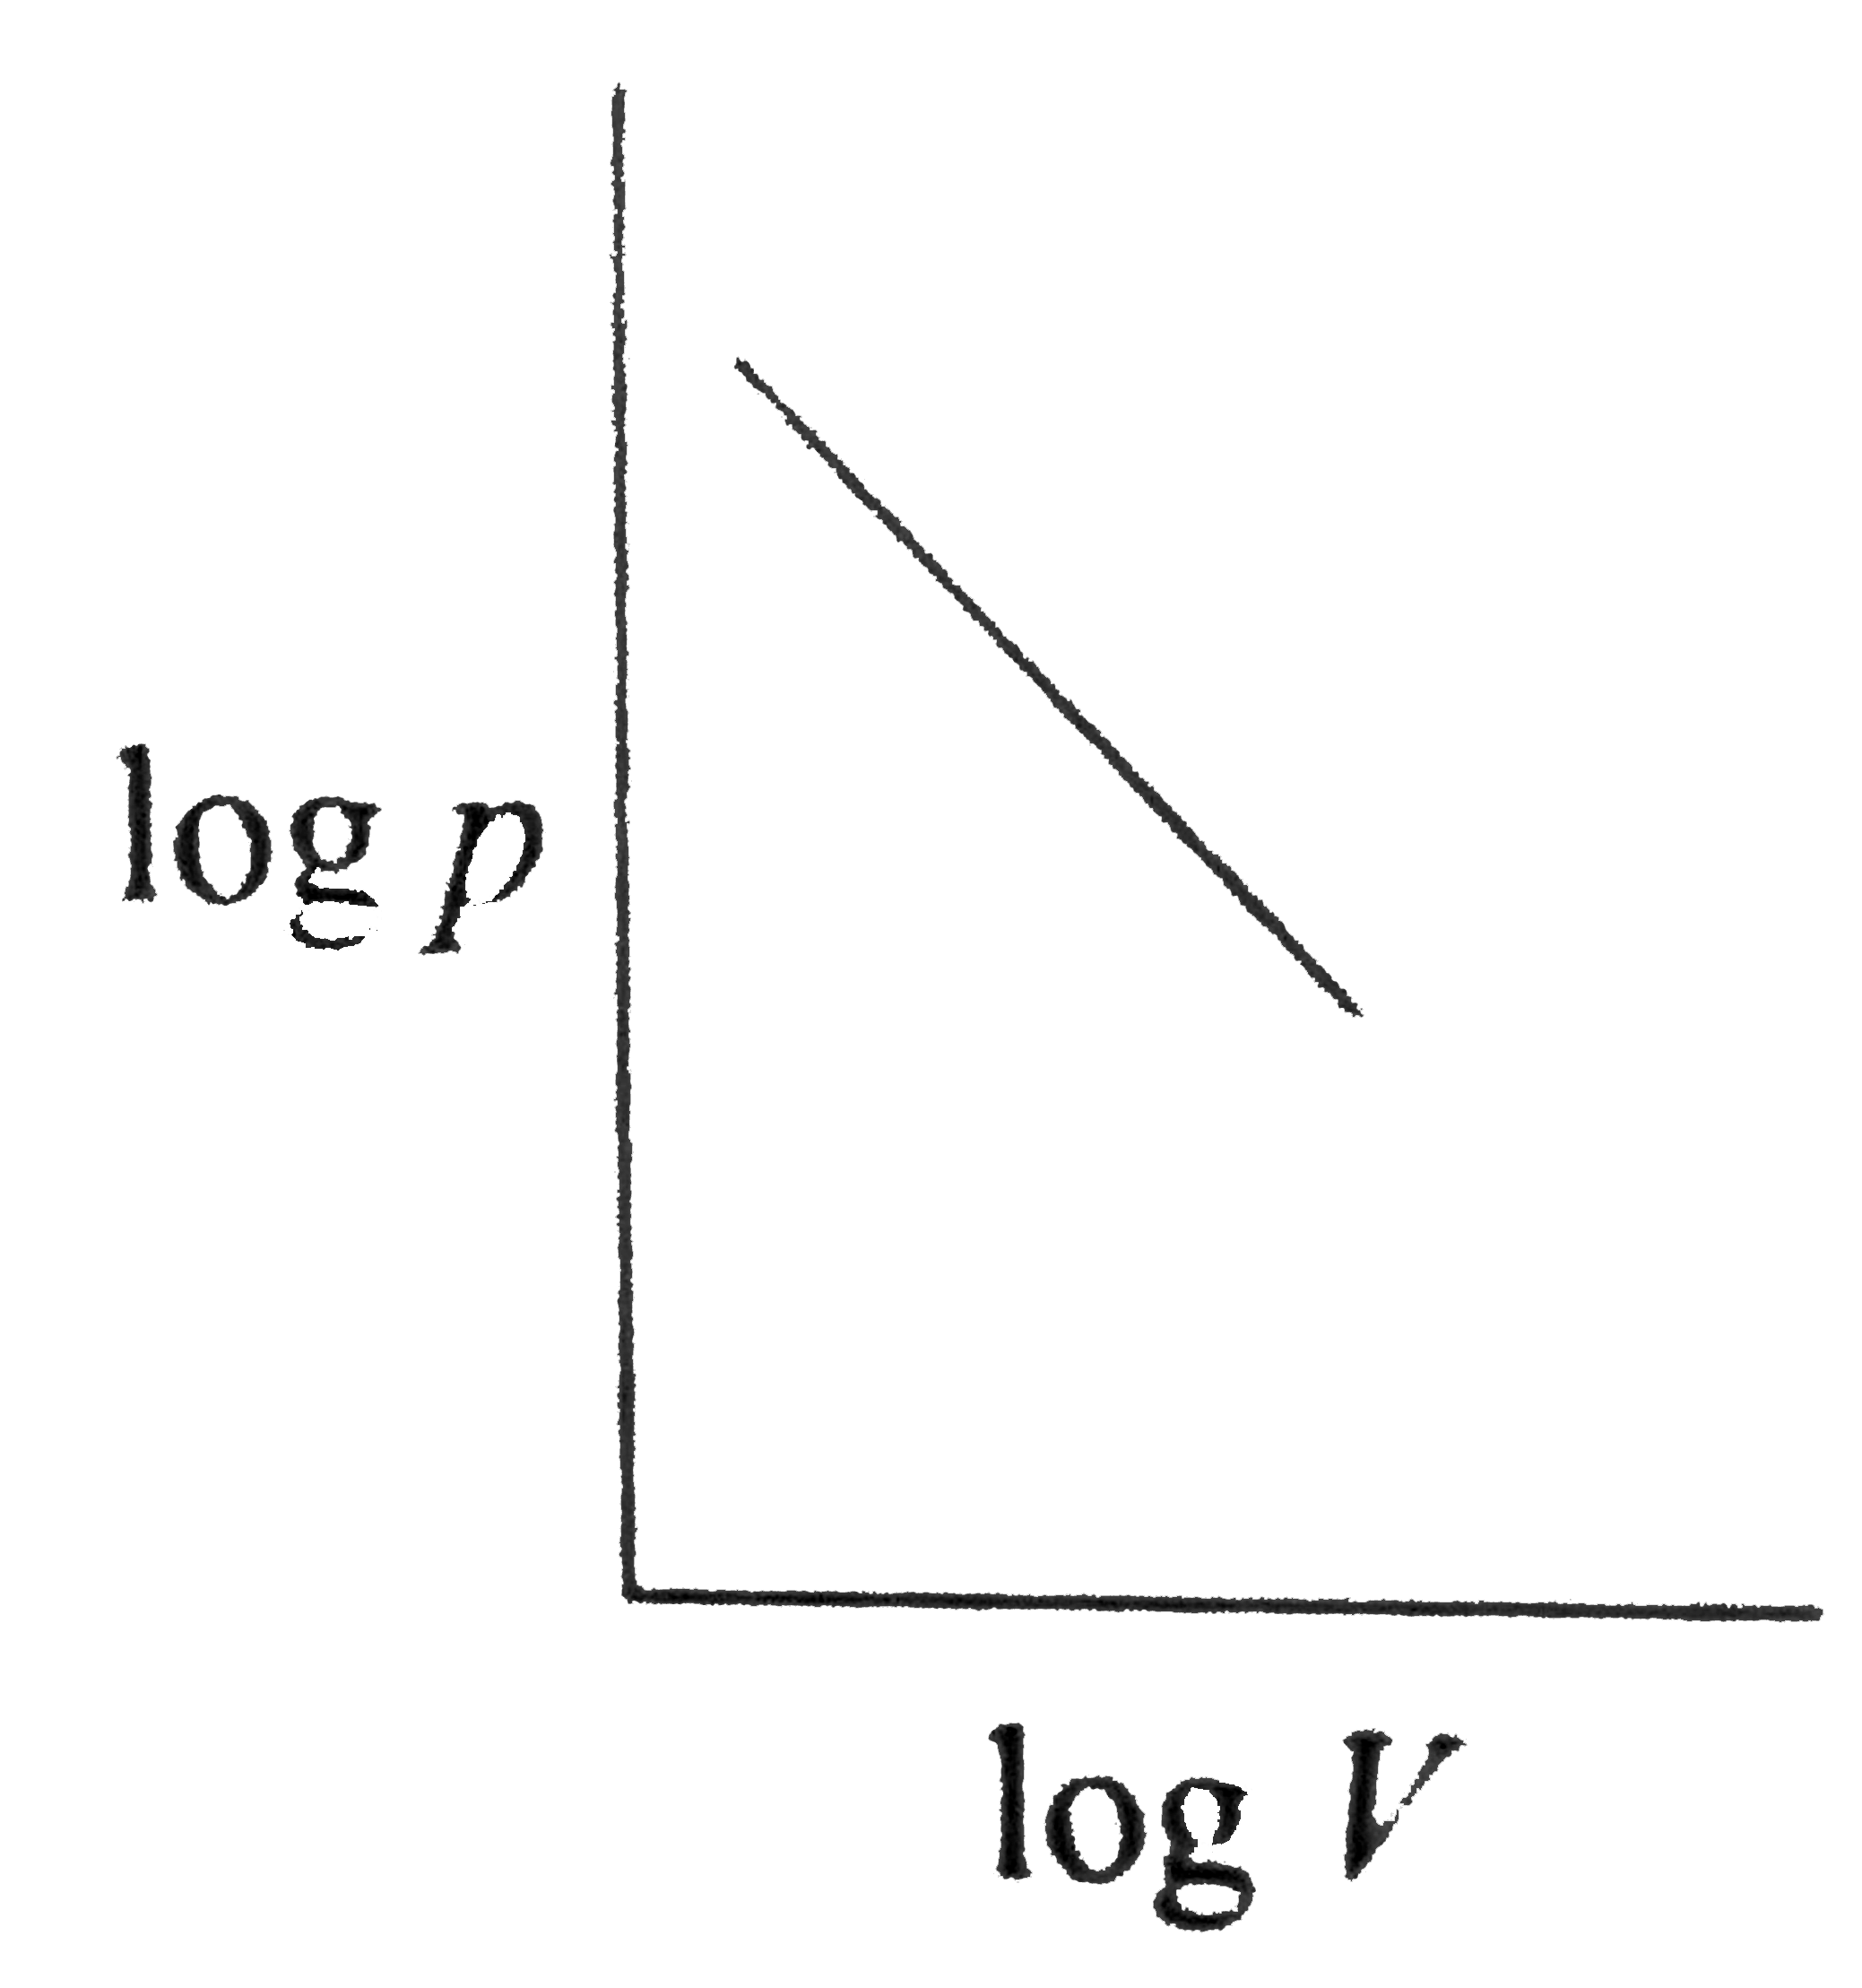
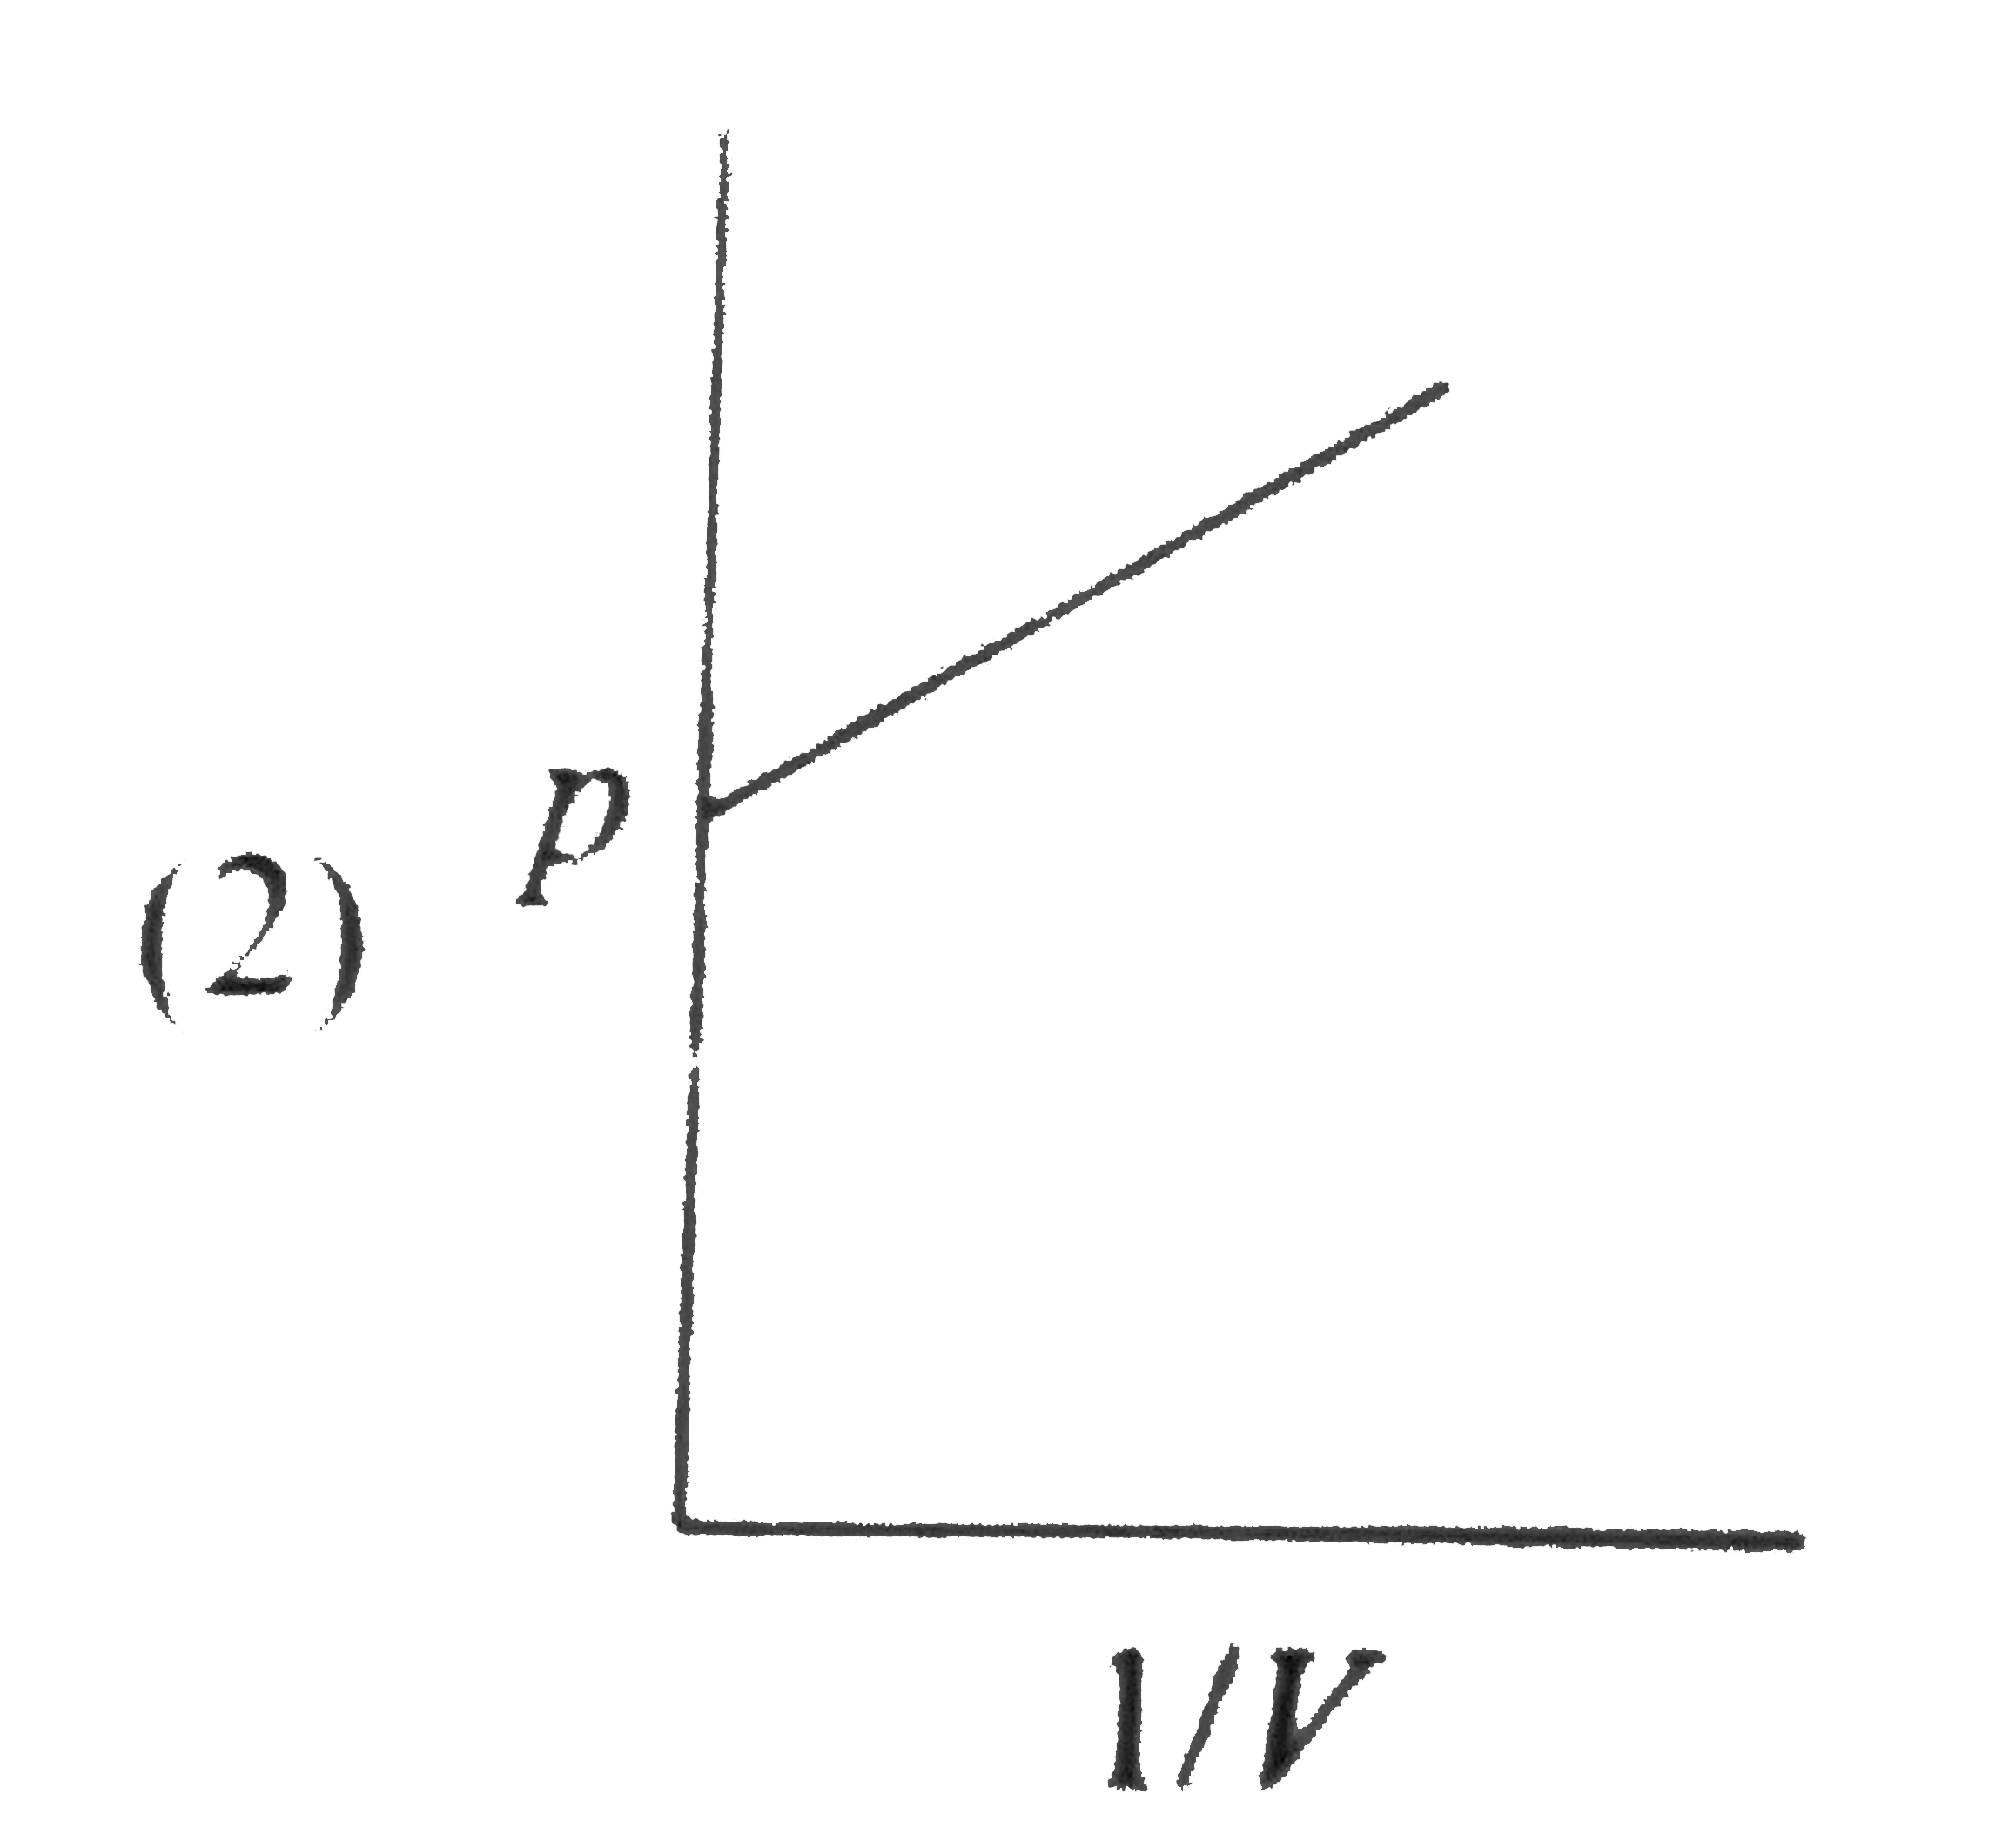
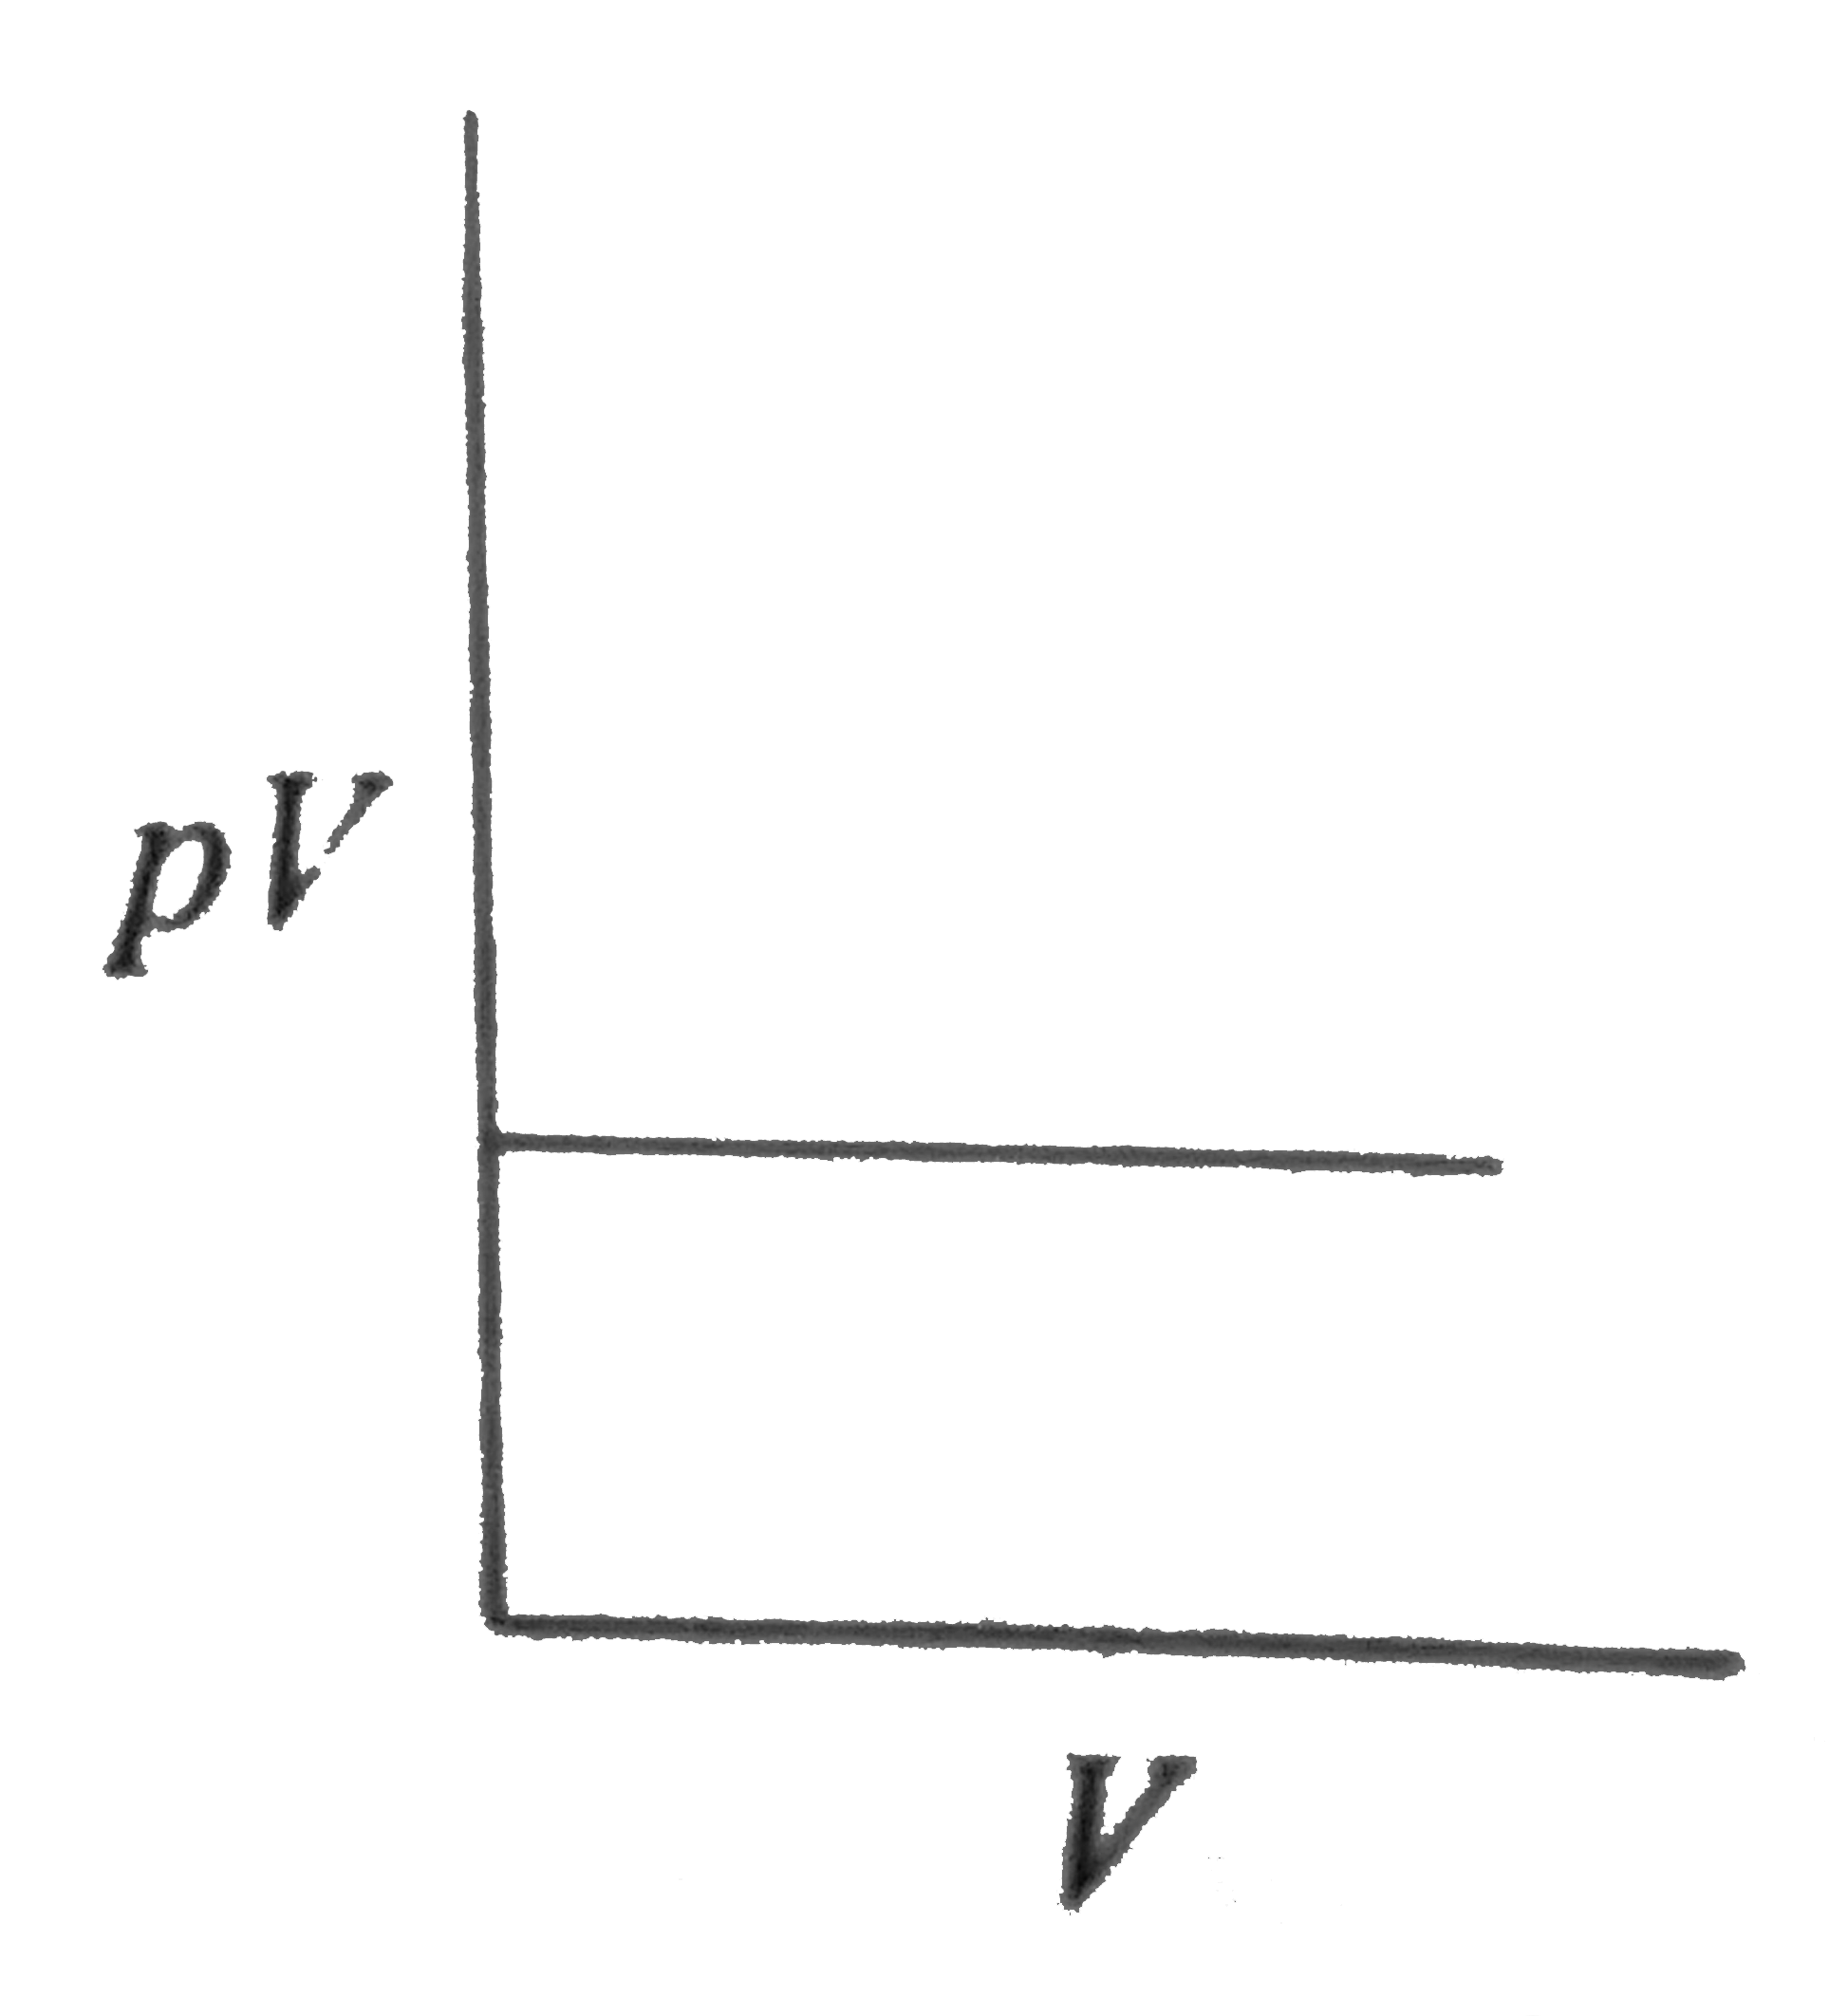
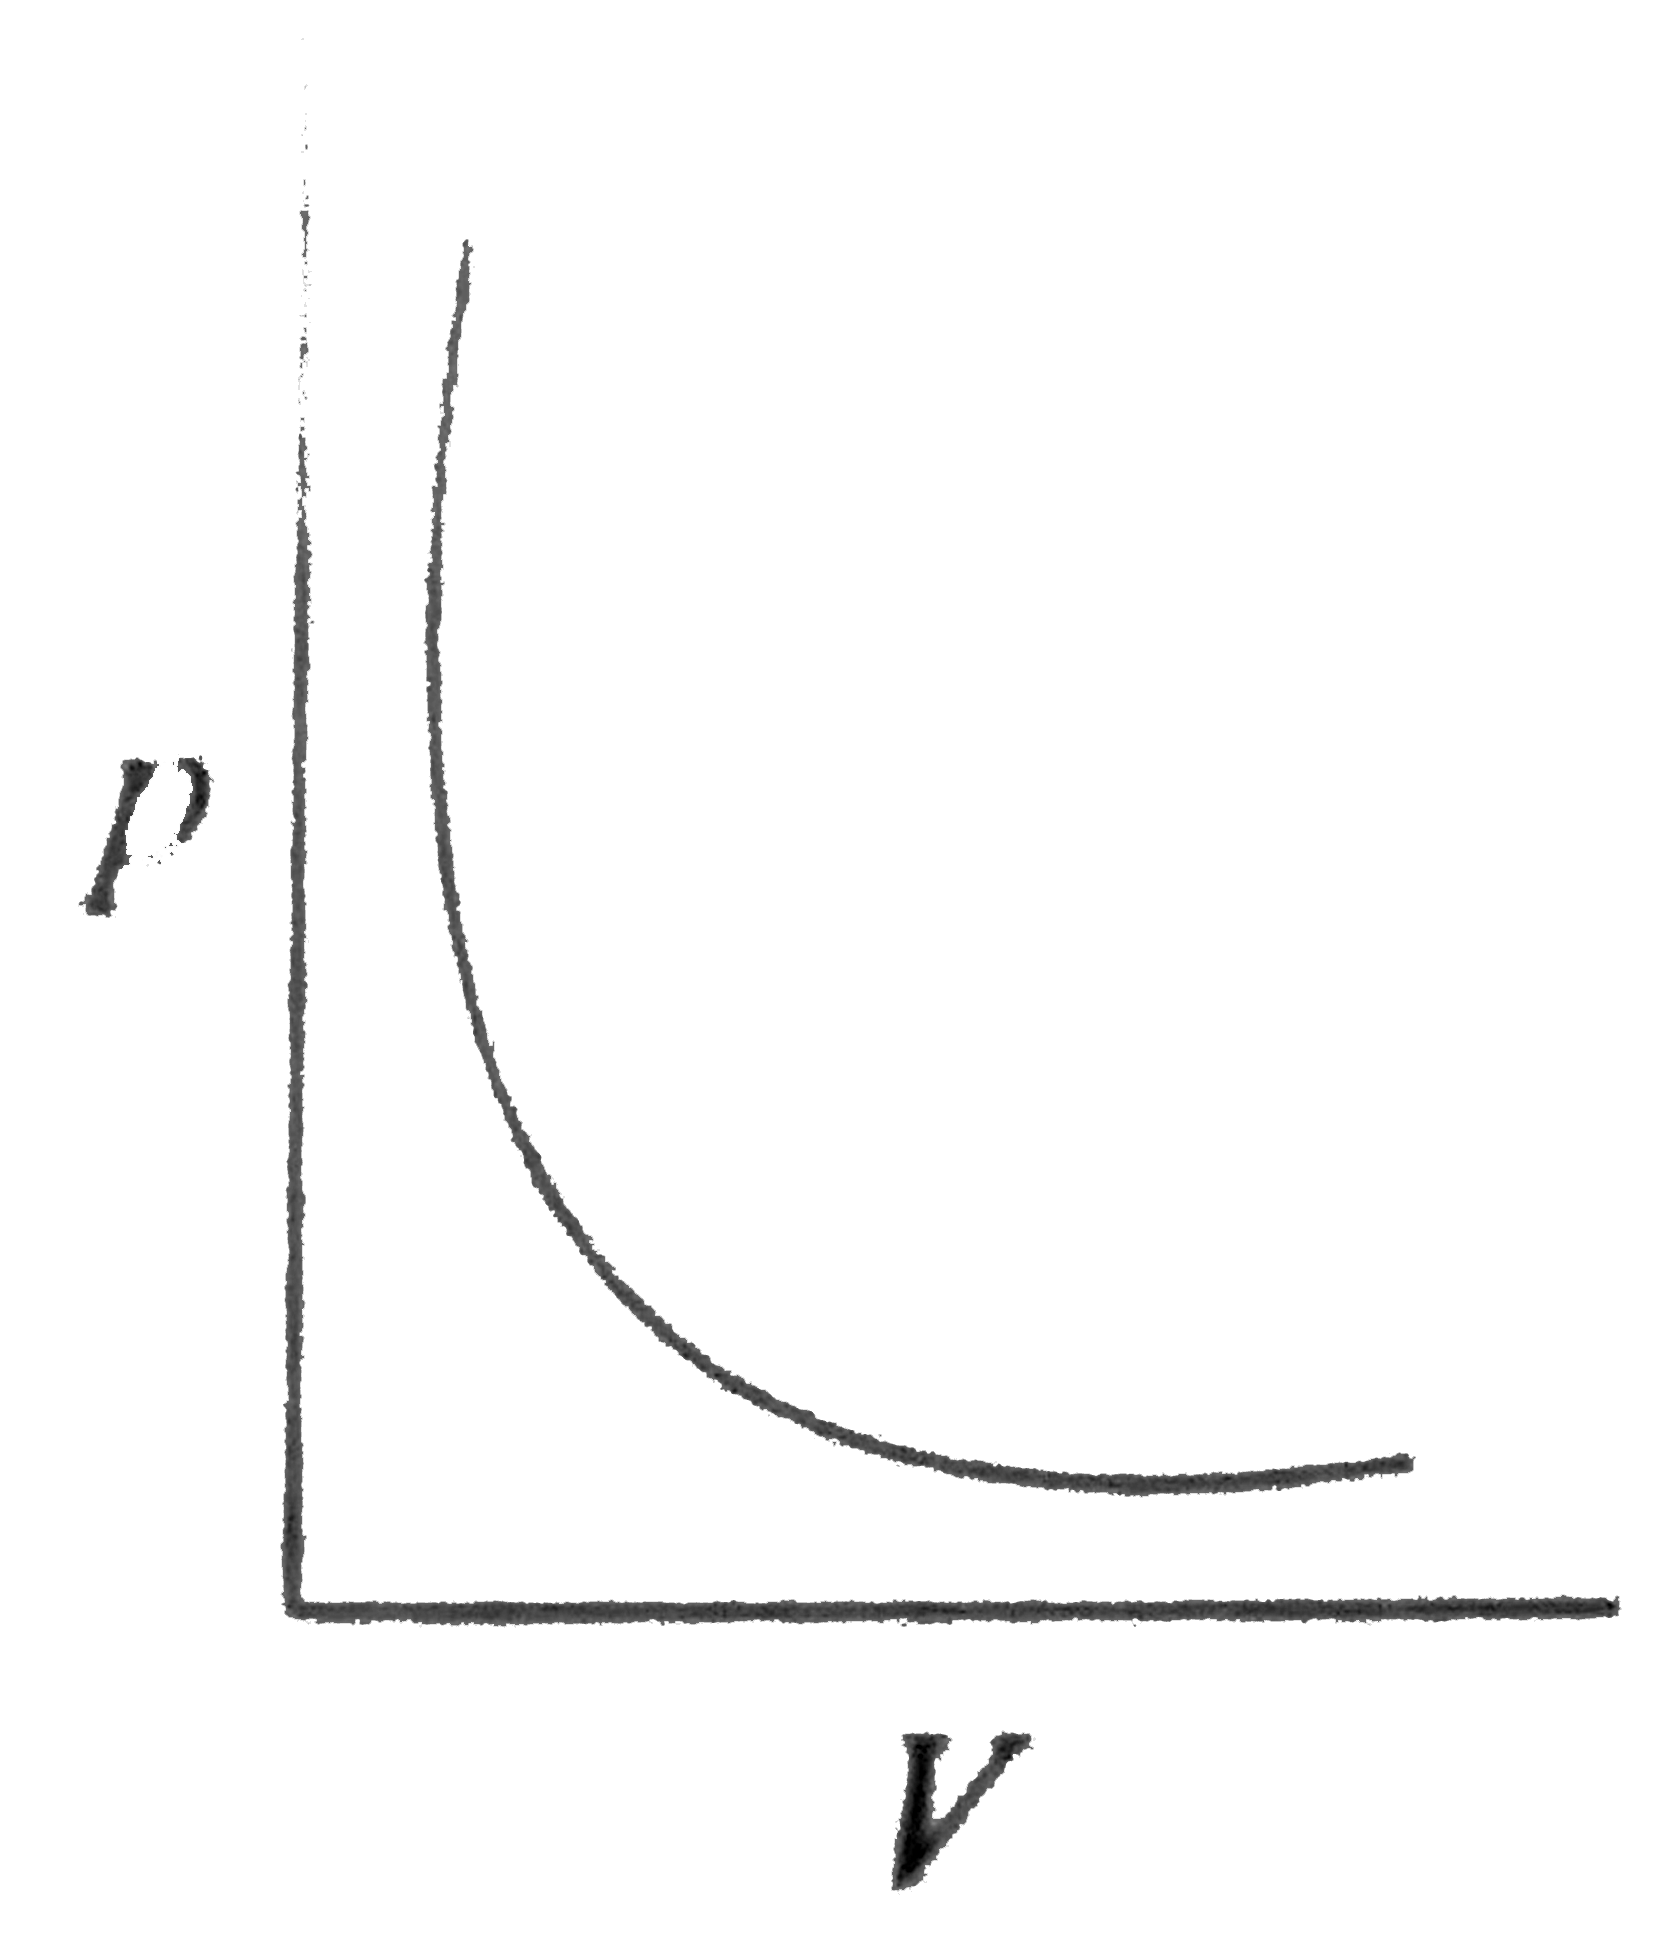
Which of the following plots does not represent the behaviour of an ideal binary liquid solution?
A
Plot of pA versus xA (mole fraction of A in liquid phase) is linear
B
Plot of pB versus xB is linear
C
Plot of ptotal versus xA (or xB) is linear
D
Plot of ptotal versus xA is non-linear
Video Solution
Text Solution
The correct Answer is:D
Plot of pTotal versus xA or xB is linear.
|
Topper's Solved these Questions
- SOLUTIONS Book:DINESH PUBLICATIONChapter:SOLUTIONS Exercise:REVISION QUESTION
Explore 186 Videos
- SOLUTIONS Book:DINESH PUBLICATIONChapter:SOLUTIONS Exercise:OBJECTIVE TYPE MCQs
Explore 47 Videos
- SOLID STATEBook:DINESH PUBLICATIONChapter:SOLID STATEExercise:Brain storming
Explore 10 Videos
- SOME BASIC CONCEPTS OF CHEMISTRYBook:DINESH PUBLICATIONChapter:SOME BASIC CONCEPTS OF CHEMISTRYExercise:ULTIMATE PREPARATORY PACKAGE
Explore 20 Videos
Similar Questions
Knowledge Check
Which of the following plots represents the behavior of an ideal binary liquid solution ?
APlot of PtotalvsYA (mol-fraction of A in vapour phase) is linearBplote of PtotalvsYB is linearCPlote of 1/PtotalvsYA is linearDPlote of 1/PtotalvsYB is non-linearWhich of the following plots represents the behavior of an ideal binary liquid solution ?
APlot of PtotalvsyA (mole fraction of A in vapour) is linearBPlot ofPtotalvsyB is linearCplot of 1/PtotalvsyA is linearDPlot of 1/PtotalvsyB is non linear.Which of the following plots does not represent Boyle's law?
A B
B C
C D
D
Which of the following does not represent ideal gas equation?
View SolutionThe graph that does not repersent the behaviour of an ideal gas is-
View SolutionA binary liquid solution of n-heptane and ethyl alcohol is prepared which of the following statements correctly represents the behaviour of this liquid solution?
View SolutionThe graph that does represent the behaviour of an ideal gas is :
View SolutionWhich of the following plots represents an exothermic reaction?
View Solution