Which of the following plots represents an exothermic reaction?
A

B

C

D

Text Solution
The correct Answer is:A
a) and are related to each other as:
In + constant term is negative, then the relation is: ln + constant term Graph.
similar to Y = mx + C, where m and C are both positive.
therefore, graph shown in option a) is correct.
|
Topper's Solved these Questions
- CHEMICAL KINETICSBOOK - DINESH PUBLICATIONCHAPTER - CHEMICAL KINETICSEXERCISE - Comprehension type
14 Videos
- CHEMICAL KINETICSBOOK - DINESH PUBLICATIONCHAPTER - CHEMICAL KINETICSEXERCISE - Stright objective types MCQs
24 Videos
- CHEMICAL KINETICSBOOK - DINESH PUBLICATIONCHAPTER - CHEMICAL KINETICSEXERCISE - Effect of temperature and catalyst on rate of reaction.
15 Videos
- CHEMICAL BONDING AND MOLECULAR STRUCTUREBOOK - DINESH PUBLICATIONCHAPTER - CHEMICAL BONDING AND MOLECULAR STRUCTUREEXERCISE - Unit Test - 1
20 Videos
- CHEMICAL THERMODYNAMICS AND CHEMICAL ENERGETICS BOOK - DINESH PUBLICATIONCHAPTER - CHEMICAL THERMODYNAMICS AND CHEMICAL ENERGETICS EXERCISE - Exercise
507 Videos
Similar Questions
Knowledge Check
Which of the following graph represents an exothermix reaction?
A B
B C
C D
D
Which plot represent an exothermic reaction ?
A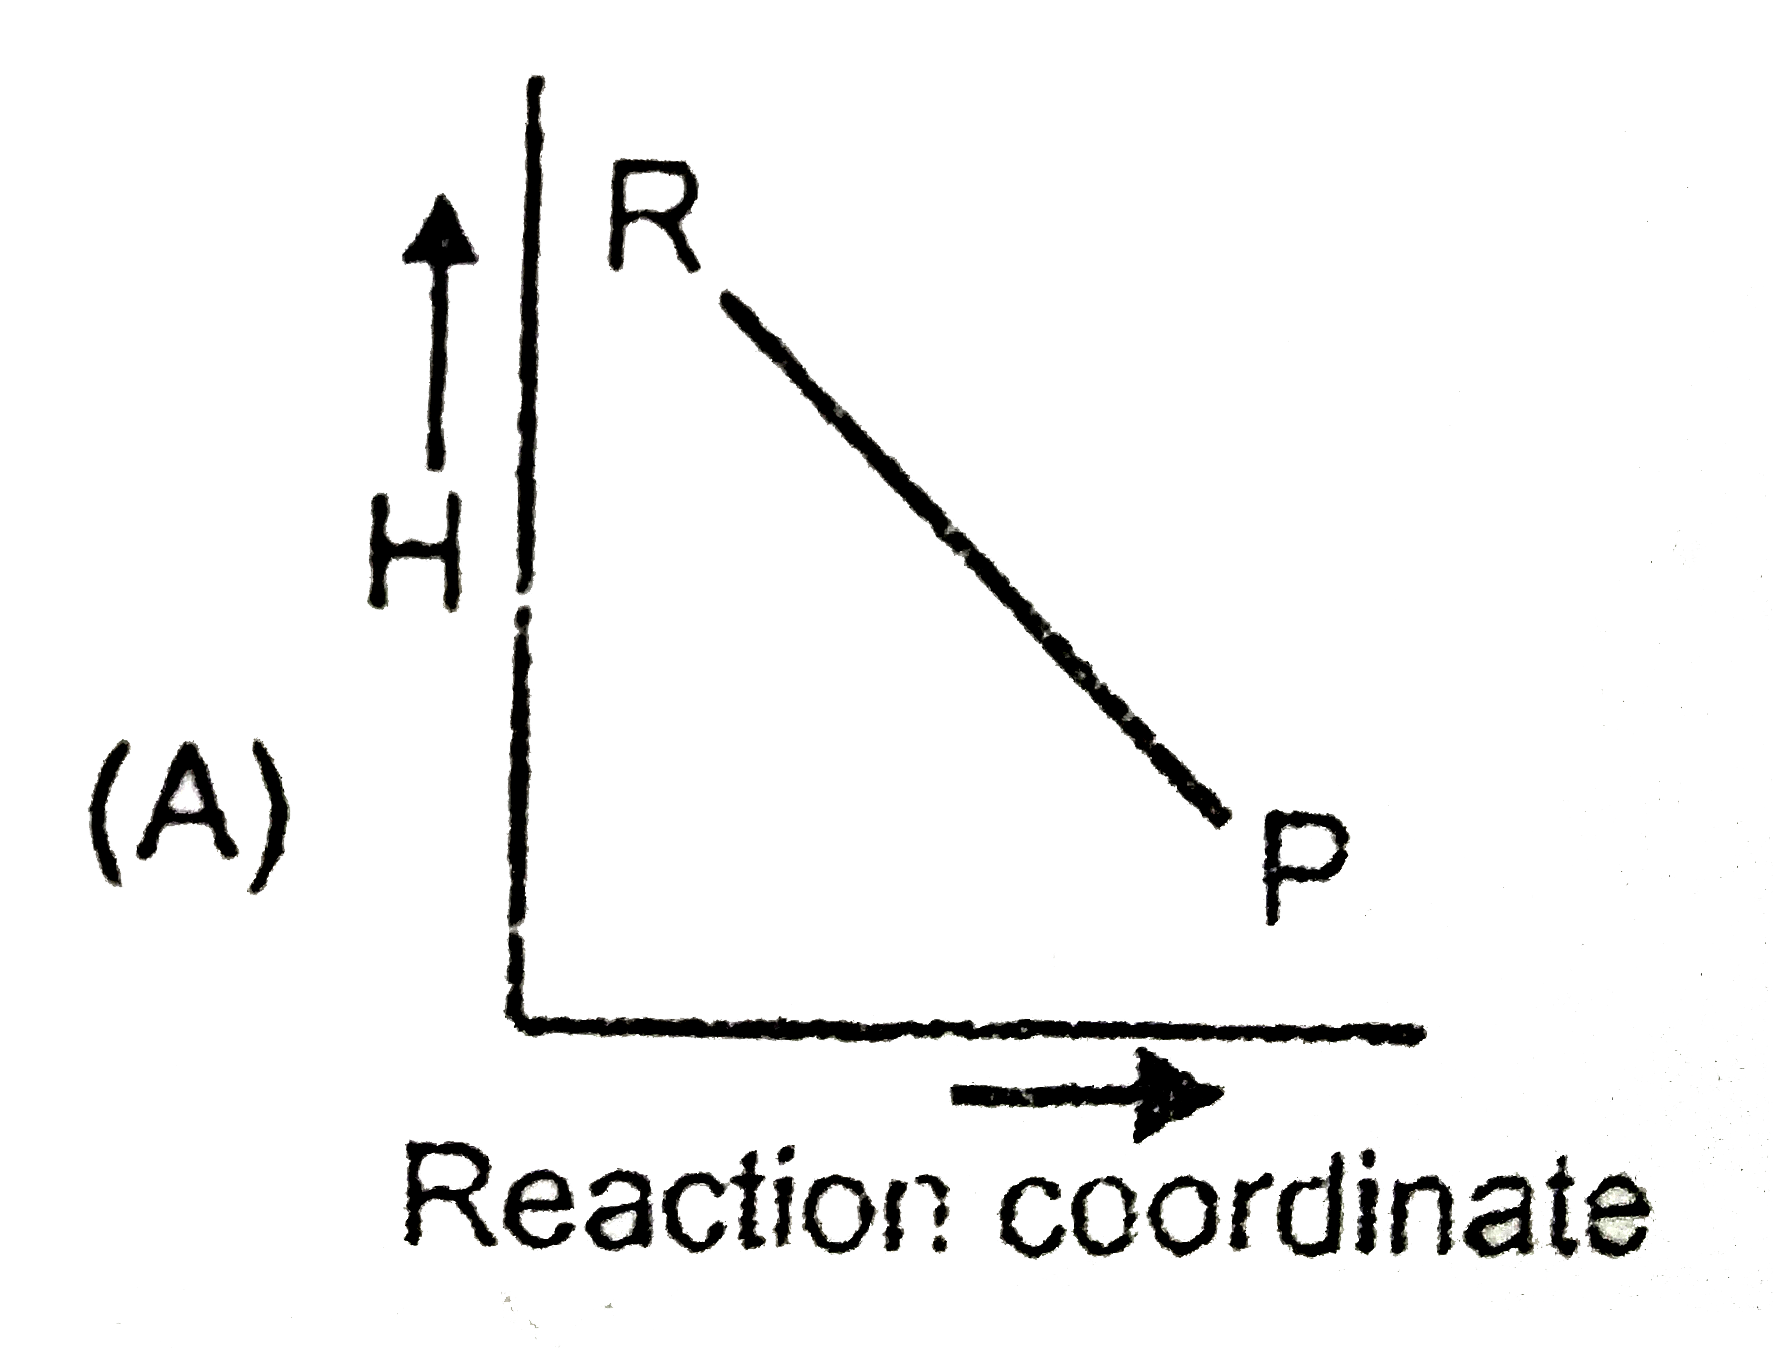 B
B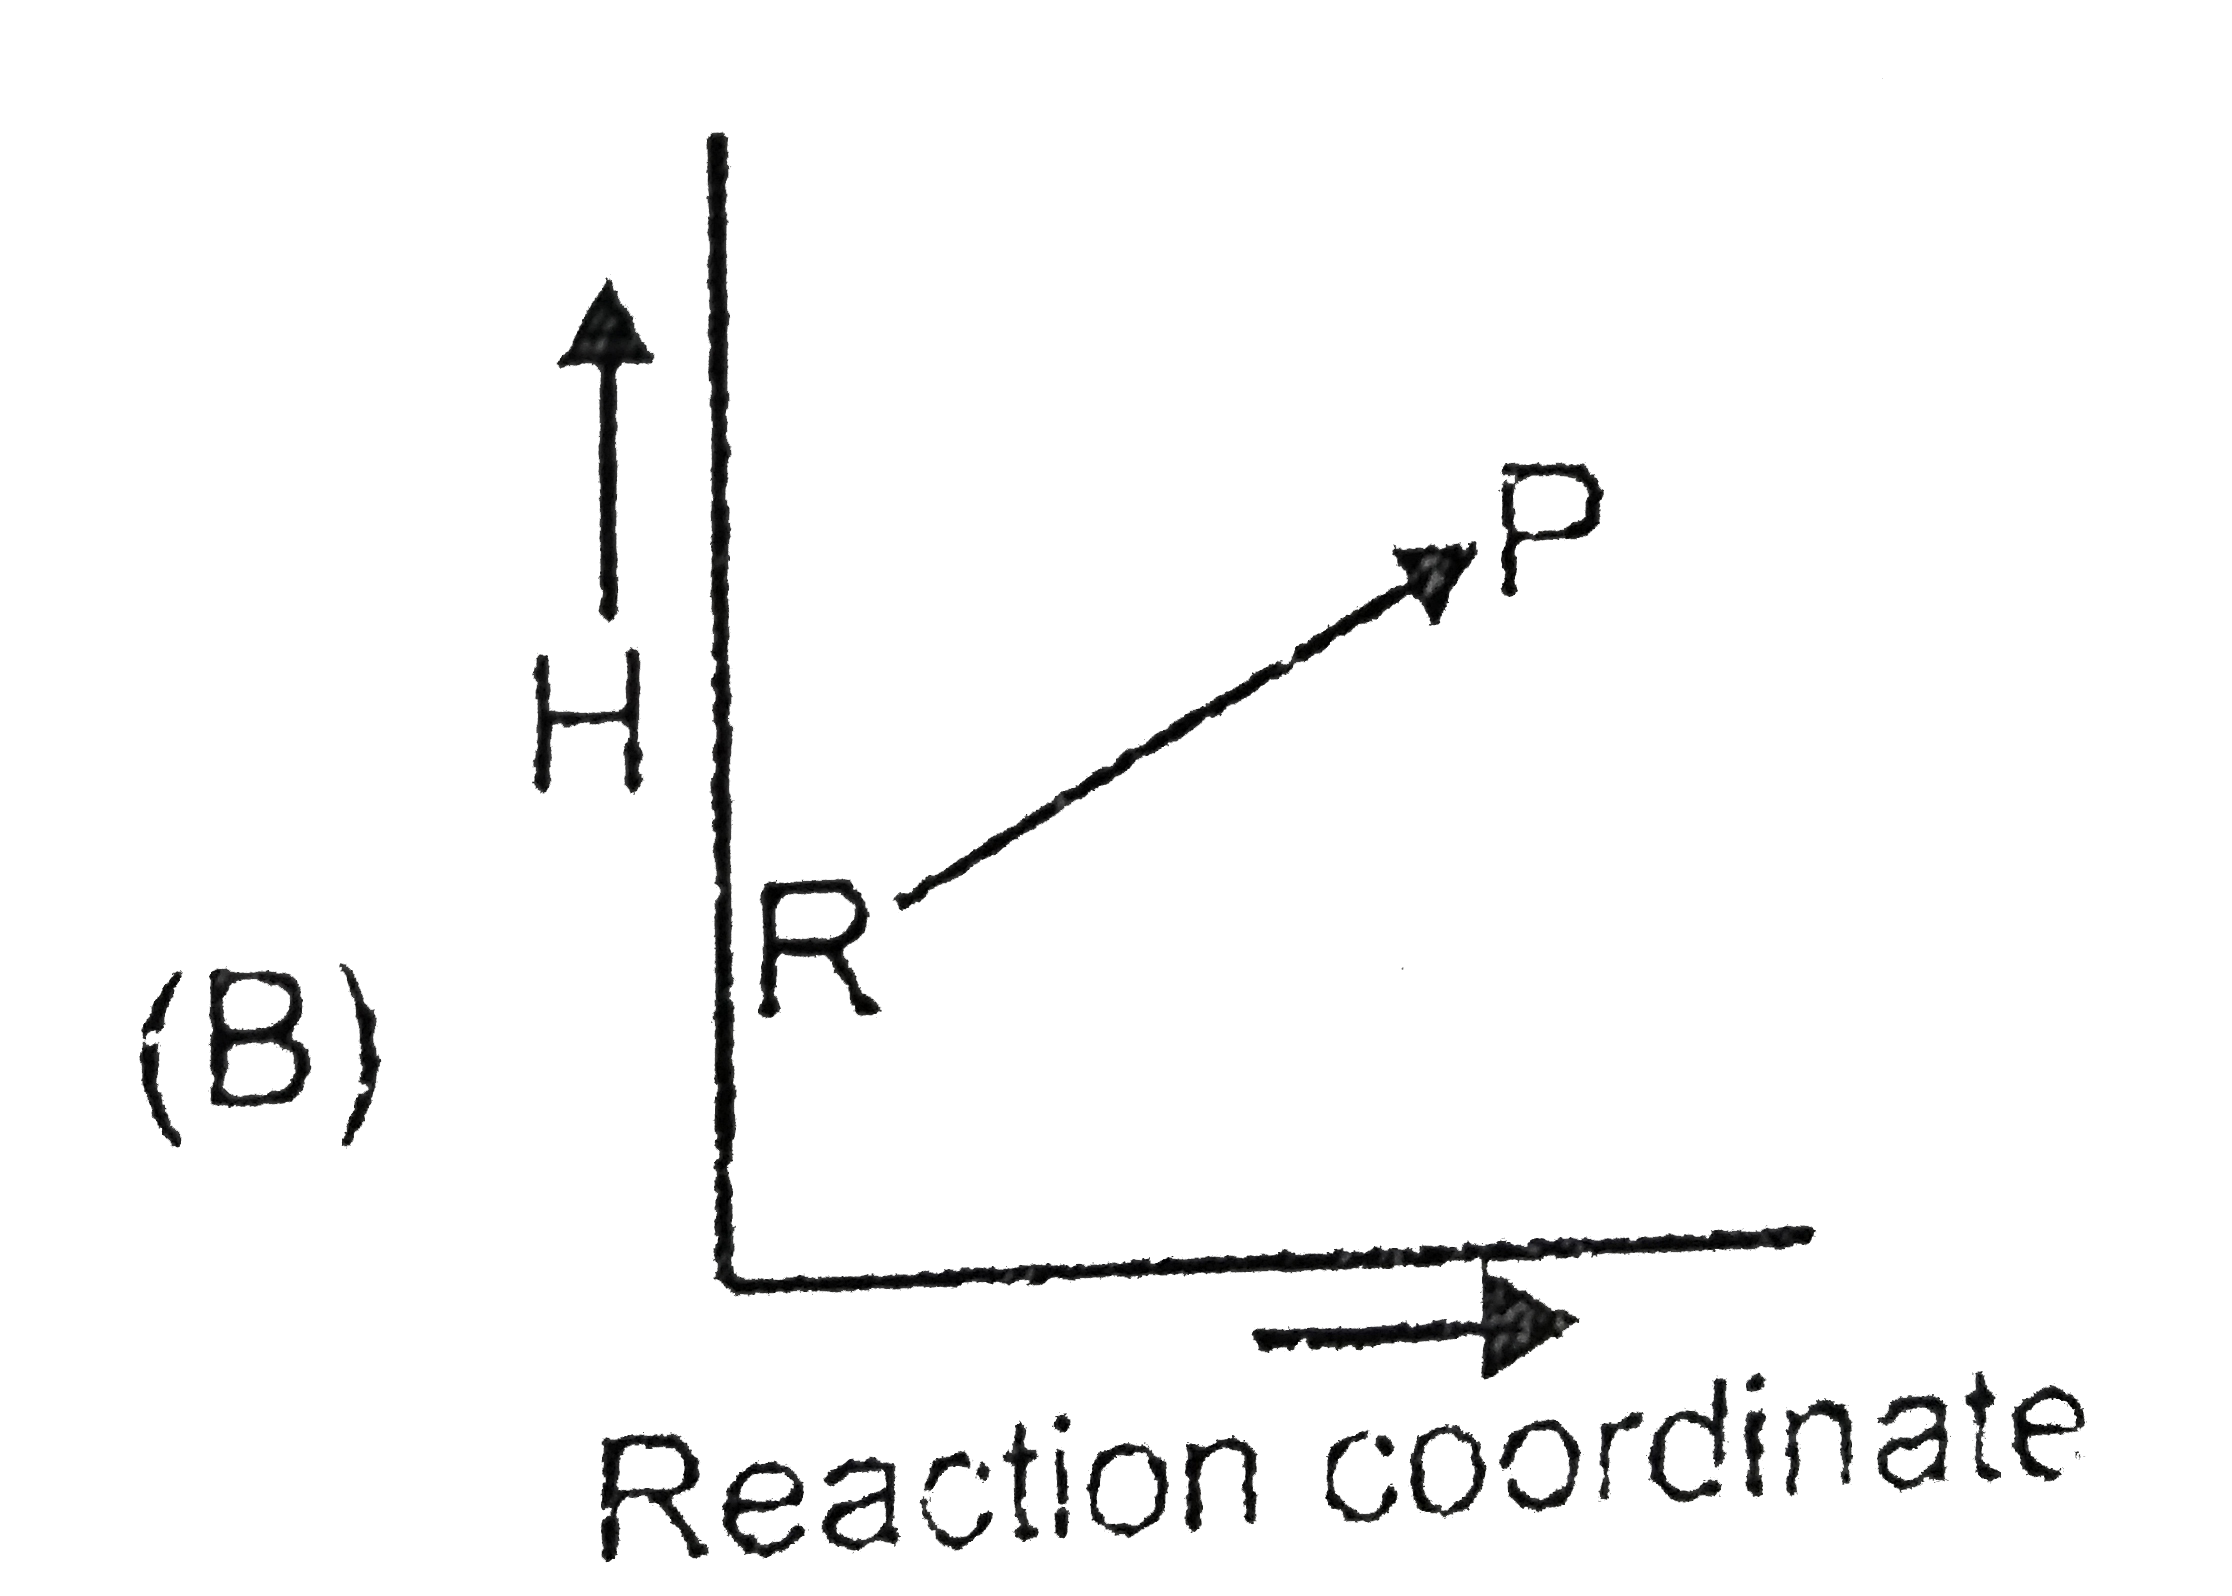 C
C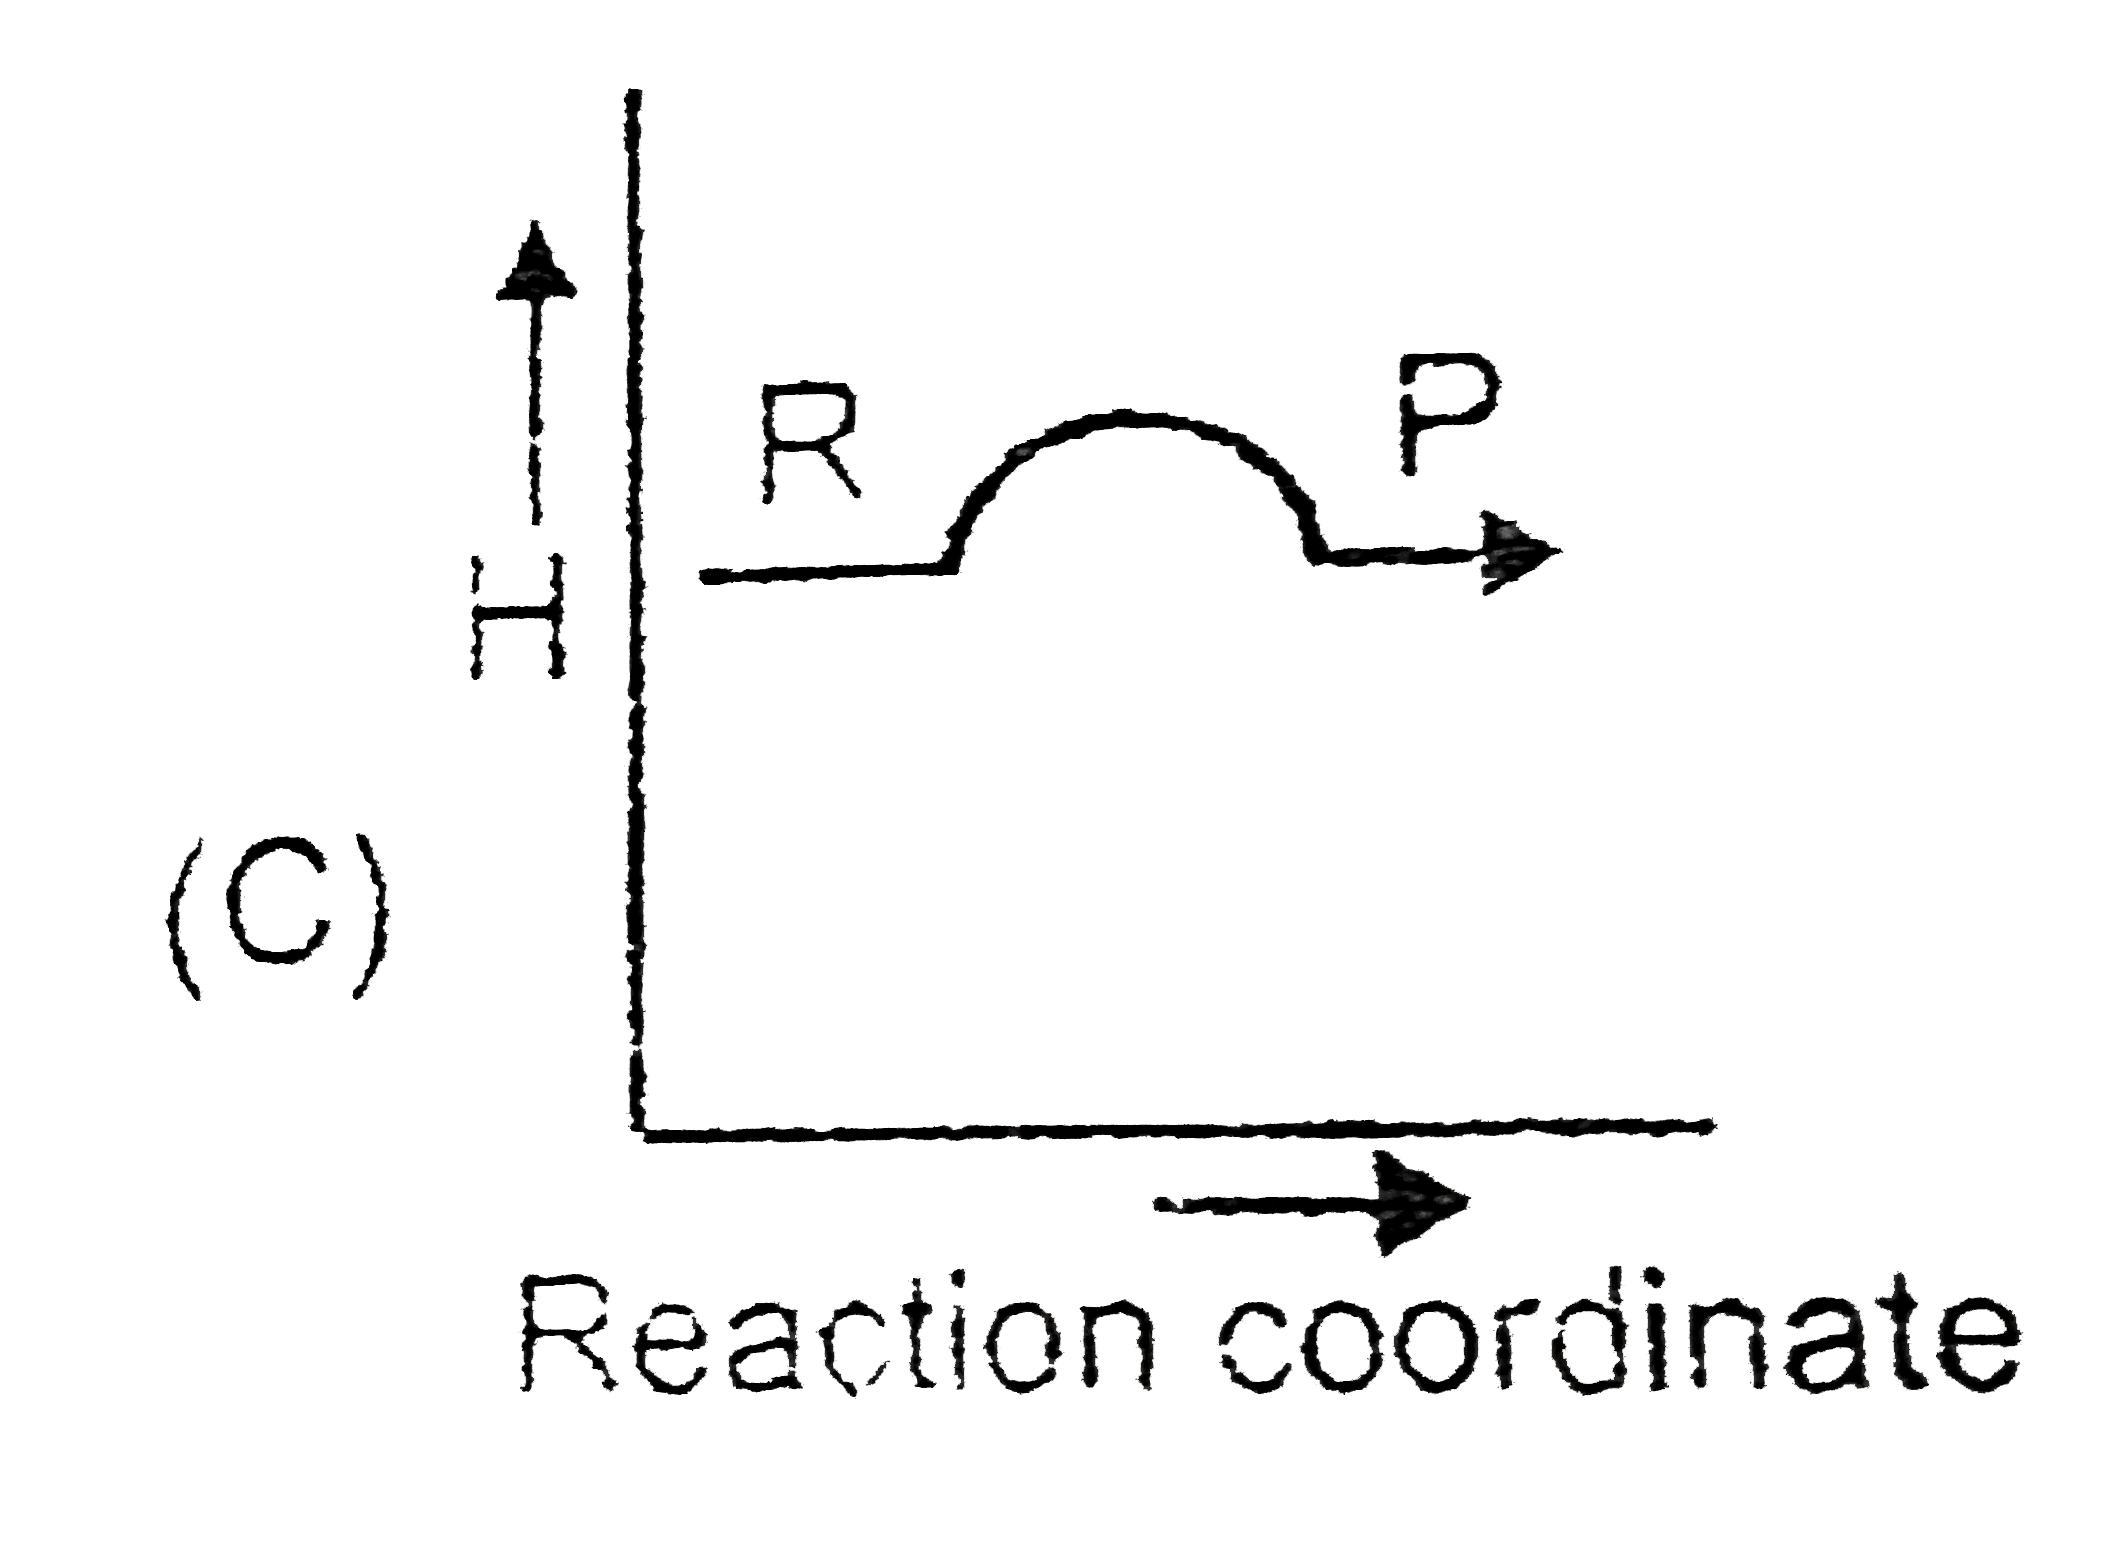 D
D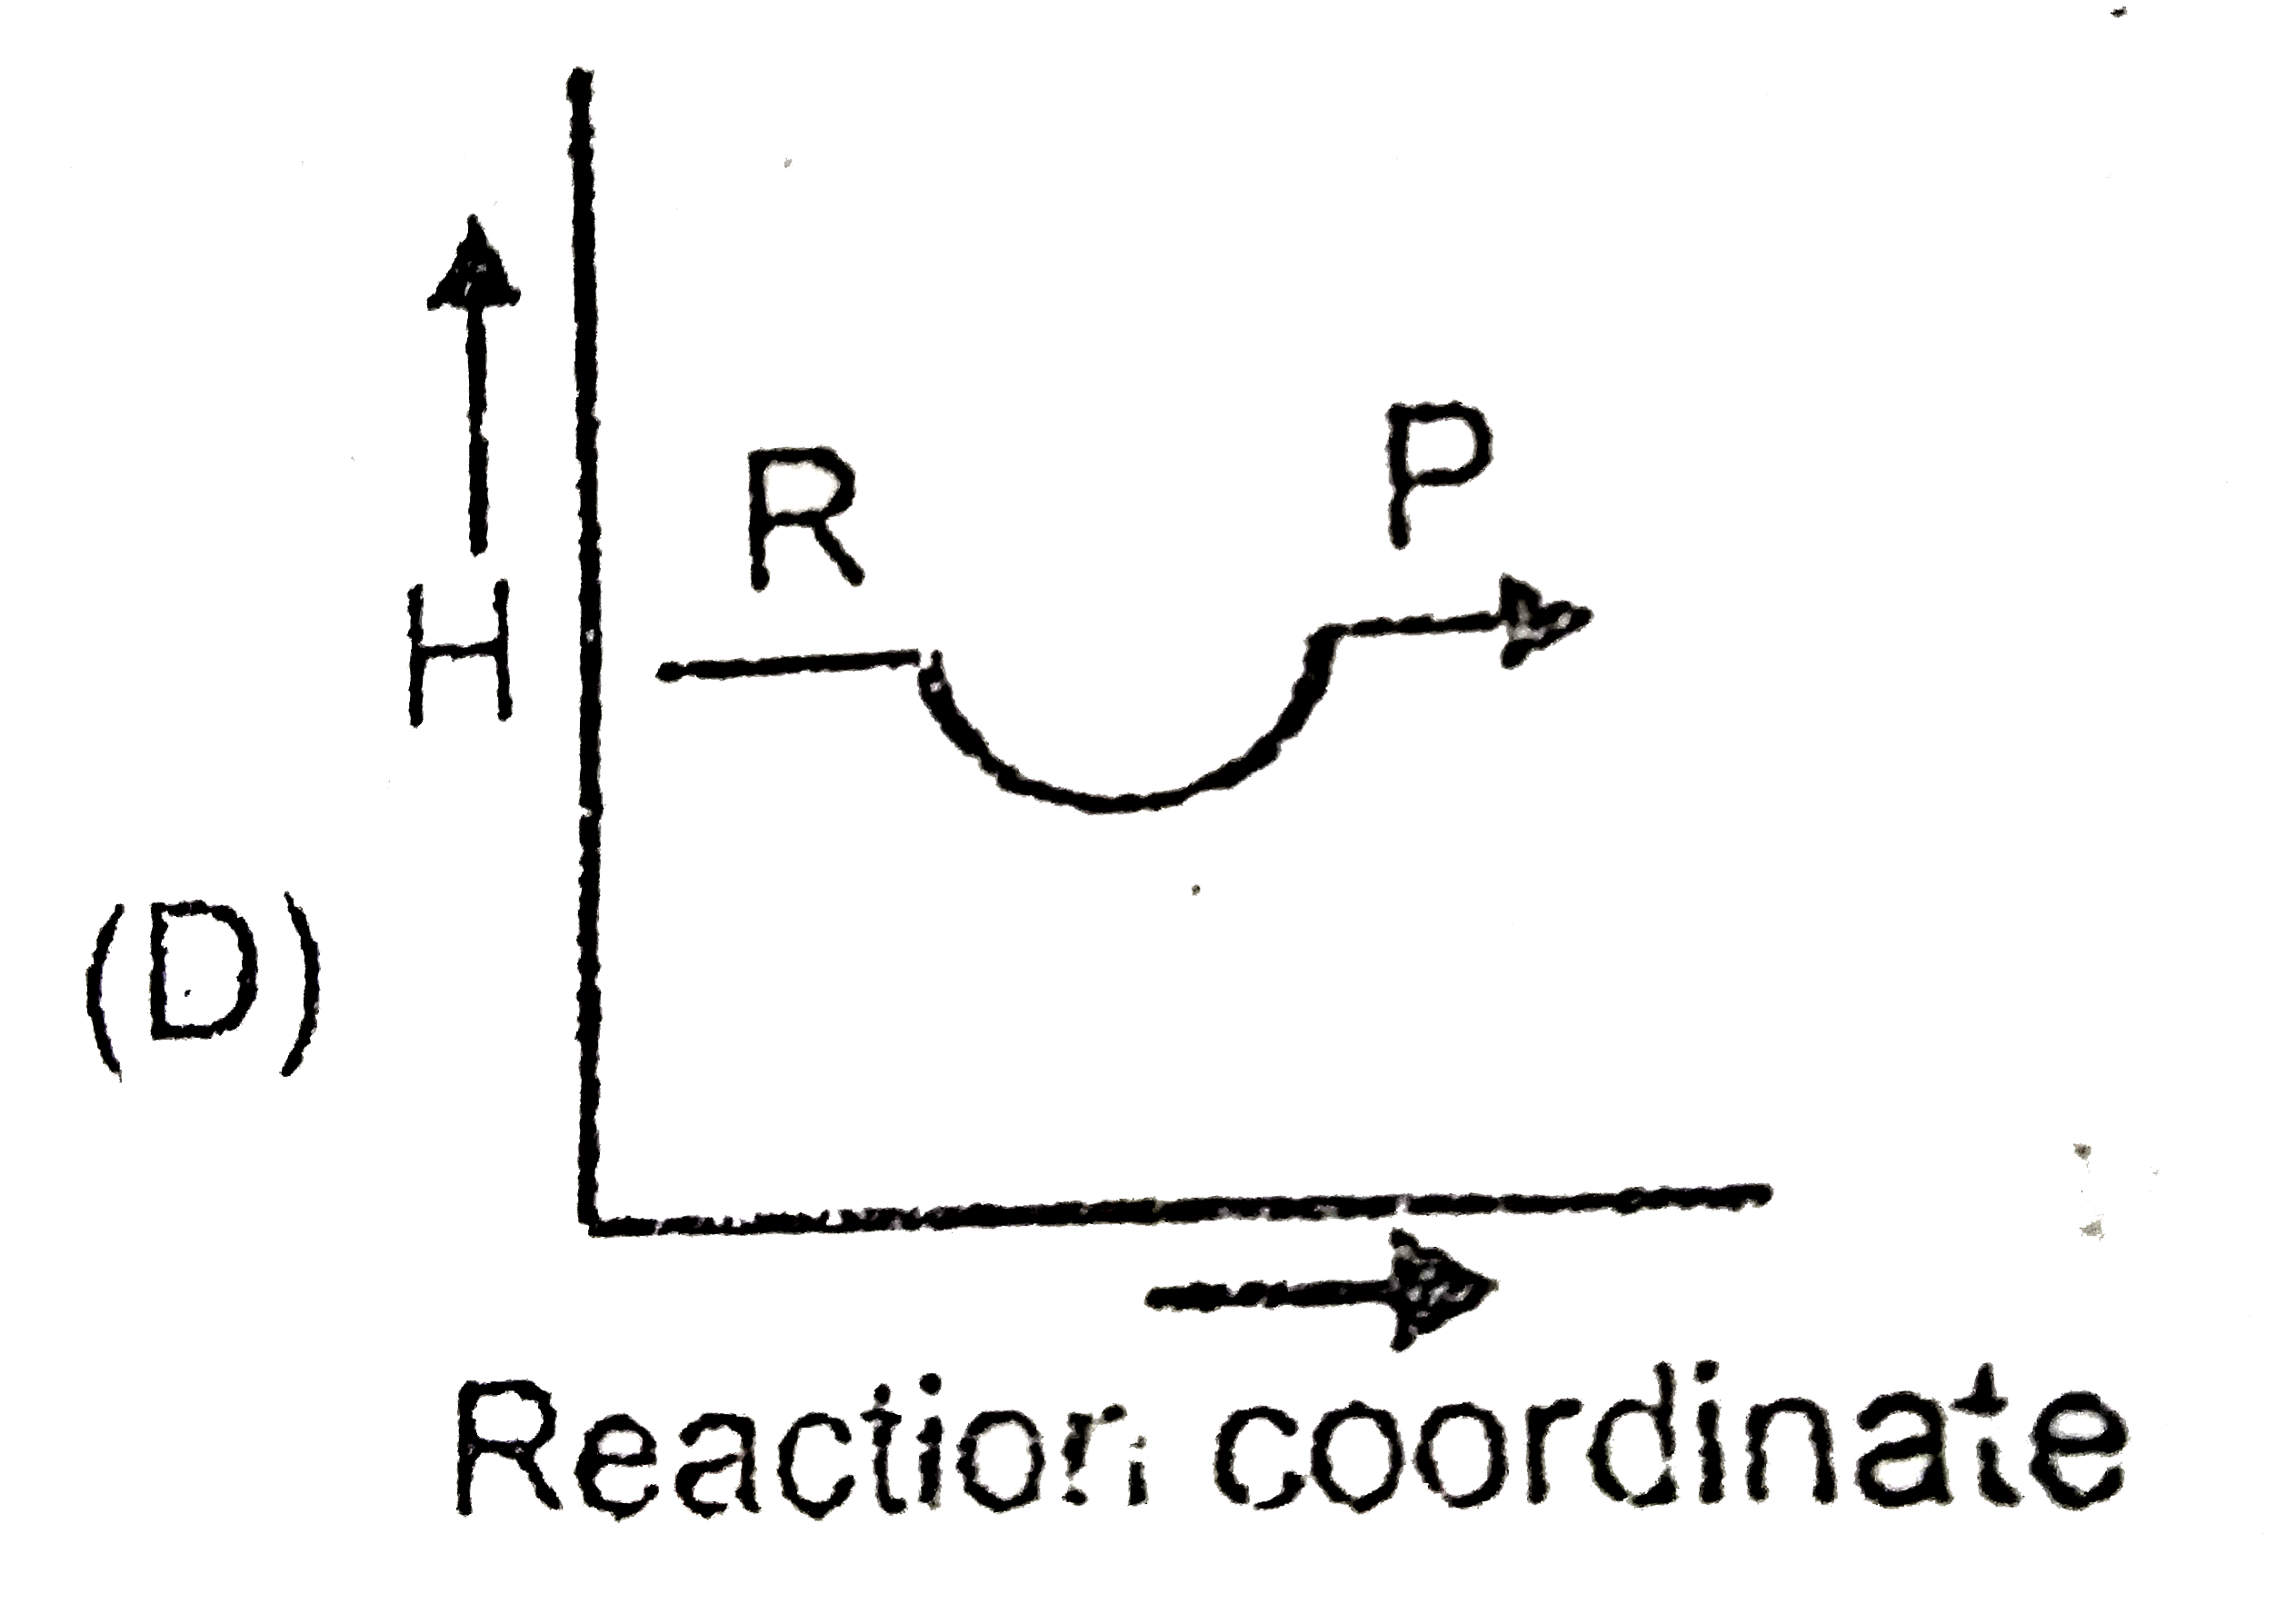
Which of the following represents an exothermic reaction :-
AN2(g)+O2(g)→2NO(g),ΔH=180.5KJBH2O(g)+C(s)→CO(g)+H2(g),ΔE=131.2KJC2HgO(s)+180.4KJ→2Hg(l)+O2(g)D2Zn(s)+O2(g)→2ZnO(s),ΔE=−693.8KJ
Which of the following graphs represents exothermic reaction?

View SolutionWhich of the following graphs represents exothermic reaction ?
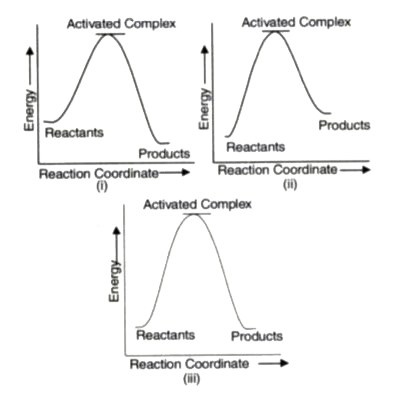
View SolutionWhich of the following graphs represents exothermic reaction ?

View SolutionWhich of the following graphs represents exothermic reaction ?

View SolutionWhich of the following graph represents exothermic reaction ?
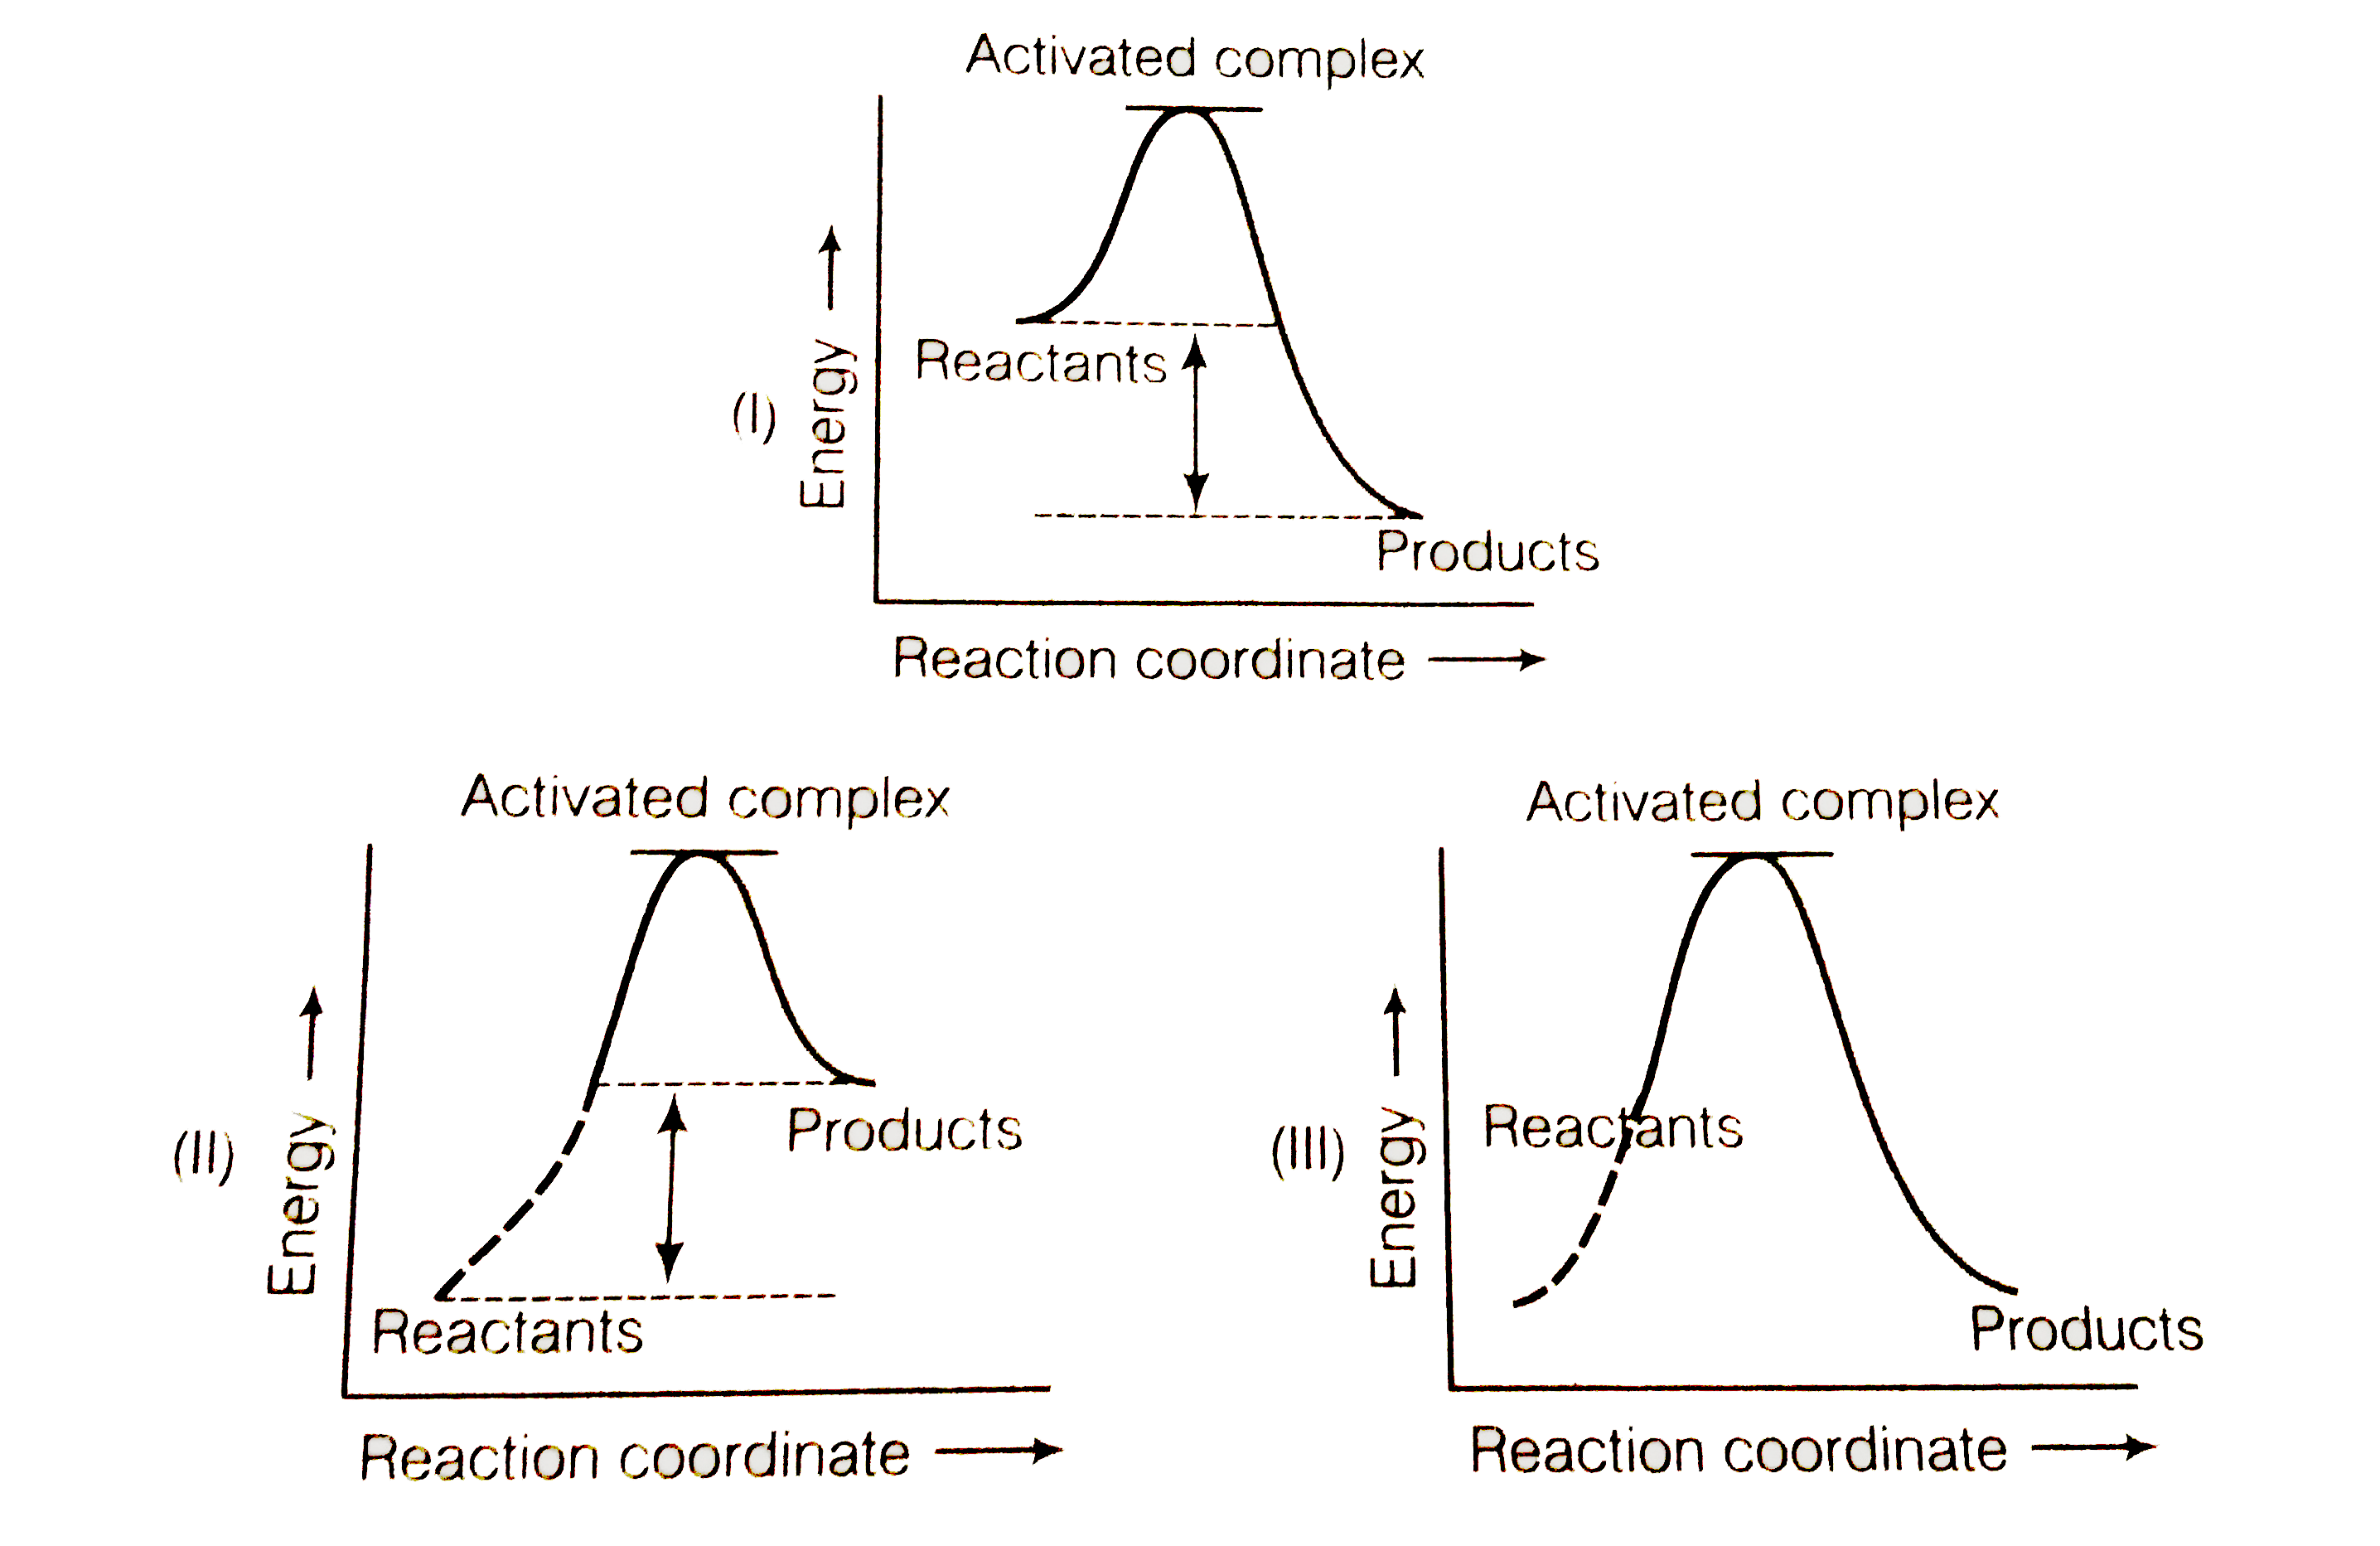
View Solution
