Wllingham diagrams can be drawn for the
sulphides
oxides
halides
all of these
The correct Answer is:D
The graph which represents variation of standard free energy with temperature for the formation of oxides of elements is called Ellingham diagram. These diagrams are generally drawn for oxides, but can also be drawn for halides and sulphides.
Topper's Solved these Questions
- GENERAL PRINCIPALS AND PROCESSES OF ISOLATION OF ELEMENTSBOOK - MTG GUIDECHAPTER - GENERAL PRINCIPALS AND PROCESSES OF ISOLATION OF ELEMENTSEXERCISE - Check Your NEET/VITALS
1 Videos
- GENERAL PRINCIPALS AND PROCESSES OF ISOLATION OF ELEMENTSBOOK - MTG GUIDECHAPTER - GENERAL PRINCIPALS AND PROCESSES OF ISOLATION OF ELEMENTSEXERCISE - Check Your NEET/ITALS
24 Videos
- GENERAL PRINCIPALS AND PROCESSES OF ISOLATION OF ELEMENTSBOOK - MTG GUIDECHAPTER - GENERAL PRINCIPALS AND PROCESSES OF ISOLATION OF ELEMENTSEXERCISE - AIPMT/NEET (MCQs)
10 Videos
- ELECTROCHEMISTRYBOOK - MTG GUIDECHAPTER - ELECTROCHEMISTRYEXERCISE - AIPMT/NEET(MCQs)
5 Videos
- HALOALKANES AND HALOARENES BOOK - MTG GUIDECHAPTER - HALOALKANES AND HALOARENES EXERCISE - AIMPT/NEET
10 Videos
Similar Questions
In the diagram, the x-axis denotes the number of individuals with a certain phenotype. The dotted lines denote the phenotypes favoured by natural selection. Which of the following inferences can be drawn from the given diagram?
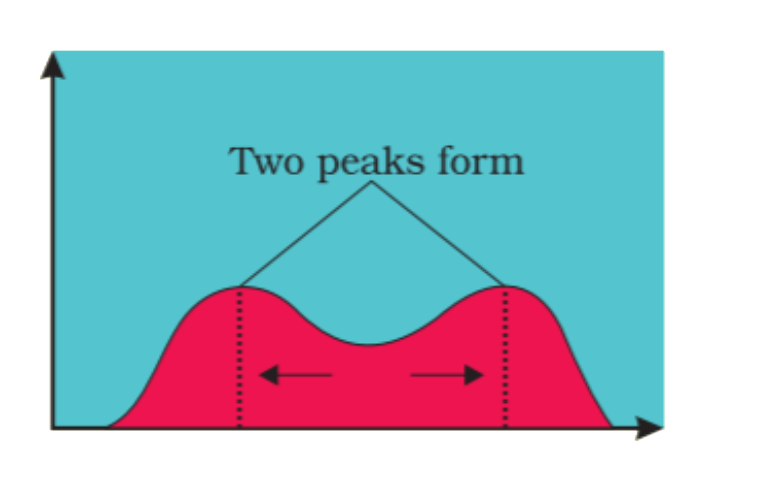
View SolutionIn the diagram, the x-axis denotes the number of individuals with a certain phenotype. The dotted lines denote the phenotypes favoured by natural selection. Which of the following inferences can be drawn from the given diagram?

View Solution
Knowledge Check
Ellingham diagram can be drawn for the following:
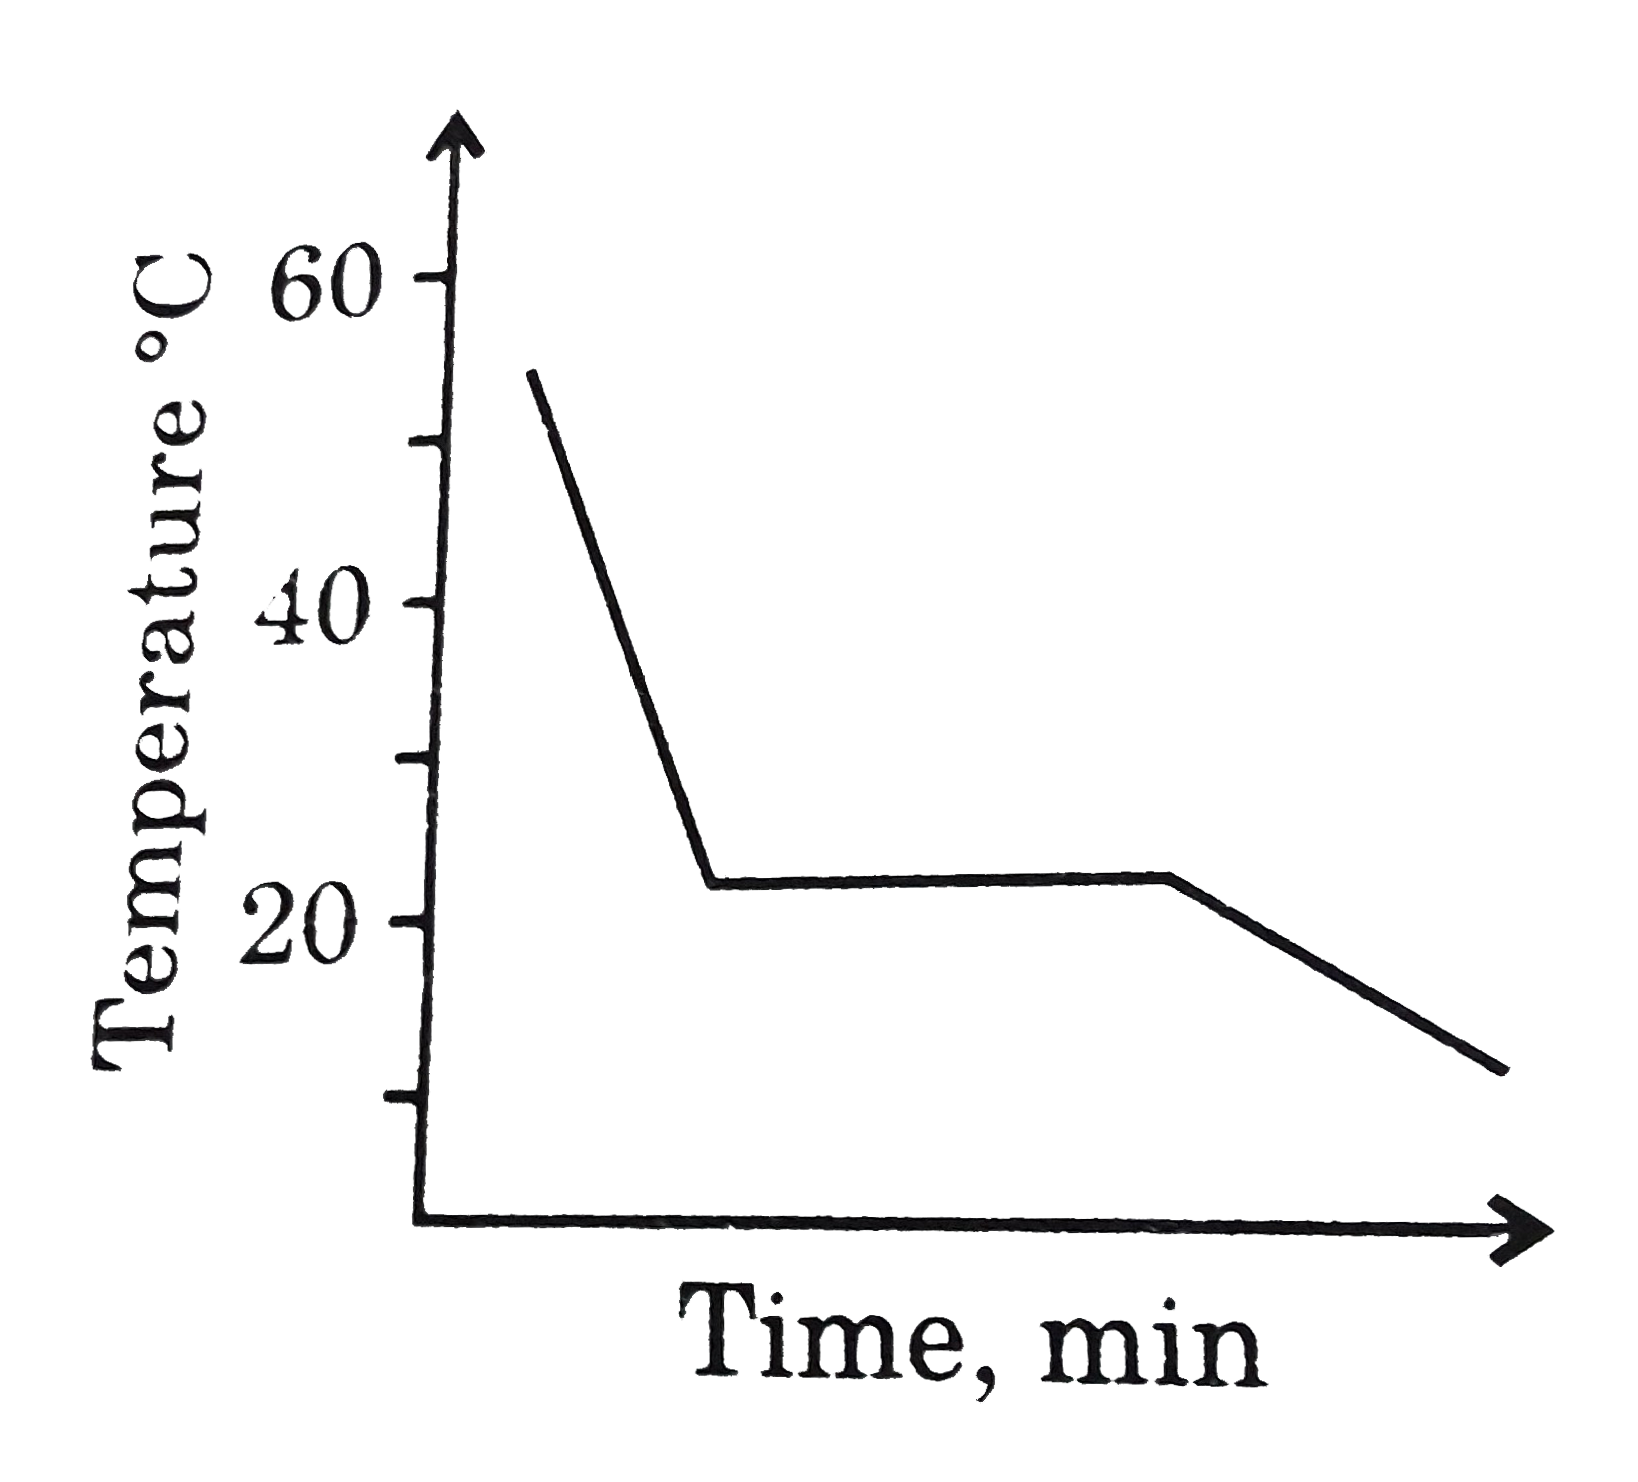
ASulphidesBOxidesCHalidesDAll of theseThis diagram represents the behaviour of a pure solvent upon cooling. Which of the diagrams below best represents the cooling curve of a solution in that solvent upon cooling ? (Assume that all diagrams are drawn to the same scale.)
 A
A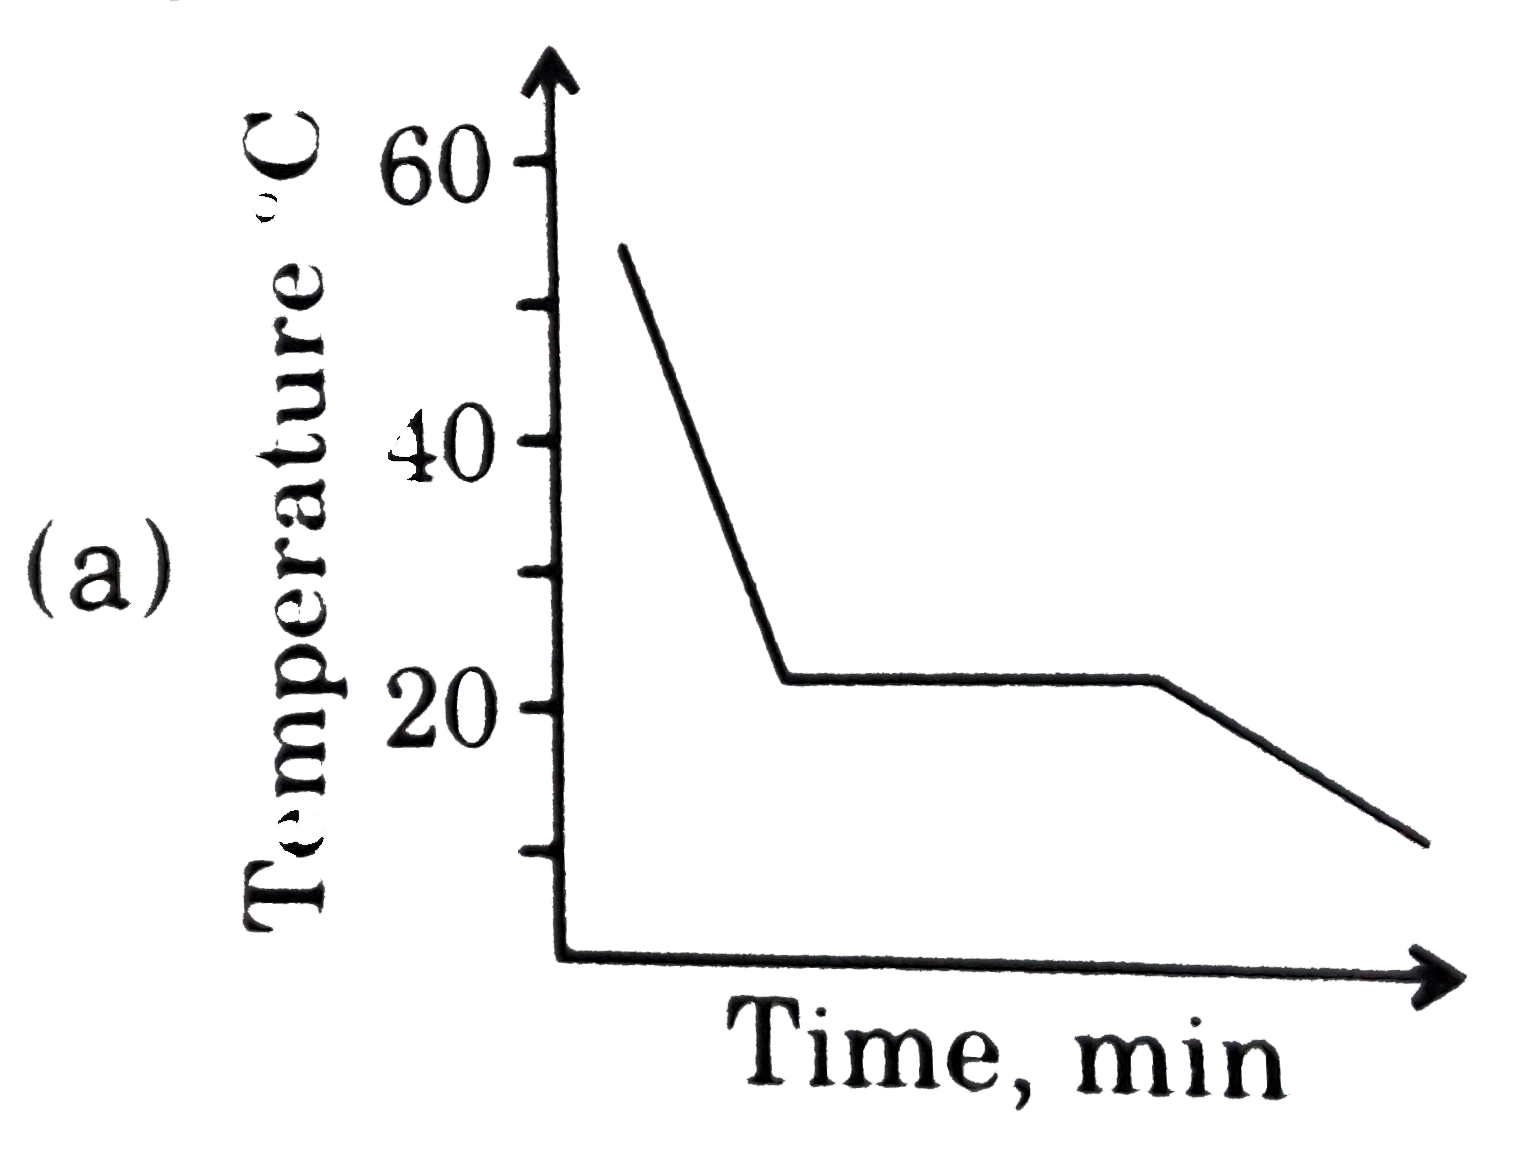 B
B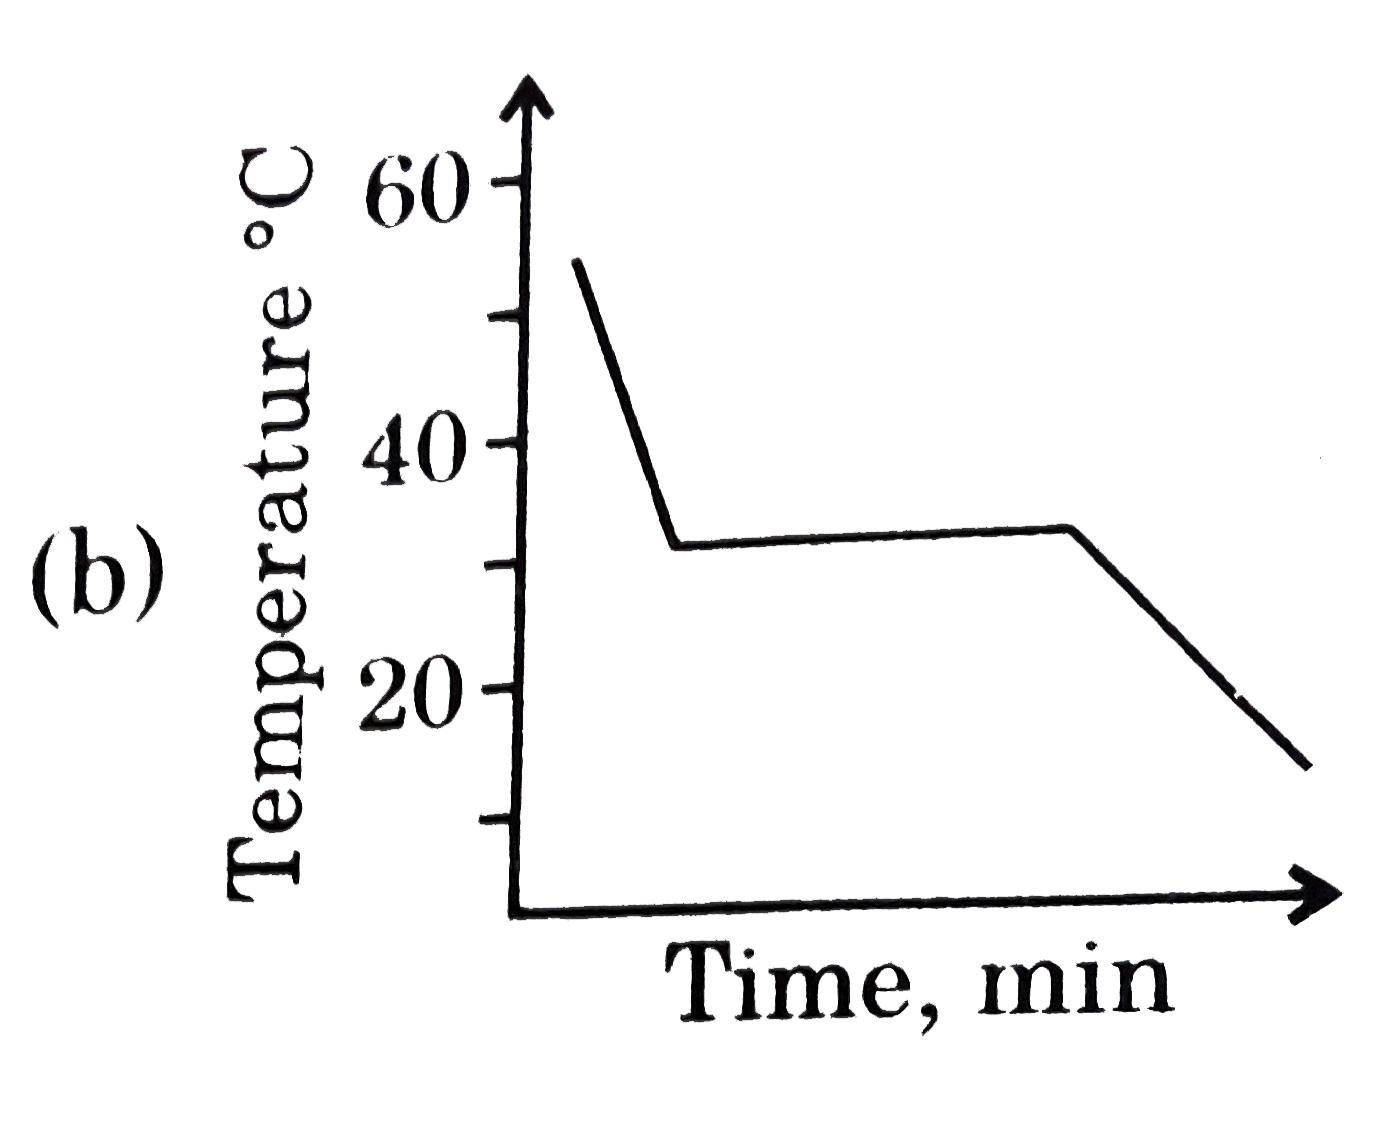 C
C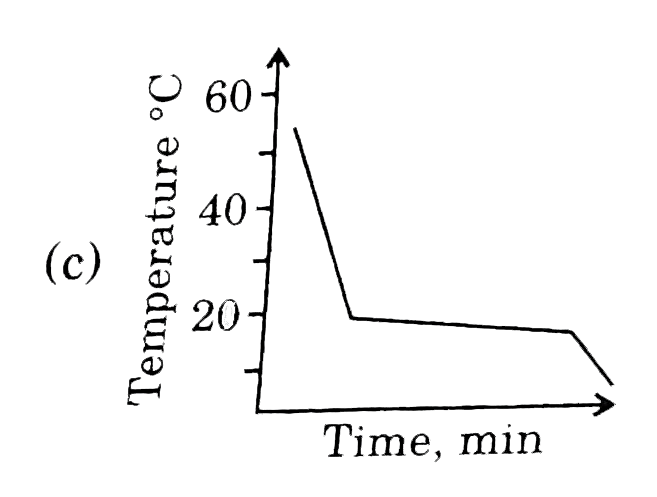 D
D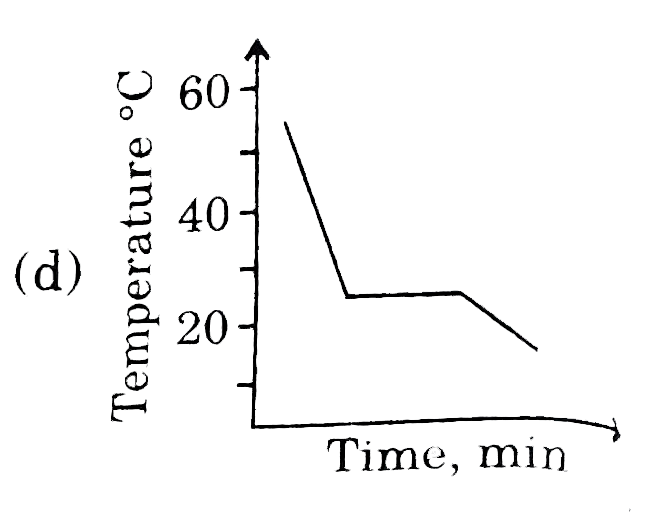
The diagram shows estimated values for carbon fixation in a terrestrial ecosystem. Figures refer to tonnes x 109 , fixed or available for fixation.
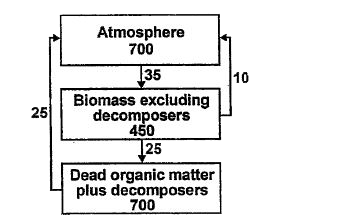
Which conclusion can be drawn from the diagram?AThere is a net gain to the producers.BThe system is in balance.CThere is a net loss to. the atmosphere.DThere is a net loss to the decomposers.

What inference can be drawn from the above diagrams?
View Solution
(a) Identify the mistakes (s) in the diagrams and give justification.
What inference can be drawn from above diagrams ?
View SolutionThe diagram shows the dimensions of the floor of an L-shaped room. (All the angles are right angles). The area of the largest circle that can be drawn on the floor of this room is
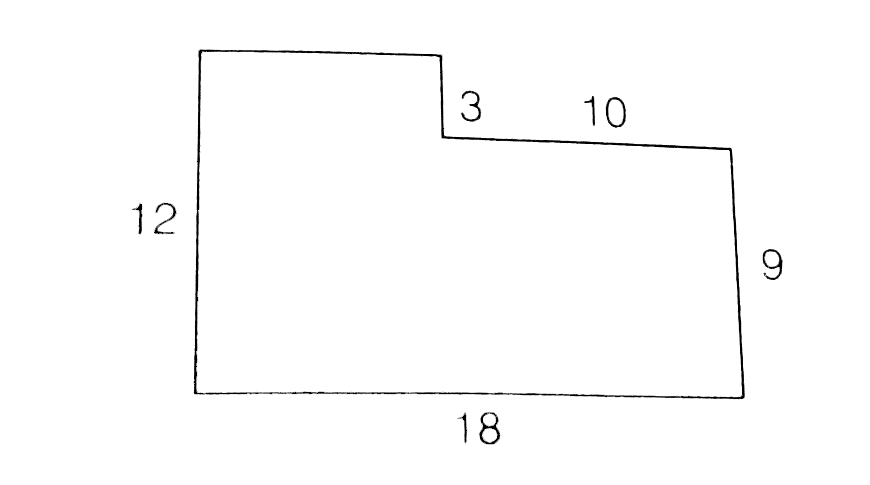
View SolutionThe diagram shows the dimensions of the floor of an L-shaped room. (All the angles are right angles). The area of the largest circle that can be drawn on the floor of this room is

View SolutionState a conclusion that can be drawn on the basis of this observation
View Solution
